One year after the August 2025 tariff escalation between the United States and Canada, the question most commonly asked about its economic impact turns out to have been the wrong one. The debate centred on whether Canada would absorb the cost. The data shows it was American households that did.
22 August 2025 marked a decisive escalation in US-Canada trade policy, and twelve months of price data, Federal Reserve reporting, and housing market evidence now allow a cleaner read on how those costs actually moved through the economy. This is a moment where economic theory and observable outcomes can be compared directly, and the comparison is not flattering for the assumptions that shaped the original policy debate.
What the past year’s data actually tells you about tariffs, inflation, and the Fed’s room to manoeuvre is more uncomfortable than either side of the political argument has acknowledged. The cost incidence landed where economists predicted it would, the housing channel proved real and lagged, and the Federal Reserve’s constrained response has implications for the interest-rate outlook that are still unfolding. Here is the framework for reading all three.
Who actually paid the tariff bill
The assumption was intuitive and politically convenient: tariffs would force Canadian exporters to lower their prices, and the cost would land on the other side of the border. One year of data says otherwise.
The mechanics of tariff collection are frequently misunderstood. Duties are levied on domestic importers at the point of entry, not billed to the exporting country’s government. Once an importer pays the duty, the cost distributes through three channels:
- Margin absorption: the importing business eats some of the cost, compressing its own profit
- Supplier price negotiation: the importer pushes back on the foreign supplier to share the burden
- Consumer pass-through: the importer raises the price of the finished product
The weight of empirical evidence for the 2025 tariff round falls heavily on the third channel. American consumers and businesses bore the primary cost, with foreign exporters absorbing only a limited share.
The household tariff burden from the 2025-2026 escalation rounds is estimated at $1,830 to $2,600 in added annual costs per American family, with vehicles, electronics, and pharmaceuticals accounting for the largest individual line items within that total.
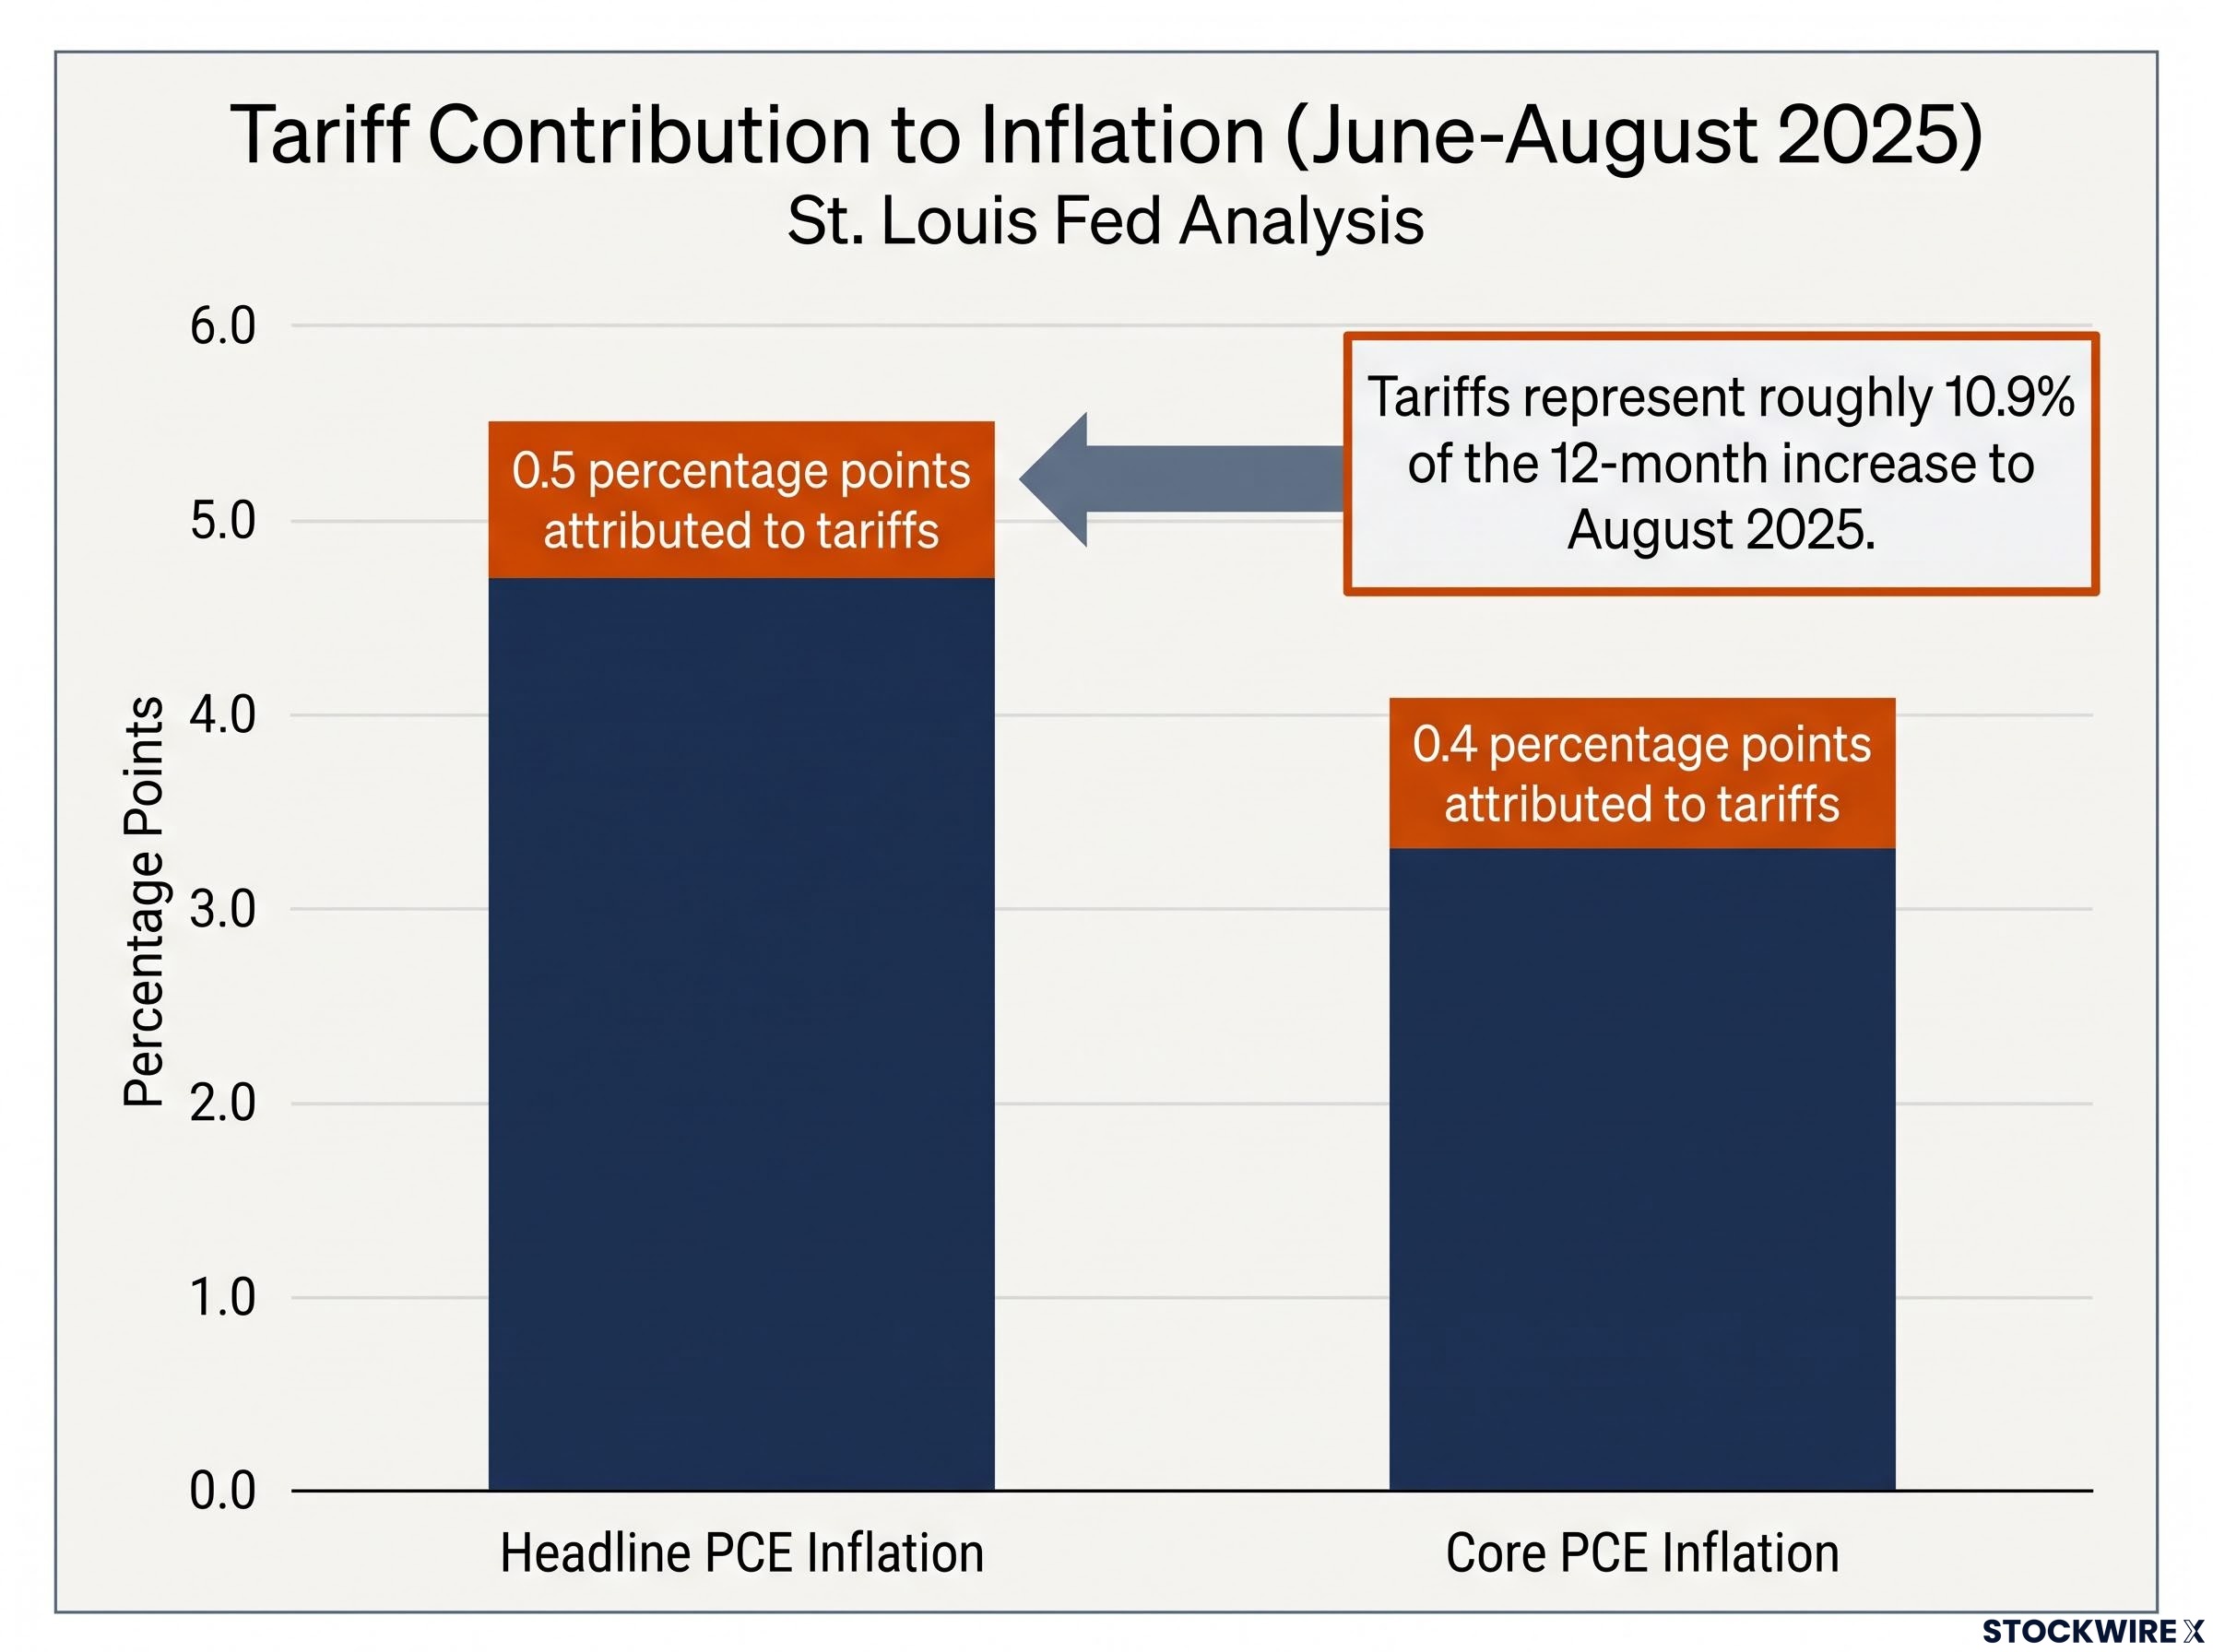
The St. Louis Fed attributed approximately 0.5 percentage points of annualised headline PCE inflation and 0.4 percentage points of core PCE inflation over June-August 2025 to tariffs, representing roughly 10.9% of the 12-month increase in headline PCE to August 2025.
Import price indices showed cost increases running faster than consumer price indices during the same period, a pattern that tells you firms were absorbing some of the hit in margins before passing the rest through to final prices. The pass-through was real, but it was staggered.
That staggering matters. Because the tariff schedule was announced well in advance, many importers pulled forward large volumes of stock during Q1 2025, building an inventory cushion that temporarily masked the underlying cost pressure. Retail prices did not spike immediately; instead, as those stockpiles were drawn down, the higher duty-inclusive landed costs gradually filtered through to shop shelves. Any reading of 2025 CPI data that ignored this timing effect would have consistently underestimated how much tariffs were contributing. The inflationary pressure was genuine; it simply took longer to become visible.
When big ASX news breaks, our subscribers know first
How tariffs reshaped the US housing market
Housing is where the tariff transmission chain becomes most visible, because every link can be tracked: border duty to builder invoice to new-home price to shelter inflation. Each link added cost, and each link added time.
The tariff structure on Canadian softwood lumber tells the first part of the story. The US Commerce Department pushed combined anti-dumping and countervailing duties to approximately 35.19% in August 2025. A further 10% Section 232 tariff followed in October 2025. The combined rate landed in the vicinity of 45% on one of the most critical inputs in American residential construction.
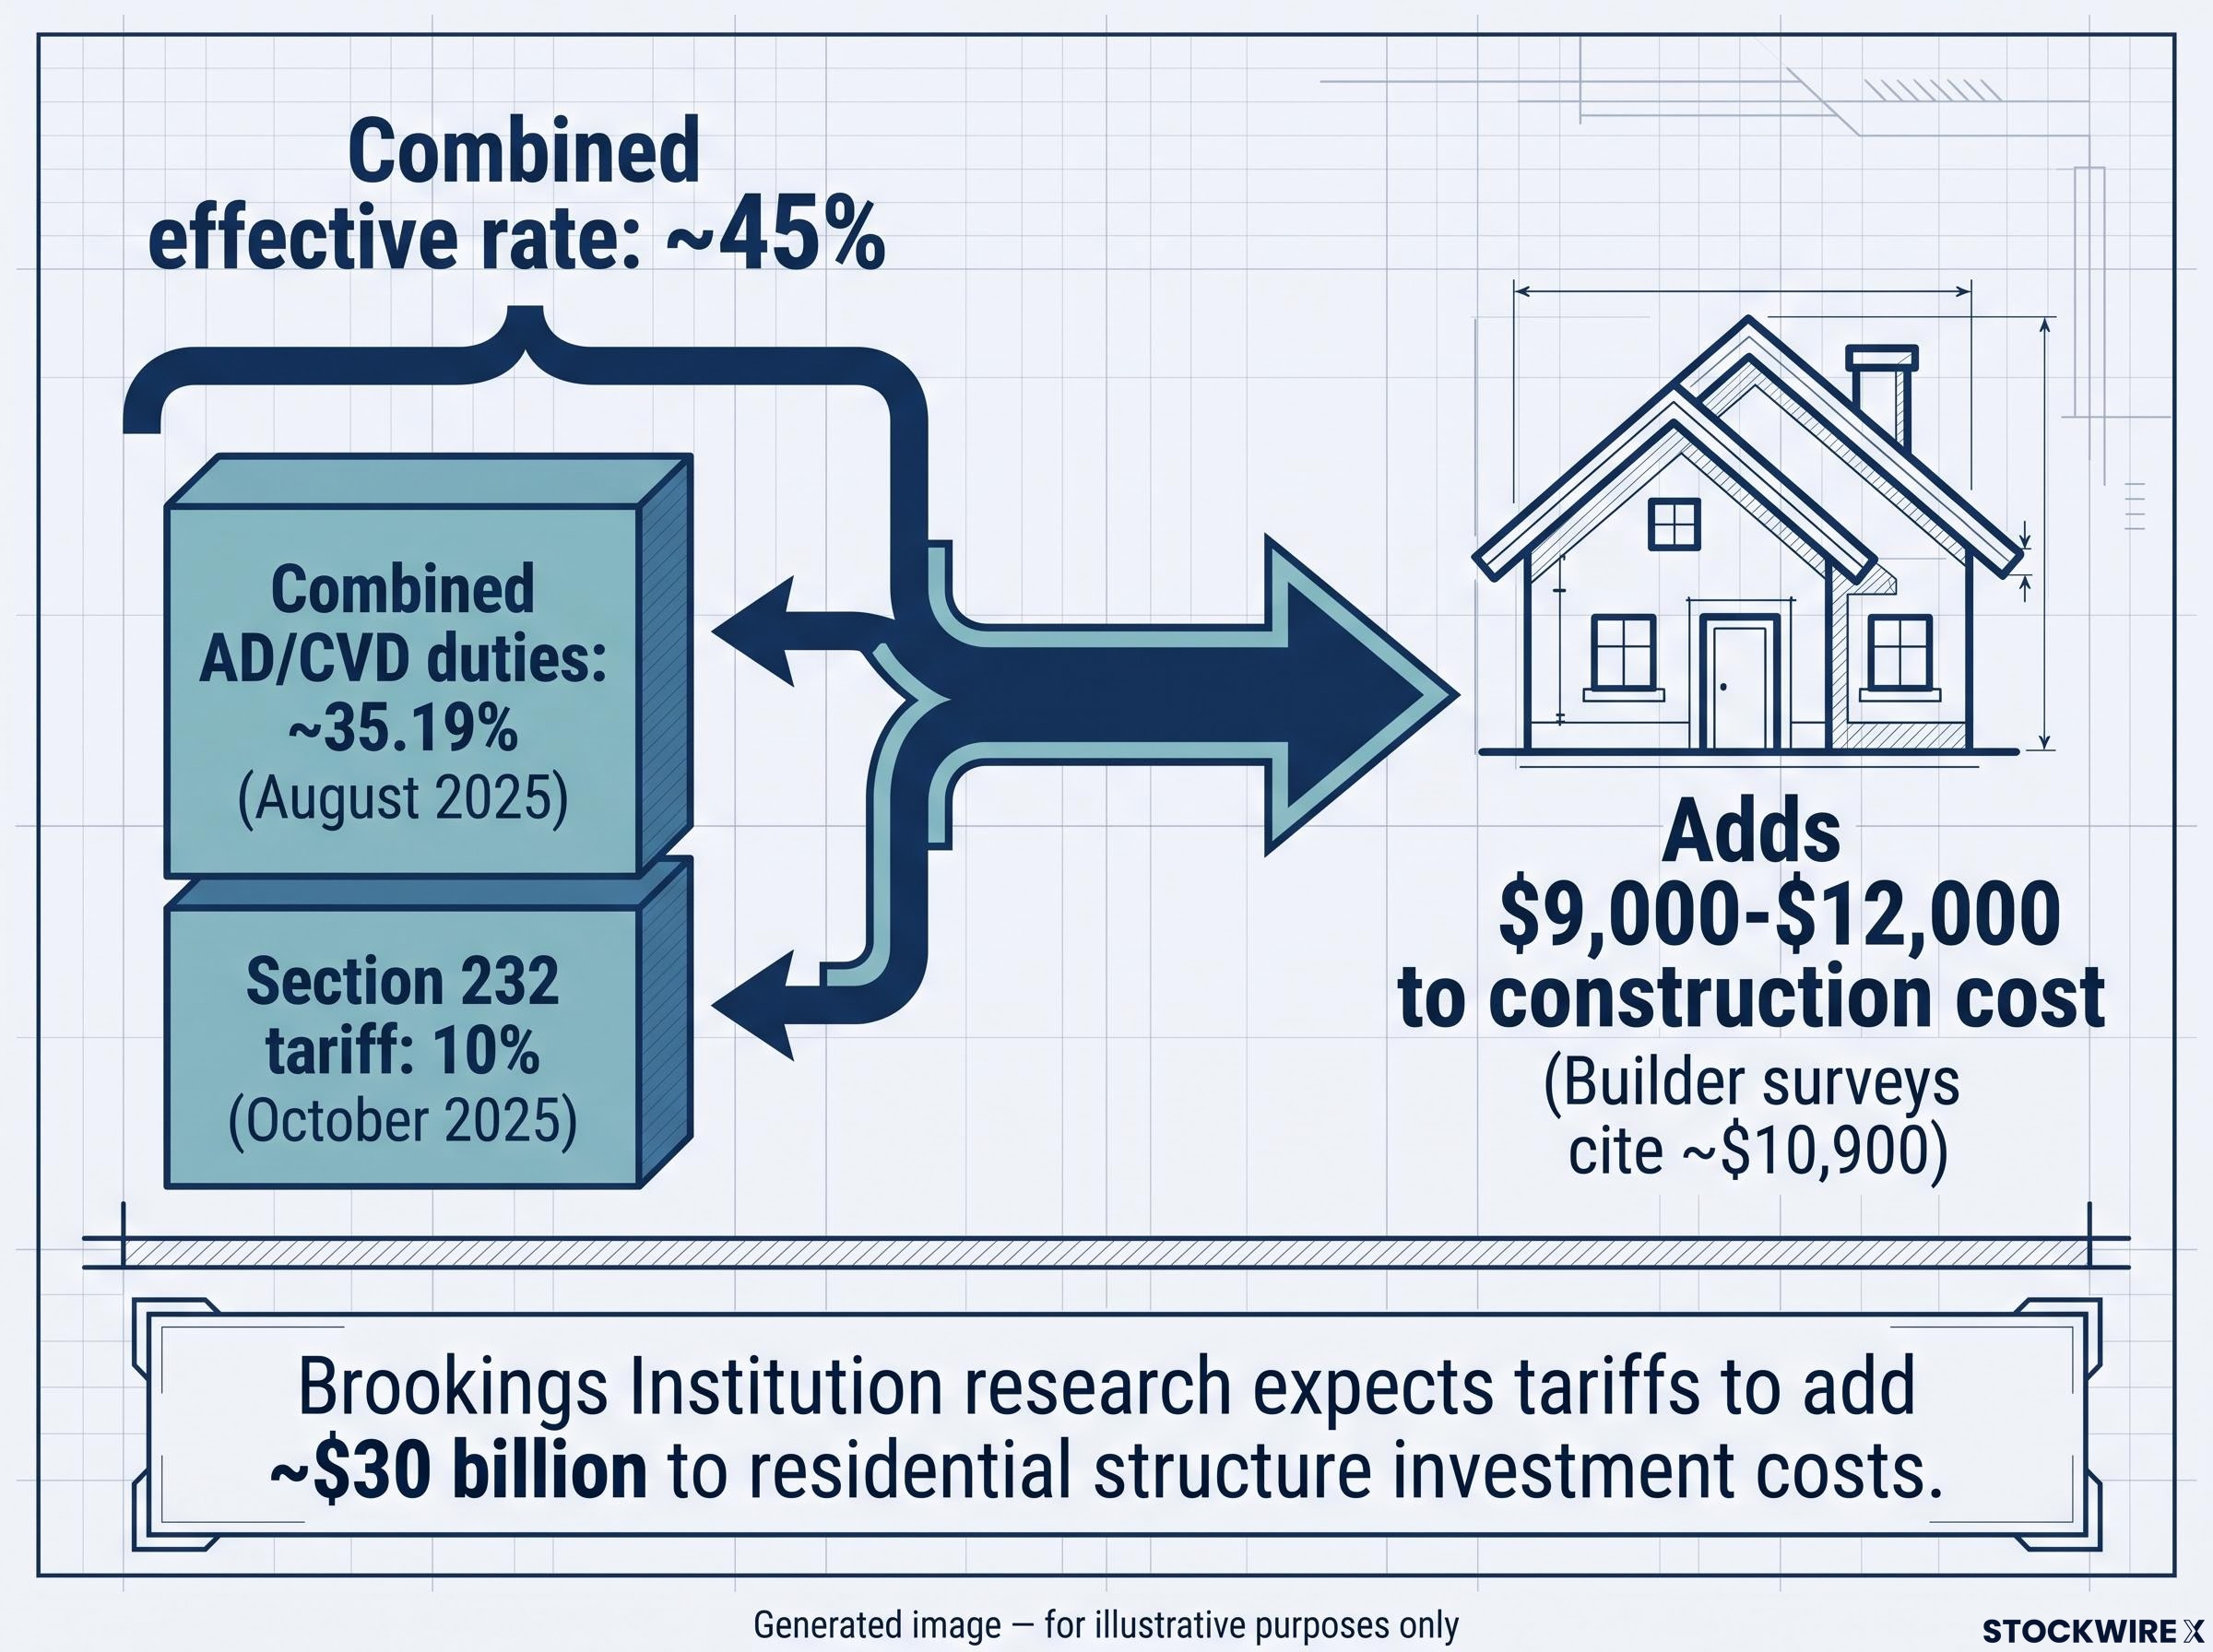
| Tariff type | Rate / effective date |
|---|---|
| Combined AD/CVD duties | ~35.19% (August 2025) |
| Section 232 tariff | 10% (October 2025) |
| Combined effective rate | ~45% |
The National Association of Home Builders (NAHB) and related analyses indicate those higher lumber costs added roughly $9,000-$12,000 to the construction cost of a typical new single-family home, with builder surveys citing figures around $10,900. According to Brookings Institution research, recent tariffs on lumber and other residential inputs are expected to add approximately $30 billion to residential structure investment costs, with roughly 90% falling on new construction.
The cost transmission follows a three-stage lag:
- Builder input costs rise as duty-inflated lumber prices hit invoices
- New-home prices increase as builders pass costs through or reduce output
- Shelter CPI components (rent, owners’ equivalent rent) adjust, with a lag approaching one year
That lag structure explains why official inflation data did not immediately spike after August 2025, even as builders were already absorbing higher costs. Tariff analyses cite an 18% year-to-date decline in housing starts in 2026, a figure that captures the supply-side damage even where price indices have not yet fully adjusted.
The data lag in official readings is a persistent problem for anyone trying to track tariff damage in real time: new home sales had already contracted roughly 17% across June and July 2026 before a single tariff measure appeared in any official release, making current published figures a pre-tariff baseline that will look increasingly outdated from October onward.
Why lumber prices fell while tariffs rose
Here is the nuance that prevents the housing story from being a simple cost-push narrative. In the latter half of 2025, after duties increased, US lumber prices for some species actually fell 10-20%.
The explanation is cyclical, not contradictory. Mortgage rates in the 6-7% range kept new construction and remodelling activity subdued, reducing demand for lumber even as tariffs raised the tax cost of cross-border supply. The tariff did not produce a straightforward price spike. It produced a double affordability squeeze: building costs rose while demand softened, compressing builder margins and reducing housing supply rather than simply inflating new-home prices in a linear way.
Falling spot prices do not mean tariffs had no effect. They mean tariffs interacted with weak cyclical demand to compress margins across the supply chain. The affordability damage was real even where price indices did not spike. For anyone watching housing market data or residential construction equities, the full effect on rent and owners’ equivalent rent in CPI may not yet be fully reflected in official data as of mid-2026.
The Federal Reserve’s supply-shock problem
The Federal Reserve’s standard toolkit is built for demand-driven inflation: when too much money chases too few goods, higher rates cool spending and prices follow. Tariff-driven inflation breaks that framework.
Tariffs behave as adverse supply shocks, a term for an event that simultaneously raises prices and suppresses output. The Fed faces two options, and both have costs:
- Cut rates to cushion the growth drag, but risk embedding above-target inflation from cost-push pressures that rate cuts cannot resolve
- Hold rates to fight the inflation component, but amplify the very growth drag that tariffs themselves create
The Fed’s own July 2026 Monetary Policy Report made the dilemma explicit.
The FOMC dissent pattern that emerged at the April 2026 meeting illustrated how far the committee had already fractured: a historic four-way split, with hawks outnumbering the lone dovish dissenter three to one, exposed the internal fault lines that make a clean rate-path signal from the Fed structurally difficult to produce while supply shocks remain unresolved.
The report listed “earlier tariff hikes that pushed up domestic prices of some imported goods” among the factors contributing to higher measured prices, alongside energy supply constraints and demand for AI-related high-tech products.
That acknowledgment tells you the Fed is not treating tariff-driven inflation as transitory statistical noise. It is part of the Fed’s working model of why inflation remains elevated, which has direct implications for how long rates stay higher than pre-tariff expectations suggested.
Historical evidence, according to a SUERF policy brief, shows that past US tariff shocks systematically reduced output and raised consumer prices. The typical Fed response was to ease moderately, with the federal funds rate falling approximately 0.85 percentage points at trough, cushioning output but accepting some additional inflationary pressure.
The structural constraint is worth stating plainly: monetary policy cannot reduce the statutory cost of Canadian lumber or imported goods. It can only dampen aggregate demand enough to offset some of the price pressure, at the expense of real activity. Market commentary points to a progressively softening US growth trajectory, with tariffs functioning as a persistent structural headwind that eats into some of the tailwind provided by the sizeable fiscal deficits still running through the federal accounts.
For anyone tracking rate-cut timing, this is the input that matters most. The Fed faces a constrained easing path where each successive data release carries higher stakes than a normal inflation-reduction cycle would produce. Cutting too fast risks embedding tariff-driven inflation. Cutting too slowly amplifies the growth drag. That is not a policy environment where the rate path follows a clean, predictable arc.
Where supply-chain exposure runs deepest
The macro picture matters, but the tariff burden does not distribute evenly across the economy. Some sectors absorb compounding costs that aggregate index-level analysis simply misses.
The North American automotive sector is the clearest example. Vehicle manufacturing on this continent operates as a single, deeply integrated production system, and the US-Canada border runs straight through the middle of it. Components move back and forth across that border repeatedly within a single build cycle, and each crossing attracts the applicable duty, causing costs to stack rather than accumulate in a straight line. Trade data show Canada supplies around 13% of US vehicle and auto parts imports.
A scheduled 50% tariff on Canadian vehicles and components, set to take effect on 1 January 2027 after the 2026 midterm elections, has introduced a further layer of uncertainty into the sector. Fitch Ratings analyst Olu Sonola has noted that the current reach of 50% levies remains relatively contained as of mid-2026, yet the mere announcement has been enough to unsettle suppliers and cause companies with long planning horizons to hold back investment commitments.
| Sector | Primary Canadian import dependency | Estimated cost impact | Key risk factor |
|---|---|---|---|
| Residential construction | Softwood lumber, cabinets | ~$10,900 per new home | Shelter CPI lag still unwinding |
| Automotive manufacturing | Vehicles, auto parts (~13% of US imports) | Compounding at each border crossing | Proposed 50% tariff for Jan 2027 |
| Consumer goods / retail | Broad intermediate inputs | Persistent, cumulative price drift | Limited substitution options |
What the market pricing implies
The disconnect between tariff fundamentals and market positioning deserves its own read.
By mid-2026, the implied forward tariff burden had returned to levels broadly in line with those prevailing in April 2025, a period that had generated pronounced market stress, yet equities were sitting near record highs and credit spreads had compressed to historically tight levels.
That combination implies markets are assigning significant weight to eventual policy resolution and disinflation, not sustained tariff pressure. That bet is not unreasonable, but it is not guaranteed. The scenario the market appears to be discounting, prolonged tariff continuation beyond consensus expectation, is exactly the one where the slow-burn structural drag compounds over time and materialises in earnings rather than being resolved at the policy level.
The market pricing of tariff risk has been shaped by more than a year of announce-delay-revise cycles, a pattern that has caused investors to structurally discount announced rates until implementation evidence arrives and explains why equities sat near record highs even as the implied forward tariff burden returned to April 2025 stress levels.
This is not a prediction. It is a risk that investors with direct exposure to automotive or construction supply chains should be stress-testing explicitly rather than absorbing through index exposure. The sector divergence is the actionable point: construction, housing, and deeply integrated cross-border manufacturing face compounding cost structures that asset-light and domestic-revenue businesses do not.
What one year of data actually changes
One year of evidence confirms what economic theory predicted and political debate obscured. Tariff costs were borne primarily by American households and businesses. The housing channel was real, lagged, and is still working through official inflation data. The Federal Reserve’s room to manoeuvre remains constrained by a supply-shock dynamic that its standard toolkit was not designed to resolve cleanly.
What remains unresolved is equally important. Applied tariff rates on key inputs including lumber have not broadly declined through mid-2026. The structural cost pressure is not yet unwinding. The 2027 automotive tariff proposal remains a source of policy uncertainty that long-lead-time industries cannot easily plan around.
Three variables will determine whether the slow-burn drag intensifies or fades over the next twelve months:
- Applied tariff rates on lumber and goods: whether duties actually decline, not just headline deal announcements
- Shelter CPI trajectory: the approximately one-year lag from the August-October 2025 duty increases means the full effect may still be working through official data into late 2026 and beyond
- Federal Reserve forward guidance: whether the Fed signals earlier cuts or a longer rate plateau in response to the inflation-growth trade-off tariffs have created
The persistence of duties without broad relief tells you that the structural inflation contribution from US-Canada tariffs is not self-correcting on the current policy trajectory. Waiting for market consensus to reprice this risk may mean waiting until the data is already embedded in official CPI readings.
This article is for informational purposes only and should not be considered financial advice. Investors should conduct their own research and consult with financial professionals before making investment decisions. Past performance does not guarantee future results. Financial projections are subject to market conditions and various risk factors.