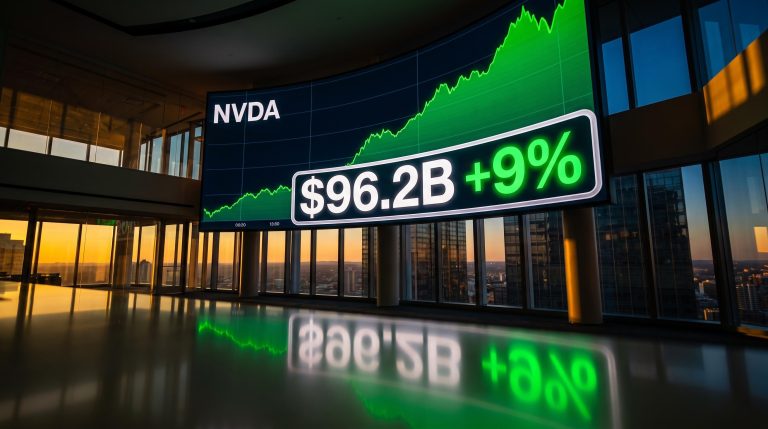
Nvidia just reported $96.2 billion in quarterly revenue, a 106% year-on-year increase, and its stock surged 8.7% in a single session. On that same day, the average stock in the S&P 500 went down.
That is not a contradiction. It is a snapshot of what this market actually looks like underneath the headline numbers. Of the eleven S&P 500 sectors, only Information Technology finished in positive territory. The equal-weighted S&P 500 dropped 0.3% while the cap-weighted version added 0.72%, a spread of around 102 basis points between the two measures. One company’s earnings carried the index; the rest of the market slipped.
Here is what those numbers tell you about the rally you are exposed to, what Nvidia’s guidance means for the AI spending cycle, and why the gap between what the index says and what the average stock did is the single most important data point for anyone holding broad market positions right now.
Nvidia just posted $96 billion in revenue, and the numbers still surprised
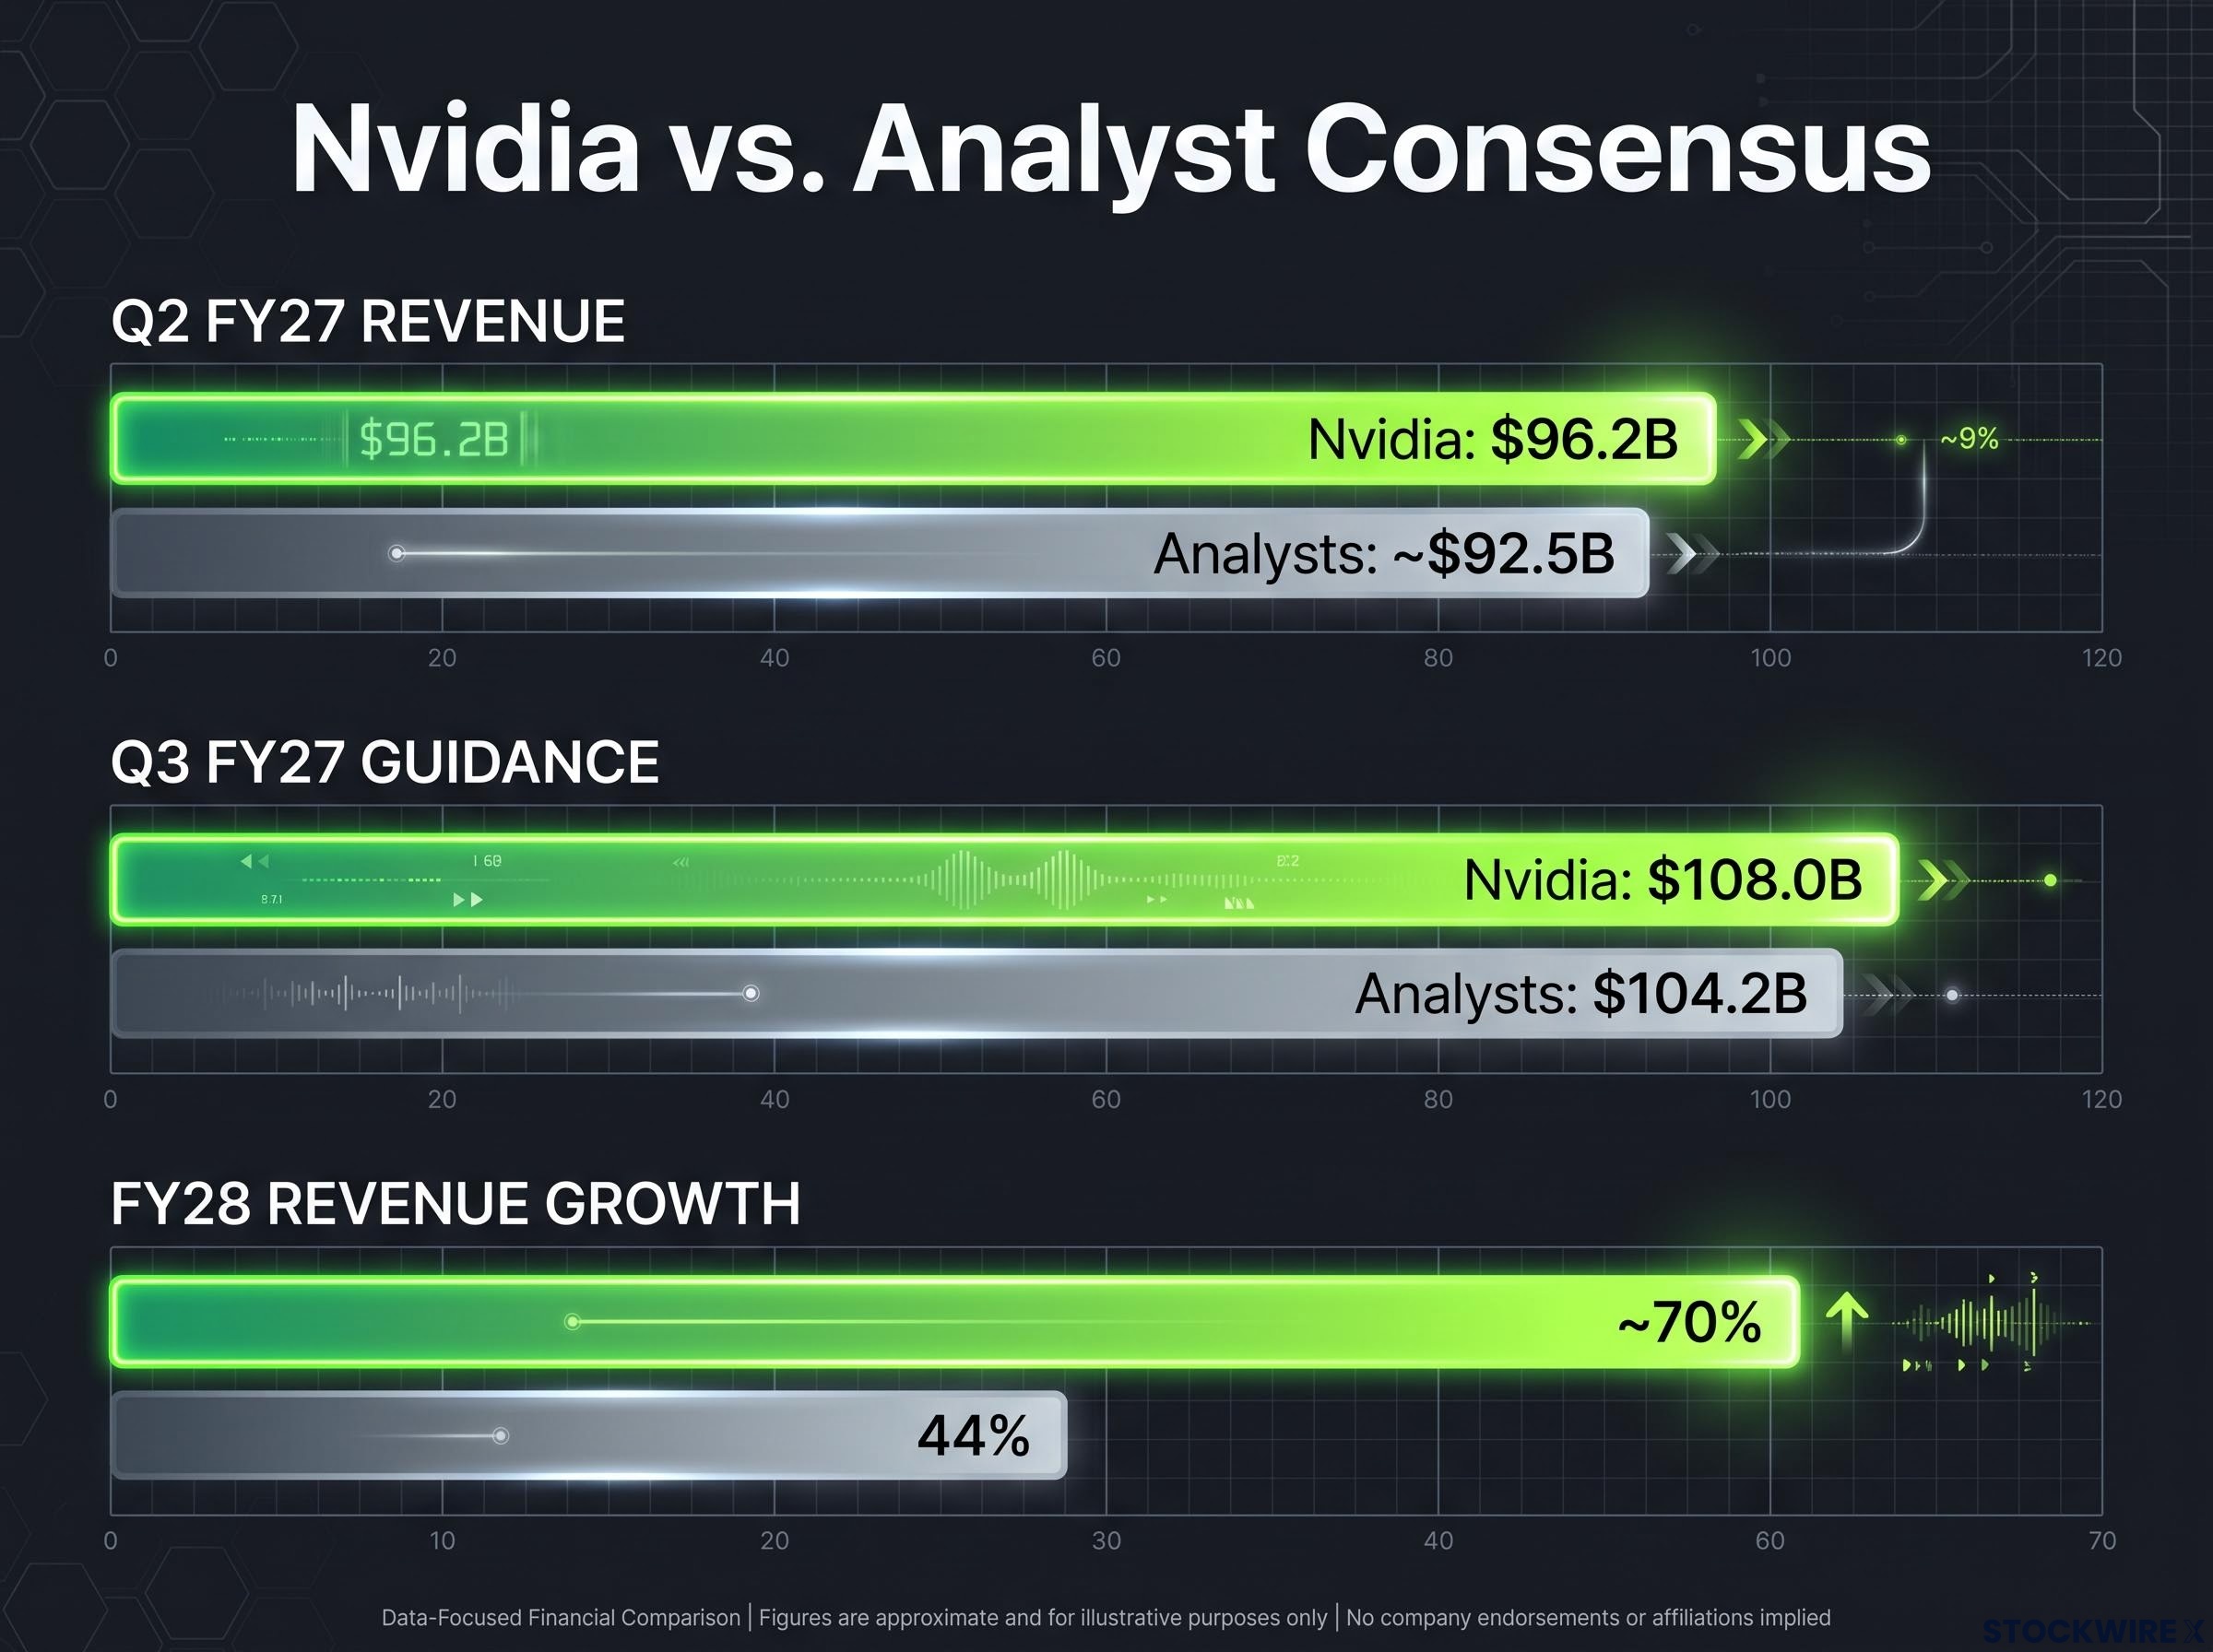
Start with the headline. Nvidia’s Q2 FY27 revenue landed at $96.2 billion, coming in approximately 4% ahead of what analysts had forecast, representing 106% growth compared with the same period a year earlier. A company already priced for dominance still managed to beat expectations by a meaningful margin.
The engine behind it is straightforward. Data centre revenue hit $89.0 billion, up 117% year on year, accounting for the overwhelming majority of total sales. AI-related compute is not a growth segment within Nvidia anymore; it is Nvidia.
Then comes the guidance, and this is where the numbers shift from impressive to structurally significant. The company’s Q3 FY27 revenue outlook was set at $108.0 billion (plus or minus 2%), well above the $104.2 billion analysts had pencilled in. Looking further out, management put FY28 revenue growth at roughly 70%, compared with the 44% the analyst community had projected.
| Metric | Nvidia figure | Analyst consensus | Beat / gap |
|---|---|---|---|
| Q2 FY27 revenue | $96.2B | ~$92.5B | ~4% above |
| Q3 FY27 guidance | $108.0B | $104.2B | ~3.6% above |
| FY28 revenue growth | ~70% | 44% | 26 percentage points |
The FY28 guidance gap: 70% projected growth versus analysts’ 44%. Professional forecasters who follow this company closely are still underestimating the scale of AI infrastructure spending.
That gap is not a rounding error. It tells you that the company supplying the dominant hardware for AI training sees demand accelerating well beyond what the market’s best-informed observers had modelled. For anyone tracking AI-driven equity themes, that is a primary data point, not a secondary one.
The hyperscaler capex underpinning Nvidia’s guidance sits inside an AI investment boom that pushed US IT spending to a record 4.9% of GDP in Q1 2026, surpassing both the dot-com era peak of approximately 4.2% and the cloud buildout peak of approximately 3.8%, a scale context that helps anchor the FY28 growth projection against historical infrastructure cycles.
When big ASX news breaks, our subscribers know first
The AWS deal confirms where the AI infrastructure buildout is heading
The quarterly numbers are one thing. The Amazon Web Services commitment announced alongside them is another.
The deal sees AWS taking on 2 million Nvidia GPUs for deployment across its global infrastructure through 2027-2028, with Nvidia’s Vera CPU processor included as part of the arrangement. The deal’s components break down clearly:
- GPU volume: 2 million additional Nvidia GPUs
- Deployment window: 2027-2028
- CPU integration: Vera CPU processor deployed alongside the GPU order
This is not a sentiment signal. A hyperscaler committing to 2 million GPUs over a two-year forward window is an order book signal. It tells you that the largest cloud infrastructure buyers are still accelerating their AI capex, not pausing, not diversifying away from Nvidia hardware. The deal gives Nvidia’s FY28 guidance more credibility than guidance alone would carry, because it anchors the revenue projection in contracted demand rather than management optimism.
Nvidia’s demand durability draws from a broader buyer base than the hyperscaler commitments alone suggest: non-hyperscaler customers including AI labs, sovereign governments, and enterprise on-premise deployments led revenue growth in the most recent quarter, a structural shift that gives the FY28 guidance a more distributed demand foundation.
What the chip sector’s response tells you about sentiment
The market read Nvidia’s result as a sector-level demand confirmation, not just company-specific good news. The Philadelphia Semiconductor Index gained 2.3% on the session. Broadcom advanced 4.5%.
Both moved alongside Nvidia, and that breadth within semiconductors is consistent with the interpretation that AI capex is still expanding broadly. Nvidia is the primary beneficiary, but the spending cycle is large enough to lift adjacent chipmakers with exposure to data centre and AI workloads.
One sector up, ten down: what the breadth data actually shows
The S&P 500 closed at 7,731, up 0.72%. The Nasdaq Composite rose 1.57% to 26,541. The Dow Jones Industrial Average added 0.20% to reach 53,569. The Russell 2000 gained a modest 0.28% to settle at 3,014.
Read those numbers in isolation and the session looks constructive. Now look at the composition.
Among all eleven S&P 500 sectors, Information Technology was the only one to record gains, climbing 3.40%. Every other sector declined. Consumer Staples fell 1.50%, the weakest of the session. The equal-weighted S&P 500, which gives each constituent the same influence regardless of market capitalisation, dropped 0.3%.
The breadth signal in one line: the cap-weighted S&P 500 rose 0.72% while the equal-weighted version slipped 0.3%, putting the gap between the two at around 102 basis points. The average stock went down.
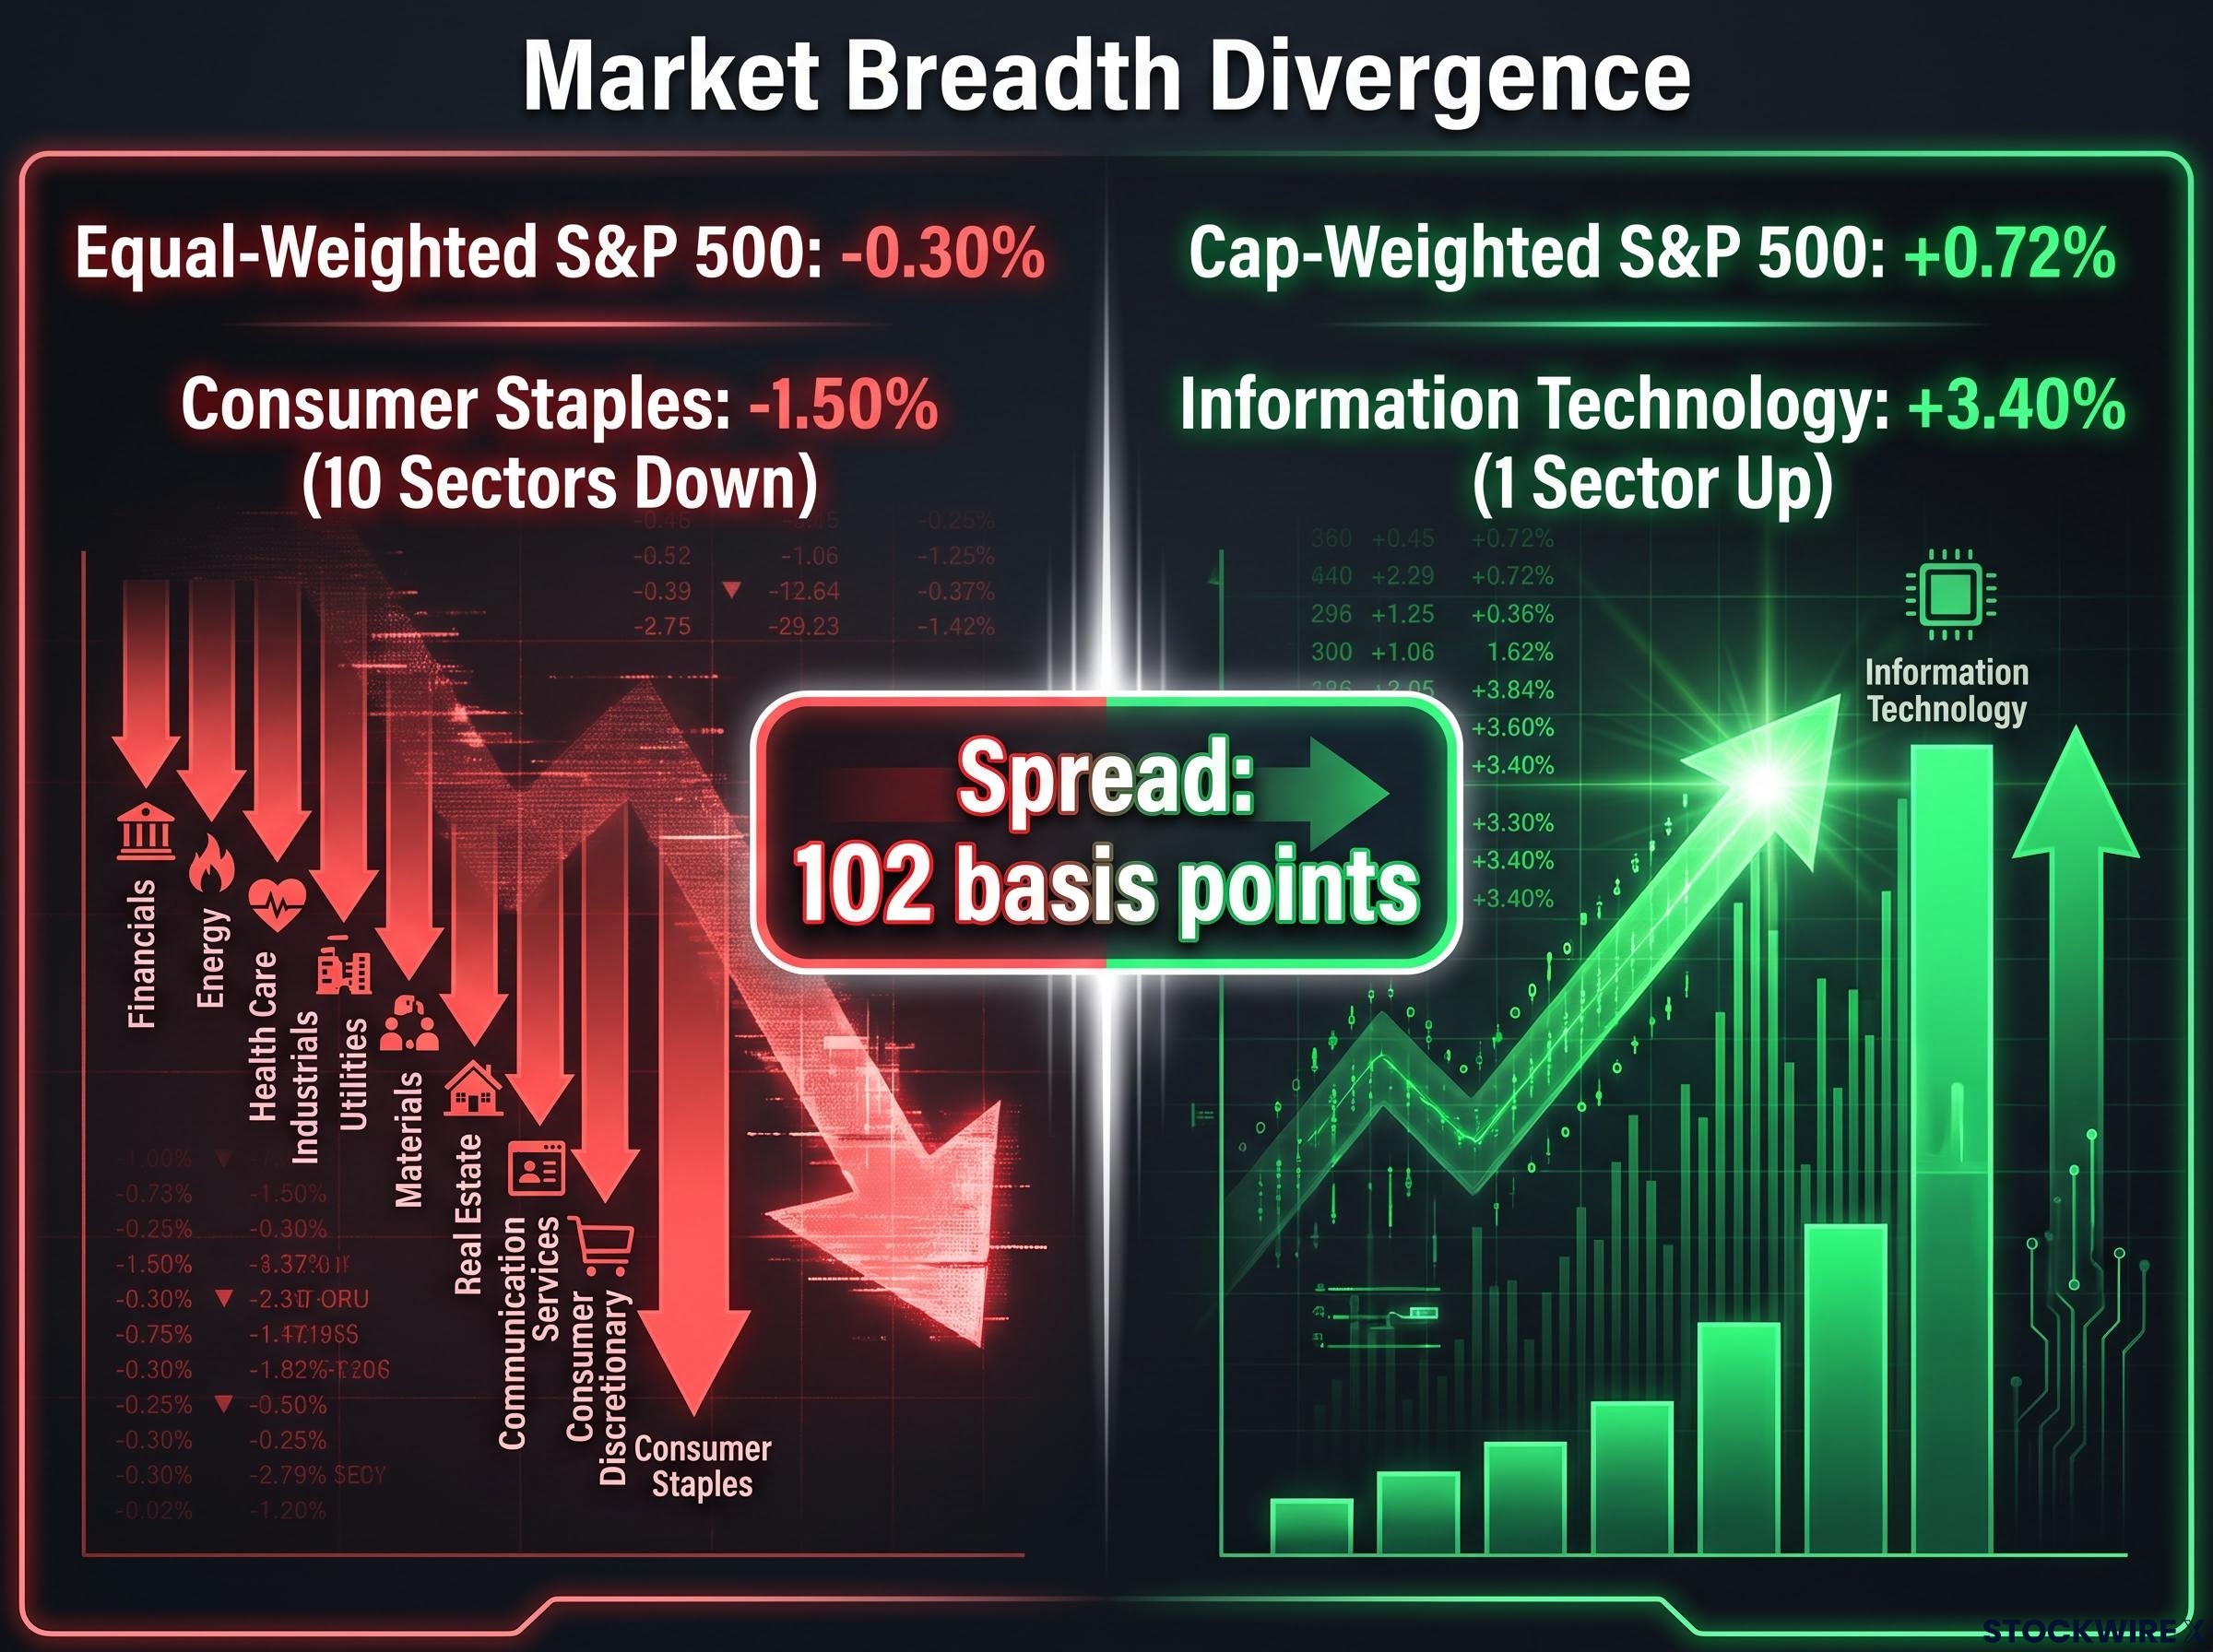
When the average stock falls on the same day the index rises, you are seeing concentration risk in live operation. The health of your broad index position depends far more on a small cluster of mega-cap tech names than the headline number suggests.
The breadth data from this session illustrates index fund concentration risk in its most visible form: five mega-cap names controlled roughly 23% of the broad market index as of mid-April 2026, and the cap-weighted construction that amplified today’s gain will amplify any future drawdown in those same names with equal force.
| Index / sector | Close | Session change |
|---|---|---|
| S&P 500 | 7,731 | +0.72% |
| Nasdaq Composite | 26,541 | +1.57% |
| Dow Jones Industrial Average | 53,569 | +0.20% |
| Russell 2000 | 3,014 | +0.28% |
| Information Technology (sector) | +3.40% | |
| Consumer Staples (sector) | -1.50% | |
| Equal-weighted S&P 500 | -0.30% |
European markets told a consistent story. European tech gained 1.8% in early trading, while the broader Stoxx 600 was essentially flat.
Rates, oil, and the sectors that Nvidia’s quarter does not help
The macro backdrop explains why participation outside tech was absent. The U.S. 10-year Treasury yield rose 2 basis points to 4.68%. The 30-year yield climbed to 5.19%. Brent crude advanced approximately 2% to $88.46 per barrel.
Rising long-term yields and higher energy costs create a different pressure environment for cyclicals, defensives, and small caps, none of which benefit from Nvidia’s demand signal. Charlie Ripley, a strategist at Allianz, noted that the rally remained narrow, with rate pressures, geopolitical friction, and global trade headwinds still bearing down on sectors beyond technology.
What a falling VIX and a narrow rally mean for portfolio risk
The VIX declined 4.5% to settle at 14.51. Lower volatility on a day the market rallied looks reassuring at first glance. It is not.
Nvidia’s earnings were one of the most significant near-term risk events on the calendar. Its resolution removed uncertainty from the options pricing that feeds the VIX. That is different from the market becoming fundamentally healthier. A falling VIX on a narrowly led session is not permission to interpret conditions as improved; it reflects one specific uncertainty being resolved while the sources of potential volatility in non-tech sectors and macro conditions remain unchanged.
Charlie Ripley of Allianz cautioned that the rally’s concentration poses its own risk. Rate pressures and trade headwinds have not eased for sectors sitting outside technology, which means the weakness in breadth reflects something structural rather than a passing anomaly.
The portfolio-level implications are worth isolating:
- Broad index exposure is concentrated tech exposure. Cap-weighted S&P 500 funds performed well today because a small number of mega-cap tech names surged. The same weighting will amplify any future drawdown in those names.
- AI trade strength and market breadth are distinct signals. Nvidia’s numbers reinforce the AI theme. They say nothing about the other ten sectors that declined.
- The equal-weighted divergence is a concentration risk diagnostic. When it diverges from the cap-weighted index by 102 basis points in a single session, the headline index is not reflecting the experience of most stocks.
- The VIX decline reflects event resolution, not macro improvement. The rate and energy headwinds visible in today’s session data have not diminished.
What Nvidia’s quarter changes, and what it leaves unresolved
Some things are now clearly established. Nvidia’s AI hardware demand is not plateauing. The hyperscale capex cycle has multi-year contracted support, anchored by the AWS commitment to 2 million GPUs through 2028. The near-term earnings trajectory for Nvidia and select semiconductors is strong, backed by an FY28 revenue growth projection of approximately 70% that far exceeds what the market had priced.
The concentration question every index investor should ask
What remains unresolved is everything outside that trade. Macro headwinds for non-tech sectors, from rates at 4.68% on the 10-year to Brent crude at $88.46, did not ease. The concentration risk embedded in cap-weighted index exposure did not diminish; it was reinforced. The rally depends on a small leadership cohort remaining strong, and this session demonstrated both what happens when they deliver and what the rest of the market does in the same hours.
If your broad market exposure performed differently than you expected today, the equal-weighted versus cap-weighted divergence is the reason. That is worth sitting with. Distinguishing between having conviction in the AI trade and assuming that conviction translates to broad market health is the analytical move this session’s data demands.
The strength of the AI buildout is real. The narrowness of what it is carrying is also real. Both readings are correct simultaneously, and the investor who recognises that is better positioned than the one who picks only one.
For investors weighing whether today’s concentration is a structural feature or a transitional peak, our dedicated guide to market leadership rotation examines the valuation spread between US Tech and international developed markets, which has reached multi-decade extremes that have historically preceded extended periods of relative underperformance by the dominant cohort.
This article is for informational purposes only and should not be considered financial advice. Investors should conduct their own research and consult with financial professionals before making investment decisions. Past performance does not guarantee future results. Financial projections are subject to market conditions and various risk factors.