
AstraZeneca’s £300M UK Investment Reverses 2025 Retreat
15 mins ago

Wall Street witnessed a massive 1.3% surge in corporate stock valuation this week as a prominent e-commerce marketplace finally broke a two-year streak of stagnant user engagement. Following the release of its first-quarter 2026 financial results on 29 April, the platform demonstrated a major operational turnaround that overshadowed a minor earnings miss. This detailed analysis of the latest Etsy earnings data breaks down the top-line revenue beat, the revival in active purchaser dynamics, and the strategic implications of shedding a major subsidiary ahead of an anticipated billion-dollar cash injection.
Investors have closely monitored the company’s performance metrics for signs of recovery after consecutive quarters of macroeconomic pressure. The wider United States retail sector has faced fluctuating consumer demand, making this specific operational turnaround highly material for market observers. The latest figures provide the first concrete evidence that internal restructuring efforts are successfully translating into renewed buyer activity.
Analysts have cautioned that aggregate retail data can obscure rising US recession risk, particularly as lower-income households rapidly deplete their savings to maintain baseline consumption levels.
As markets process these disclosures, attention has shifted from immediate per-share profitability to the broader structural health of the core platform.
According to early reports, the company reported total top-line revenue of $631.3 million, pushing past Wall Street predictions of $621.1 million by 1.6%. This revenue beat immediately captured market attention and established a bullish momentum for the trading session. Investors aggressively bid up the shares, driving stock valuations 6.3% higher following the pre-market financial disclosures.
The official SEC Form 8-K filing details the specific operational metrics driving this revenue beat, confirming the platform’s robust financial position at the close of the quarter.
The market’s reaction revealed a clear preference for revenue growth over minor profitability shortfalls. According to early reports, adjusted per-share profit reported at $0.60, falling slightly short of the $0.61 consensus market forecast. However, analysts treated this adjusted earnings shortfall as a minor blip against the company’s strong overall profitability margins.
According to early reports, adjusted EBITDA totalled $185 million for the quarter, providing a substantial cash cushion for future operations. This figure represents a strong 29.3% profitability margin, proving that the core business generates more cash than analysts initially expected. Investors needed to understand this immediate financial reality to validate the prevailing market optimism, as the top-line performance clearly outweighed the single-cent earnings miss.
| Metric | Wall Street Estimate | Reported Q1 2026 Figure |
|---|---|---|
| Top-Line Revenue | $621.1 million | $631.3 million |
| Adjusted EPS | $0.61 | $0.60 |
| Adjusted EBITDA | Not Specified | $185.0 million |
The primary leading indicator in the earnings report was the return to active purchaser growth. Quarter-over-quarter active purchaser counts expanded for the first time in 24 months, providing the structural breakthrough that management desperately needed. Financial beats can sometimes result from temporary cost reductions, but sustained user growth represents actual, organic business health.
For two years, the platform struggled to attract and retain new buyers in a highly competitive retail environment. Reversing this trend required significant adjustments to user experience and marketing strategies. The volume metrics now demonstrate a broad-based expansion across multiple user categories rather than an isolated spike.
This return to growth was heavily supported by increasing mobile app shopper engagement, which played a crucial role in reactivating dormant accounts and driving the annual transaction expansion.
According to early reports, total transaction volume hit $2.5 billion, representing a 5.5% annual increase. This volume growth entirely reverses the 0.5% drop seen during the final quarter of 2025, signalling a definitive shift in consumer behaviour on the platform. The company recorded simultaneous annual increases across several key demographic and engagement categories:
Active merchant numbers expanded, indicating strong seller retention and platform loyalty. Fresh consumer acquisitions increased as targeted marketing initiatives successfully captured new demographics. * Average spending per user rose significantly, driving overall transaction values higher.
The primary marketplace performed exceptionally well independently of broader macroeconomic headwinds. Core platform income expanded by 7.6% compared to the identical period last year. This core platform revenue growth directly connects to the increased average spending per user, proving the company is effectively capitalising on its engaged buyer base.
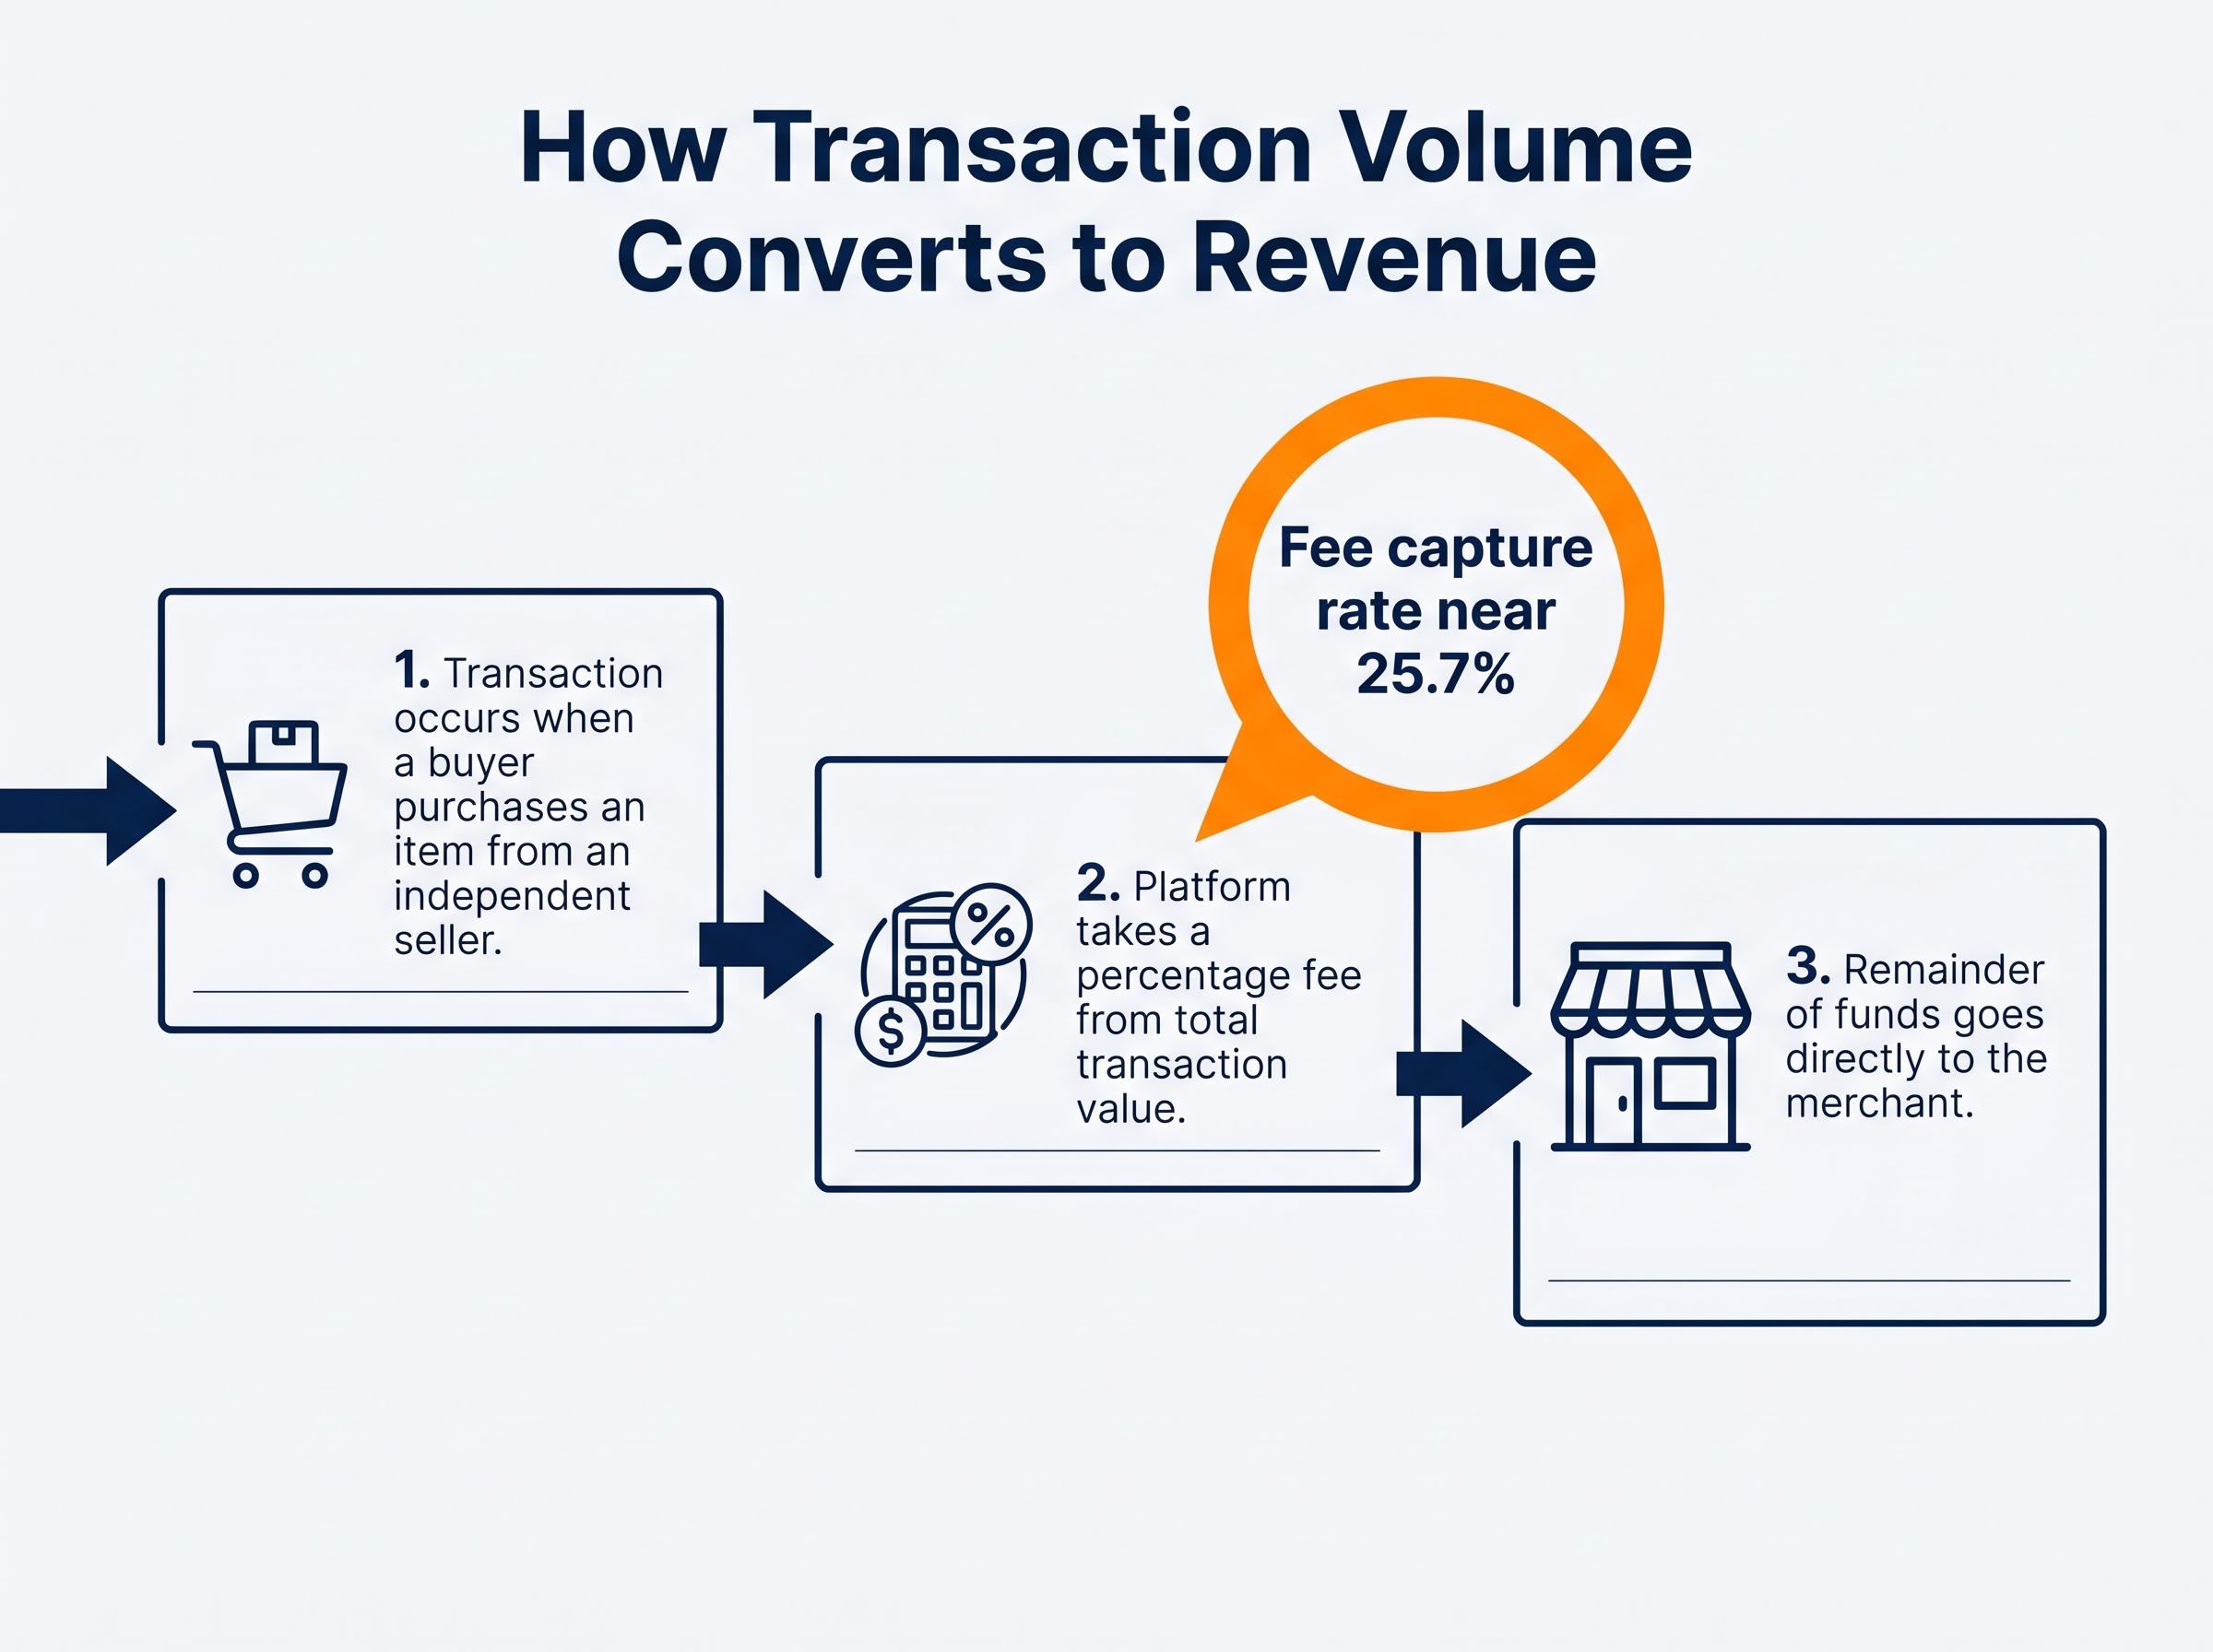
Retail investors often confuse a platform’s total sales with its actual corporate revenue during earnings season. Transaction volume actually measures the total dollar value of all goods sold between buyers and sellers on the marketplace. It represents the overall economic activity occurring on the platform, not the net income the company retains.
The difference between this total transaction volume and actual corporate revenue is determined by the fee capture rate. The company anticipates a fee capture rate near 25.7%, providing a clear benchmark for understanding its marketplace economics. This percentage indicates the exact portion of gross sales that converts into corporate revenue through listing fees, transaction charges, and advertising services.
Platform vitality directly influences long-term stock valuations because higher transaction volumes create a larger pool of capital from which the company extracts its percentage. Understanding this dynamic ensures investors can accurately price e-commerce equities based on user activity rather than just statutory profit figures. The mechanics of e-commerce revenue generation follow three distinct steps:
Past performance only provides a partial framework for pricing a stock. Management directed investor focus toward the future by providing upbeat forward guidance for the second quarter and the full year. According to early reports, second-quarter transaction volumes are projected to land between $2.48 billion and $2.53 billion, indicating a 3% to 5% annual expansion.
A central factor in this optimistic outlook is the strategic decision to sell the Depop platform to eBay for $1.2 billion in cash. Announced in February 2026, this divestiture allows the company to exclude Depop from current operational metrics and refocus entirely on its primary marketplace. The acquisition is expected to finalise before the close of the third quarter of 2026.
This impending cash injection provides the exact catalyst needed to drive share prices over the next six months. Following the announcement, analysts at UBS raised their price target to $72, specifically attributing the upgrade to the anticipated cash inflow. This capital influx creates substantial flexibility for potential shareholder returns, debt reduction, or targeted reinvestment into core platform technology.
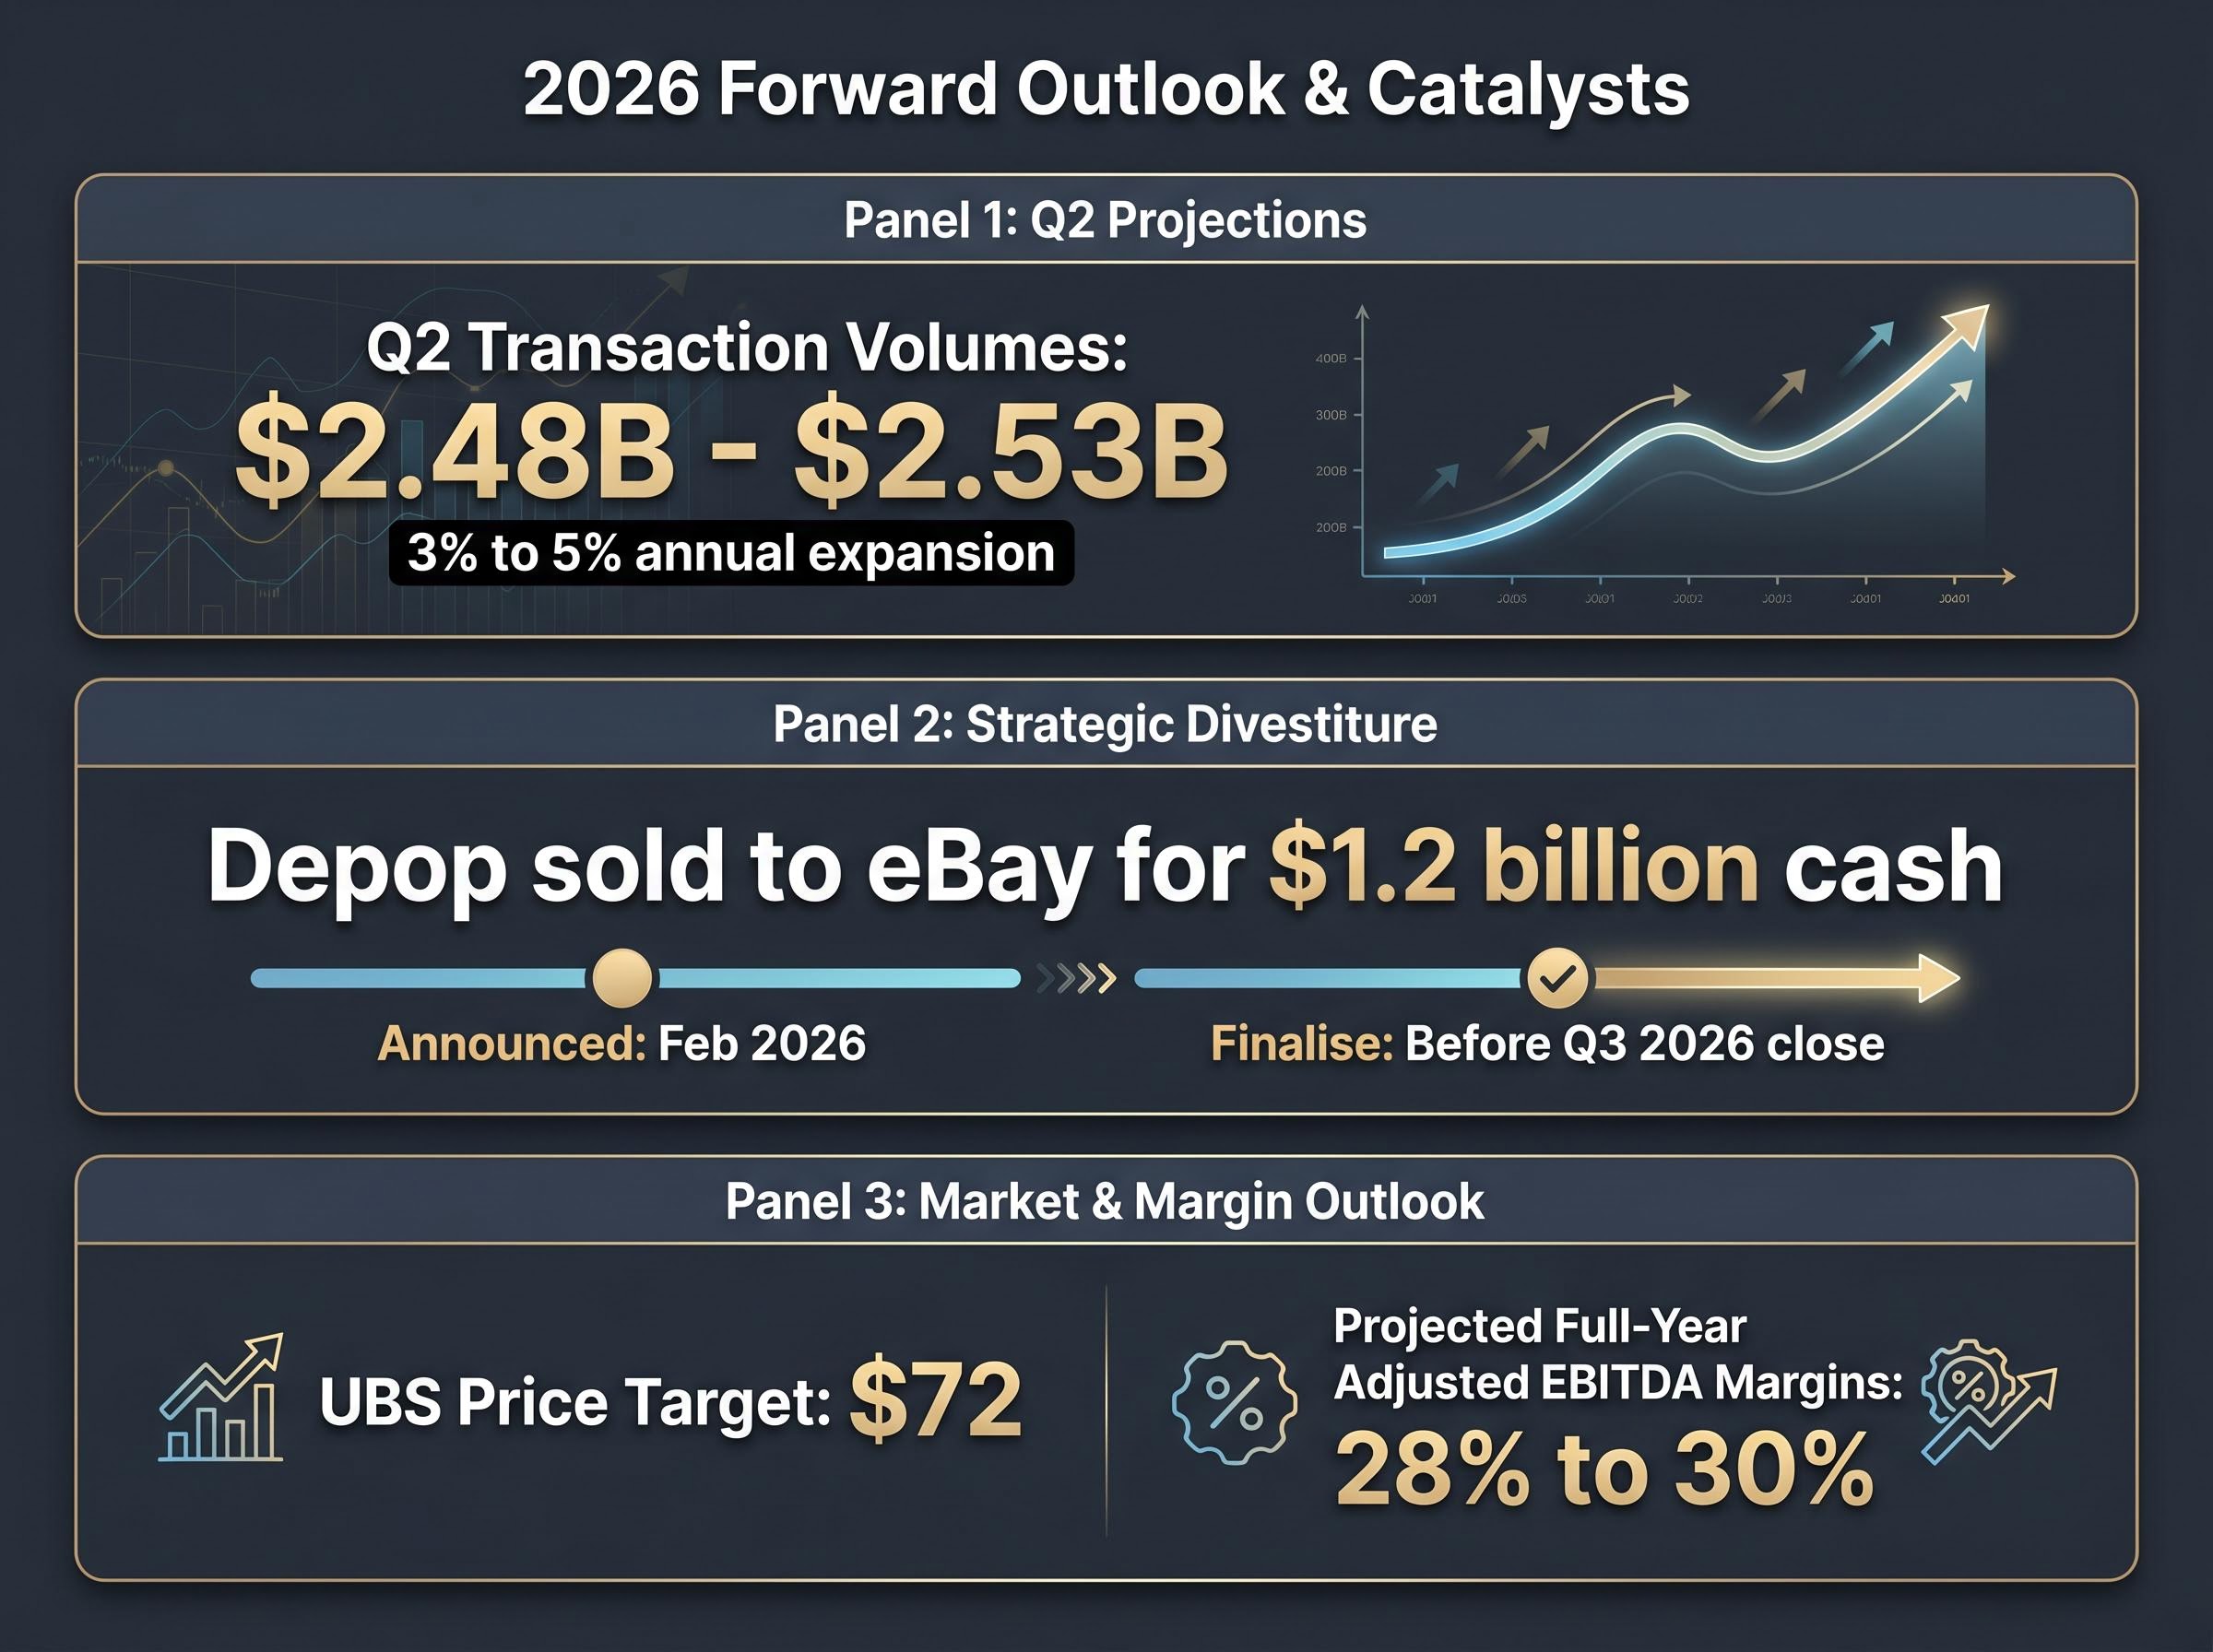
Management Guidance on Profitability The company anticipates continued operational efficiency throughout the fiscal year, projecting full-year adjusted EBITDA margins between 28% and 30% as the platform consolidates its core marketplace operations.
For investors wanting to understand how this transaction shifts the competitive landscape, our comprehensive walkthrough of the Etsy Depop divestiture details the implications for both companies and how eBay plans to leverage the platform to capture the next generation of apparel consumers.
The first-quarter turnaround demonstrates a clear operational revival for the e-commerce leader. The combination of revived user growth and an upcoming $1.2 billion cash infusion creates a newly focused corporate entity with significant capital flexibility. By shedding peripheral subsidiaries, the business has successfully concentrated its resources entirely on the primary marketplace.
As seen with other major corporate turnaround strategies in the consumer sector, prioritizing core customer loyalty and operational efficiency often proves more effective than rapid expansion.
The primary question moving forward is whether the platform can maintain this momentum into the holiday shopping quarters. If the active purchaser metrics continue to expand, the company is well-positioned to capitalise on its restructured balance sheet. The market has clearly signalled that it will reward sustained user engagement over minor short-term earnings fluctuations.
This article is for informational purposes only and should not be considered financial advice. Investors should conduct their own research and consult with financial professionals before making investment decisions. Past performance does not guarantee future results, and financial projections are subject to market conditions and various risk factors.
Etsy reported total top-line revenue of $631.3 million, surpassing Wall Street predictions, and achieved a return to active purchaser growth for the first time in 24 months.
Etsy shares saw a 6.3% increase following the pre-market financial disclosures, as investors prioritized the revenue beat and active user growth over a minor per-share profit shortfall.
Etsy's strategic decision to sell Depop for $1.2 billion allows the company to refocus entirely on its primary marketplace and provides a substantial cash injection for future capital allocation.
Etsy generates revenue by taking a percentage fee from the total transaction value between buyers and sellers, with an anticipated fee capture rate near 25.7%.
Etsy projects second-quarter transaction volumes to expand 3% to 5% annually and anticipates full-year adjusted EBITDA margins between 28% and 30%, indicating continued operational efficiency.