
The dollar index dropped to 98.6-98.8 this week, a roughly three-month low. At the same time, gold pressed $4,600, sterling hit a six-month high, and Bitcoin cleared $77,000. That kind of simultaneous move across four distinct asset classes does not happen on a quiet week.
This is not a single-market story. The dollar’s decline has propagated across forex pairs, precious metals, and digital assets in a pattern that reflects a broader shift in how markets are pricing US growth and Federal Reserve policy. When you see that many assets moving in the same direction at the same time, the transmission mechanism matters as much as the headline.
Here is a clear map of what is moving, why these assets are moving together, and what the specific decision points are for each one from here.
Why the dollar is falling right now
The selloff has three layers, and each one reinforces the others.
The immediate trigger was the US Treasury’s decision to double the size of liquidity-support buybacks for longer-dated nominal coupon securities.
The Treasury buyback mechanics that triggered this week’s move are frequently misread as quantitative easing, but the programme operates through a signal and short-squeeze dynamic rather than reserve creation, which is why a $4 billion operation moved markets far more than its raw dollar volume would predict.
Buyback operations for longer-dated securities were raised to a minimum of $4 billion per operation, a significant step up from prior levels that pushed long-end yields lower and knocked the dollar down sharply.
That mechanical move set the table. But the dollar was already vulnerable. A run of softer US macro data, including a surprise drop in retail sales and weaker jobs figures, had led markets to scale back expectations for further Fed tightening. The S&P Global Manufacturing PMI came in at 53.9 for July, with the August forecast ticking down to 53.8. Not a collapse, but a growth premium that is narrowing rather than widening.
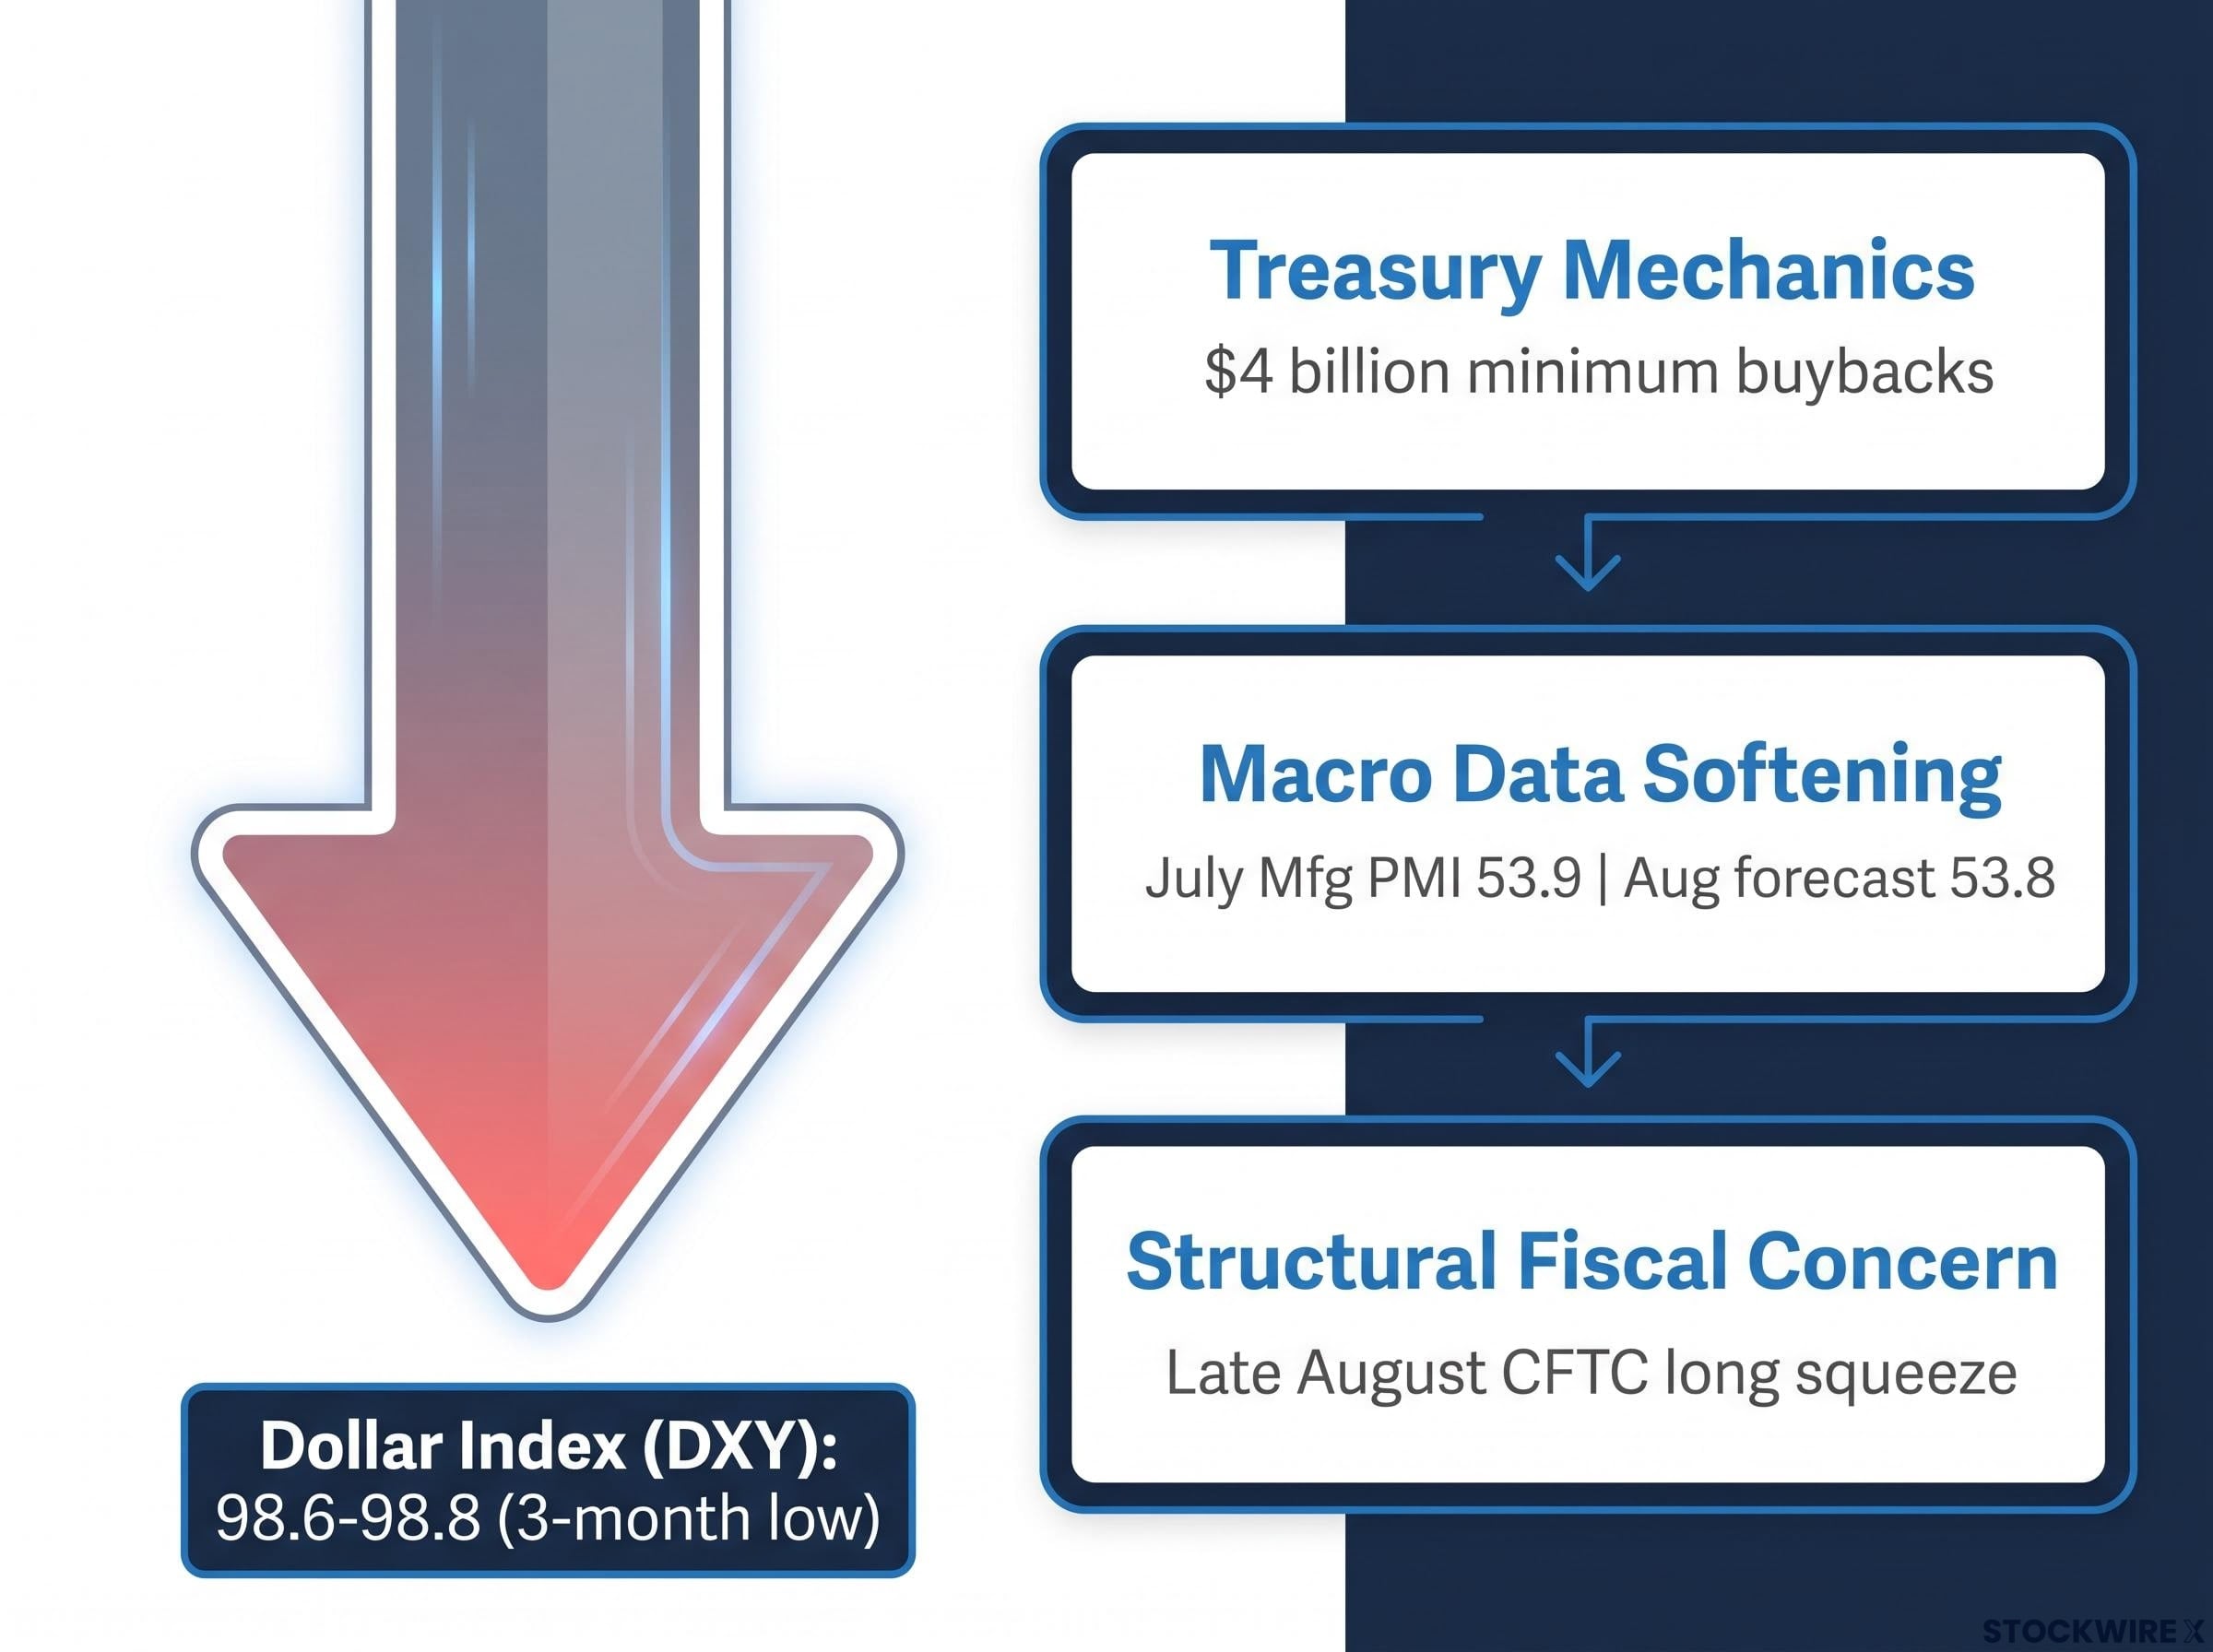
The three layers work like this:
- Treasury mechanics: Larger buybacks pulled yields lower, directly reducing the carry advantage of holding dollars
- Macro data softening: Weaker retail sales and jobs data challenged the narrative that US growth justifies a stronger dollar
- Structural fiscal concern: With deficits remaining large and the Fed nearing the end of its cycle, the dollar’s risk profile has shifted from one-way strength to two-sided volatility, and CFTC data show large net long dollar positions being squeezed in late August
When a selloff has three reinforcing drivers rather than a single reversible trigger, it tells you the move is less likely to snap back on a single data point. That distinction matters before you assess what it means for every other asset class you hold.
When big ASX news breaks, our subscribers know first
What a weaker dollar actually does to other assets
The inverse relationship between the dollar and most other asset prices comes down to a simple mechanical fact: most major currencies, gold, and many commodities are priced in dollars. When the dollar falls in value, the same underlying asset requires more dollars to purchase, which pushes its quoted price higher. A barrel of oil does not become more valuable in real terms just because the dollar weakens; it simply costs more dollars to buy.
That is the mechanical pricing channel, and it applies directly to forex pairs, gold, and oil. But there is a second channel: risk appetite. When softer US data and lower yields reduce the appeal of holding dollars or short-term Treasuries, some capital rotates toward higher-beta assets. Crypto, in particular, benefits from both channels simultaneously this week.
| Asset Class | Transmission Channel |
|---|---|
| Forex majors (GBP, EUR) | Mechanical pricing: weaker dollar = stronger quoted currency pair |
| Gold | Mechanical pricing + real yield: lower dollar and lower real yields both support gold |
| Crypto (BTC, ETH) | Risk appetite + debasement hedging: benefits from both channels simultaneously |
When everything moves together, pay attention
An isolated move in a single asset can be noise. Bitcoin rallying 5% on a crypto-specific headline tells you something about crypto sentiment. It does not tell you much about the macro environment.
But when dollar weakness, FX major strength, firmer gold, and crypto gains all align simultaneously, as they have this week with GBP/USD, EUR/USD, gold, and Bitcoin all pushing higher together, that synchronicity confirms genuine macro repositioning rather than noise in any single market. For you, that means the signal is more dependable. Crypto rallies that align with broader cross-asset risk strength and dollar weakness tend to be more durable than those driven by isolated headlines, because they reflect macro flows rather than speculation.
Sterling and the euro: two currencies, one common driver
Both GBP/USD and EUR/USD are benefiting from the same dollar weakness. The difference is what is happening on the other side of each pair, and that distinction tells you which move is more fragile.
GBP/USD has broken above 1.3650, reaching its strongest point since February 2026 and marking a genuine six-month high for the pair. The move is supported by both a weaker dollar and stronger-than-expected UK PMIs, which reinforce the view that the Bank of England is likely to remain relatively restrictive compared with the Fed. That gives the pound two legs to stand on: a dollar-negative driver and a pound-positive driver working simultaneously.
The euro’s story is less anchored. EUR/USD has cleared 1.1700, a level not seen since mid-June 2026, and now trades at the top of its recent range. But Eurozone data has been uneven, which means the euro’s strength is more purely a function of the US side of the pair. When a currency move is driven primarily by weakness in the other currency rather than domestic strength, it can reverse quickly on a single US data surprise.
| Pair | Current Level | Key Technical Level | Primary Driver |
|---|---|---|---|
| GBP/USD | Above 1.3650 | 1.36-1.37 (six-month high zone) | Dollar weakness + UK PMI strength + less dovish BoE |
| EUR/USD | Above 1.1700 | 1.17 (top of recent range) | Primarily dollar weakness; mixed Eurozone data |
Sterling’s move is more structurally supported than the euro’s right now. If you are choosing between the two pairs, that distinction matters for how much conviction you attach to current levels.
Gold at $4,600: what the resistance level means for portfolios
Gold is testing the $4,580-$4,600 area, a resistance zone sitting at the top of the range that has contained price action for the past six months. This is not an arbitrary line on a chart. The $4,600-$4,650 band coincides with Fibonacci retracements and moving average confluences on multiple timeframes, which means it is a level where a significant number of traders have orders clustered.
The move toward this level was driven simultaneously through two channels:
- Real yield channel: The Treasury buyback announcement pulled longer-dated yields lower, reducing the opportunity cost of holding gold (which pays no yield)
- Weaker dollar channel: The dollar index dropping to the 98.6-98.8 zone mechanically pushed gold’s dollar-quoted price higher
That dual-channel support is what makes this test of $4,600 more significant than routine price fluctuations near round numbers.
The dual-channel support driving gold toward $4,600 this week sits within a longer structural story: sovereign debt and gold allocation is being reshaped by central bank purchasing at a pace that signals reserve management rather than tactical positioning, with 244 tonnes accumulated in Q1 2026 alone.
If gold breaks decisively above the $4,600-$4,650 resistance band, upside targets open near $4,700 and $4,800, which would validate more aggressive hedging positioning.
For you, if you use gold as a portfolio hedge, the $4,600 level is a live decision point right now. If it holds as resistance, the current rally is a spike within an existing range, and your hedge sizing stays where it is. If it breaks, macro conditions have shifted enough to warrant reassessing how much gold exposure you carry.
Bitcoin above $77,000: debasement trade or risk-on rally?
This week Bitcoin pushed through the $77,000 mark, while Ethereum traded near $2,400 and XRP held close to $1.35. The broad altcoin participation is itself a signal: when gains are spread across the crypto market rather than concentrated in Bitcoin alone, it confirms a genuine risk-on backdrop rather than isolated flows into a single asset.
Two distinct channels are pulling crypto higher simultaneously:
- Debasement channel: The same fiscal credibility concerns driving gold, the Treasury buyback expansion, large deficits, and questions about dollar purchasing power, are supporting Bitcoin as an alternative store of value. FX and macro commentary explicitly framed the dollar selloff as feeding “a gold-and-bitcoin debasement trade.”
- Risk-on channel: Softer US data, lower yields, and a weaker dollar have encouraged broad risk appetite, reducing the relative appeal of holding dollars or short-term Treasuries and nudging capital toward higher-beta assets including digital currencies.
Bitcoin’s debasement hedge credentials are contested by the historical record: in 2022, the most significant real-world inflation test either asset has faced, Bitcoin lost roughly 77% of its value while gold remained broadly stable, a divergence that matters for investors deciding how much weight to place on the debasement narrative currently driving both assets higher.
Macro desk commentary described the dollar selloff as having strengthened both gold and bitcoin as debasement hedges, with both assets drawing flows from investors concerned about fiscal credibility and the longer-term purchasing power of the dollar.
The fact that Bitcoin is being lifted by two distinct and currently reinforcing channels gives this rally a more defensible macro foundation than moves driven purely by crypto-specific news. That matters for how you size the position: a macro trade warrants different conviction than a speculative spike.
Three scenarios that will decide whether this dollar move has legs
The upcoming S&P Global release of preliminary August PMI readings for manufacturing and services represents the first significant test of whether the US growth narrative can still prop up the dollar. The figures are due at 2:45pm London time / 9:45am New York time.
Consensus forecasts (S&P Global, attributed to Elias Haddad at Brown Brothers Harriman): Manufacturing PMI at 53.8 (from July’s 53.9); Services PMI at 54.0 (from the prior month’s 54.6).
The data creates three distinct paths:
| Scenario | Dollar Direction | Implication for Key Assets |
|---|---|---|
| A: PMIs stronger than expected | Stabilises or retraces higher | EUR/USD and GBP/USD pull back from highs; gold faces selling near $4,600; crypto may see profit-taking as rate-cut expectations are pared |
| B: PMIs broadly in line (mild deceleration) | Existing downtrend persists at slower pace | Attention shifts to relative European and UK data surprises to drive FX beyond current ranges |
| C: PMIs disappoint significantly | Dollar index drops further | EUR/USD and GBP/USD push to fresh highs; gold makes another run at $4,600+; risk assets rally on dovish Fed implications, though very weak data could trigger growth-fear volatility |
The PMI release is not just a data point. It is the first major test of whether the narrative driving this week’s cross-asset moves holds. Even a broadly correct macro view can be temporarily invalidated by a single strong print, which is why position sizing around the event matters as much as directional conviction.
The macro repricing driving this week’s cross-asset move is also unfolding against a changed Fed communication regime: with forward guidance scrapped, each US data release now carries greater rate-expectation weight than it did under the prior regime, amplifying the market impact of prints like the upcoming PMI.

What the cross-asset confirmation tells you before the data lands
The core signal this week is structural, not just directional. When dollar weakness, FX major strength, firmer gold, and crypto gains align simultaneously, the macro repositioning is more dependable than any single market move taken in isolation.
That said, the current move reflects cyclical repricing, a reassessment of Fed expectations and US growth, feeding into what could become structural dollar weakness. The distinction matters. Cyclical repricing can reverse on one data print. Structural weakness requires sustained erosion of US growth and fiscal credibility. The evidence so far supports the former beginning to feed the latter, but confirmation is still ahead.
Your key technical levels to watch from here:
- DXY: 98.6-98.8 (current three-month low zone; a break below signals further dollar weakness)
- GBP/USD: 1.36-1.37 (six-month high zone; the level where sterling’s breakout is confirmed or fails)
- EUR/USD: 1.17 (top of recent range; a sustained break suggests a more entrenched dollar downtrend)
- Gold: $4,600-$4,650 (six-month range resistance; a break opens $4,700-$4,800 targets)
Directional conviction is only half the equation right now. Position sizing around the PMI event risk and other upcoming US data matters as much as being right on the macro direction. These four levels are your live decision points, not abstract reference numbers. Treat them accordingly.
This article is for informational purposes only and should not be considered financial advice. Investors should conduct their own research and consult with financial professionals before making investment decisions. Past performance does not guarantee future results. Financial projections and scenario analysis are subject to market conditions and various risk factors.