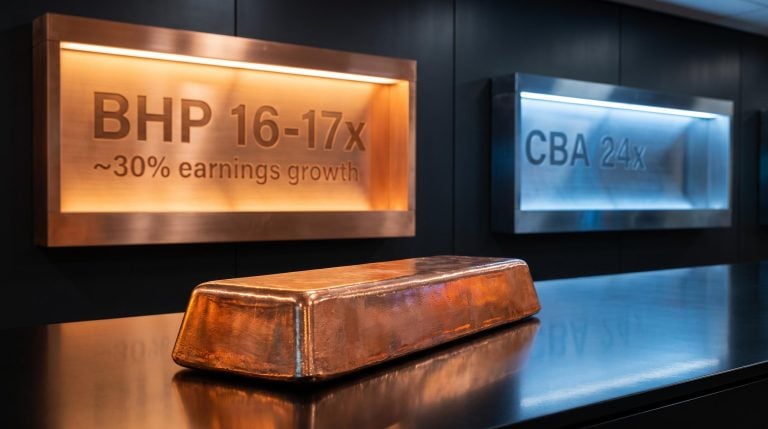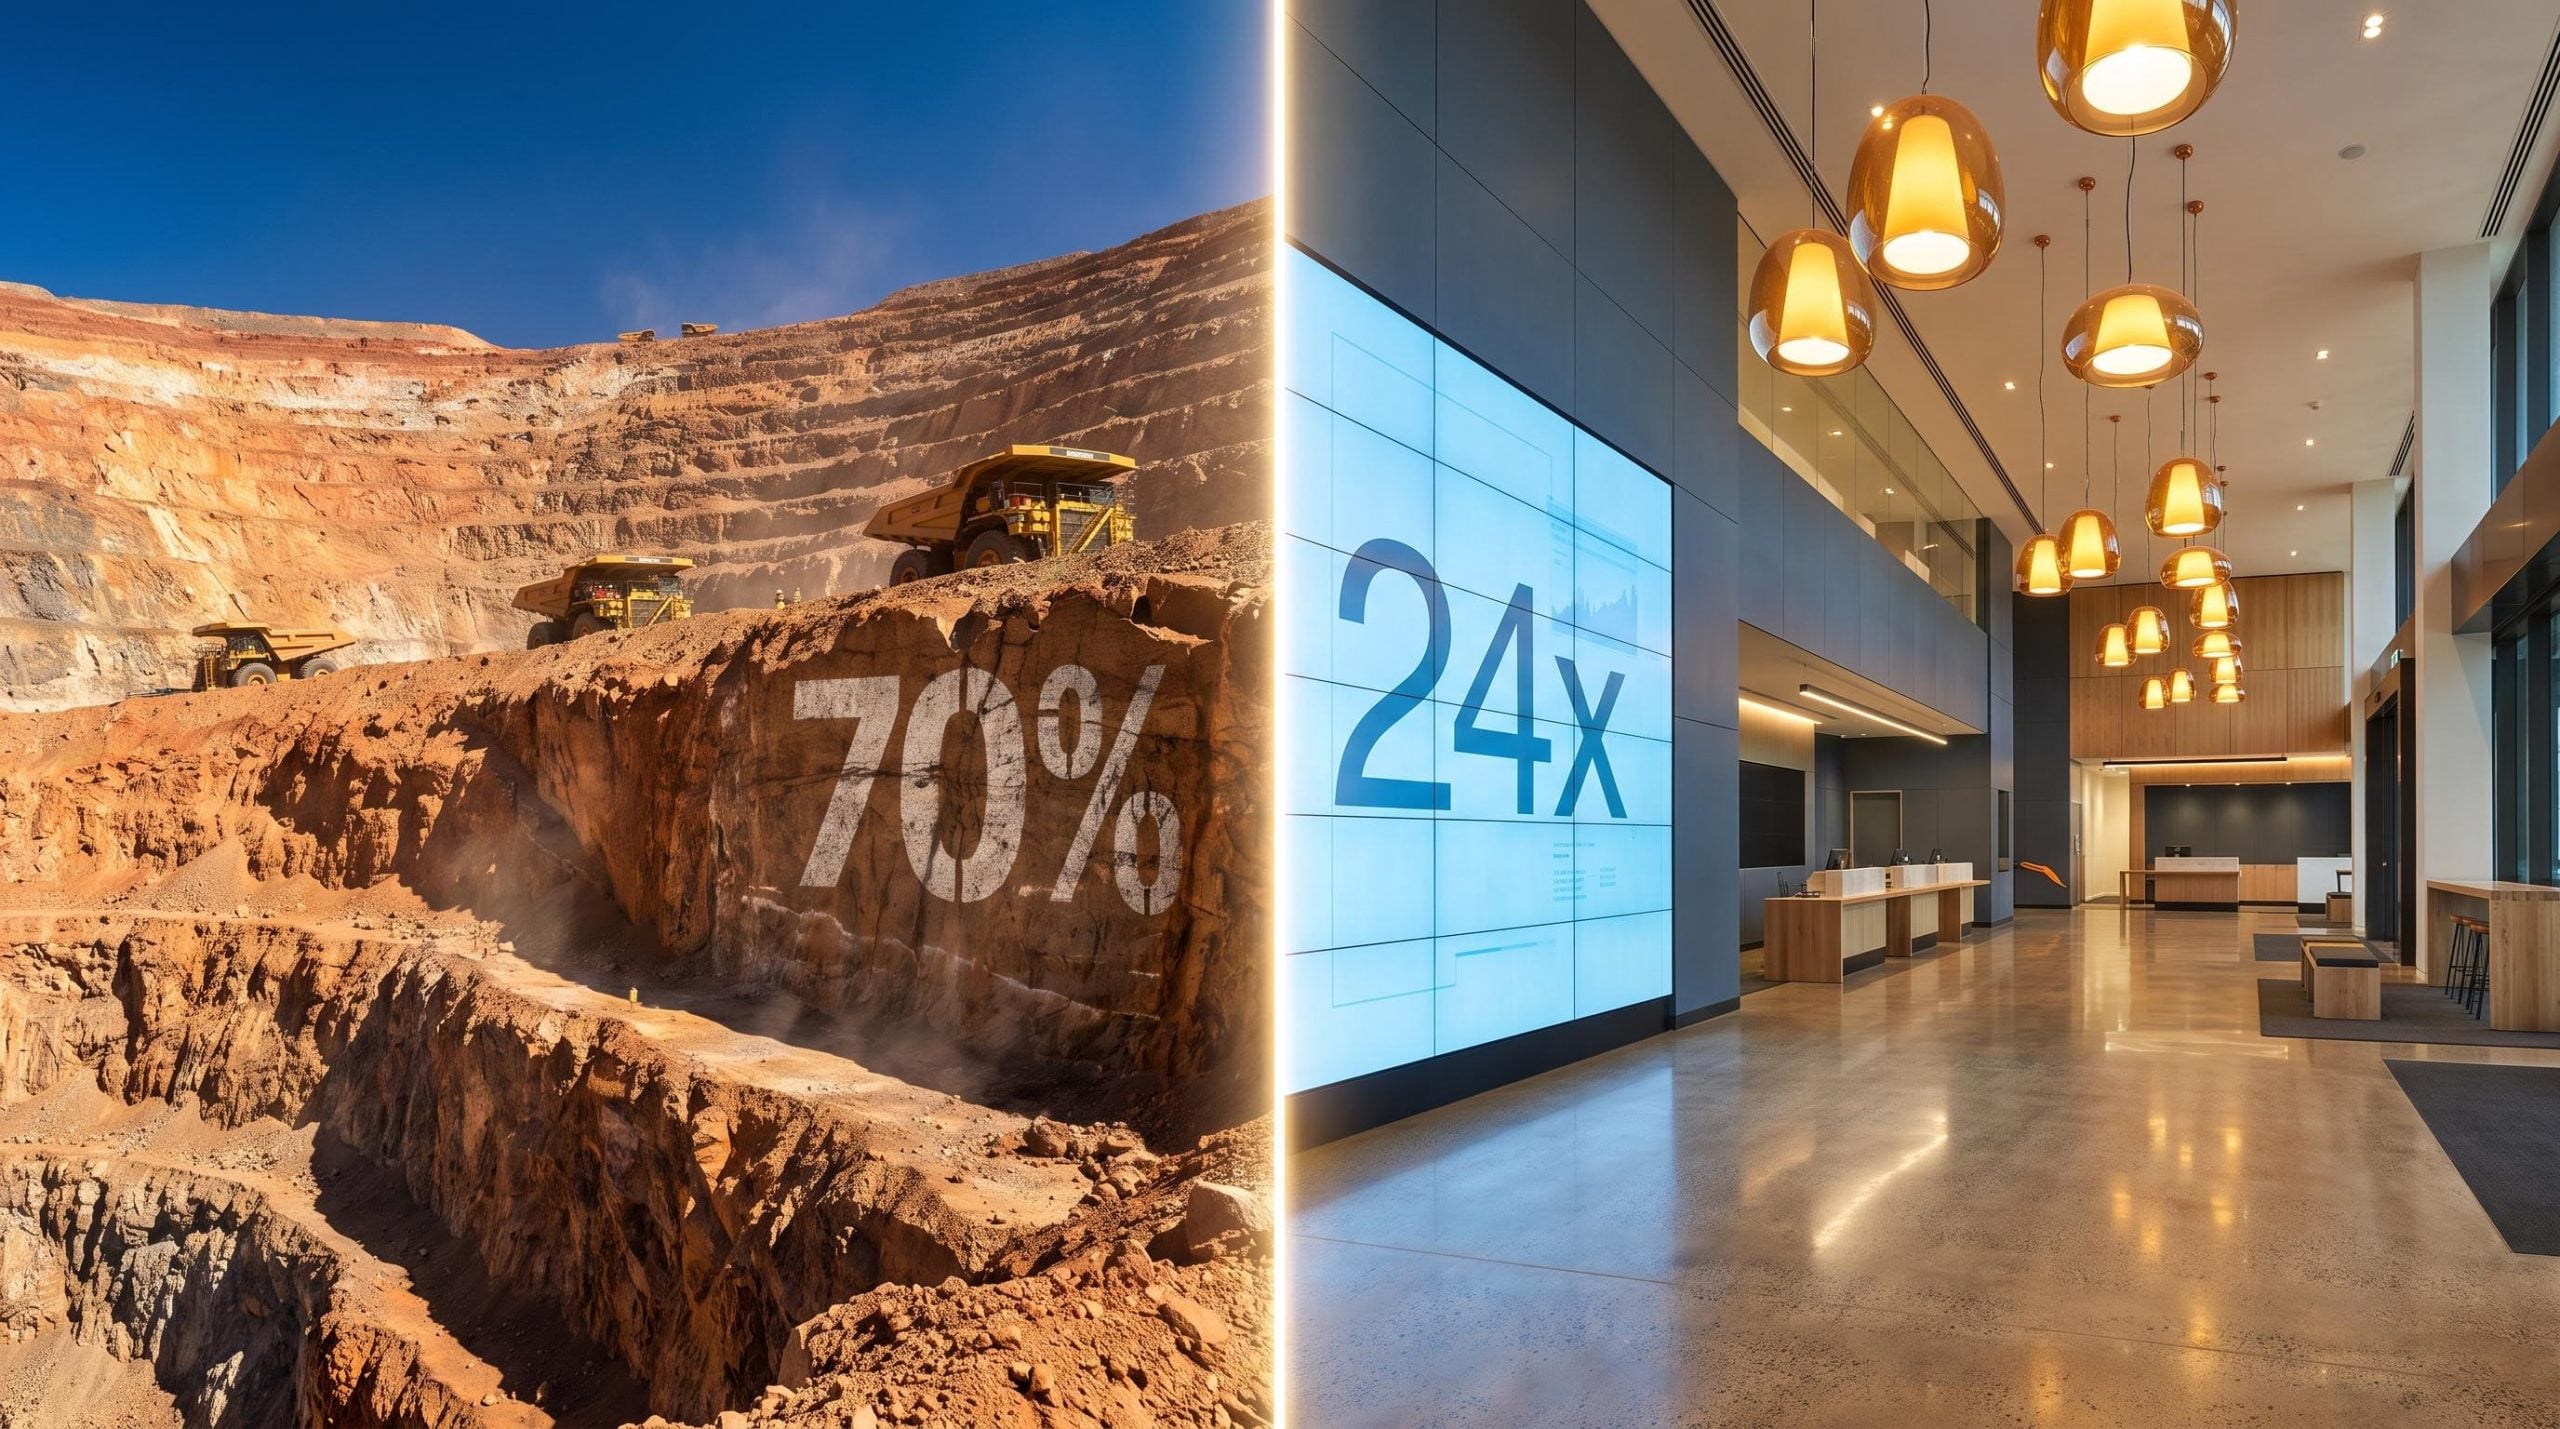
CBA just reported record profit. BHP just reported its highest dividend in four years. Both announcements landed in the same August 2026 reporting season, and yet the two stocks are telling very different stories about where Australian investors should be putting new money right now.
The FY26 results season has sharpened one of the most consequential allocation questions in Australian retail investing: between Australia’s largest bank and its largest miner, which blue-chip earns a fresh position heading into the final quarter of 2026? The answer is less obvious than it looks. CBA’s record profit sits alongside falling mortgage applications, and BHP’s mining heritage now conceals a copper business generating margins that rival the best technology companies on the ASX.
Here is a structured comparison of both companies as they actually stand today, covering earnings momentum, valuation, income, risk profile, and portfolio fit, so you can make a clear-eyed allocation call rather than defaulting to brand familiarity.
What BHP’s FY26 result actually tells you about the business it has become
The headline numbers were strong. The real story was where those numbers came from.
- Underlying EBITDA (earnings before interest, tax, depreciation, and amortisation) rose approximately 27% year-on-year to about US$32.9-33 billion.
- Underlying attributable profit climbed 30% to around US$13.2 billion, beating consensus estimates.
- Revenue increased roughly 15% to approximately US$58.8 billion.
- Final dividend of US$0.99 per share; full-year payout of US$1.72 per share, the highest in four years; total cash returns approximately US$8.7 billion.
- Net debt fell to approximately US$8.7-9 billion, around 0.3x trailing EBITDA.
Every one of those numbers beat or matched expectations. But the number that redefines how you should think about BHP sits in the copper division.
Copper at 54% of EBITDA: what the margin means
For the first time in BHP’s history, copper contributed approximately 54% of group EBITDA, generating roughly US$18 billion in earnings.
Copper delivered an EBITDA margin of approximately 70%, a level of profitability that says as much about cost discipline and pricing power as it does about commodity prices.
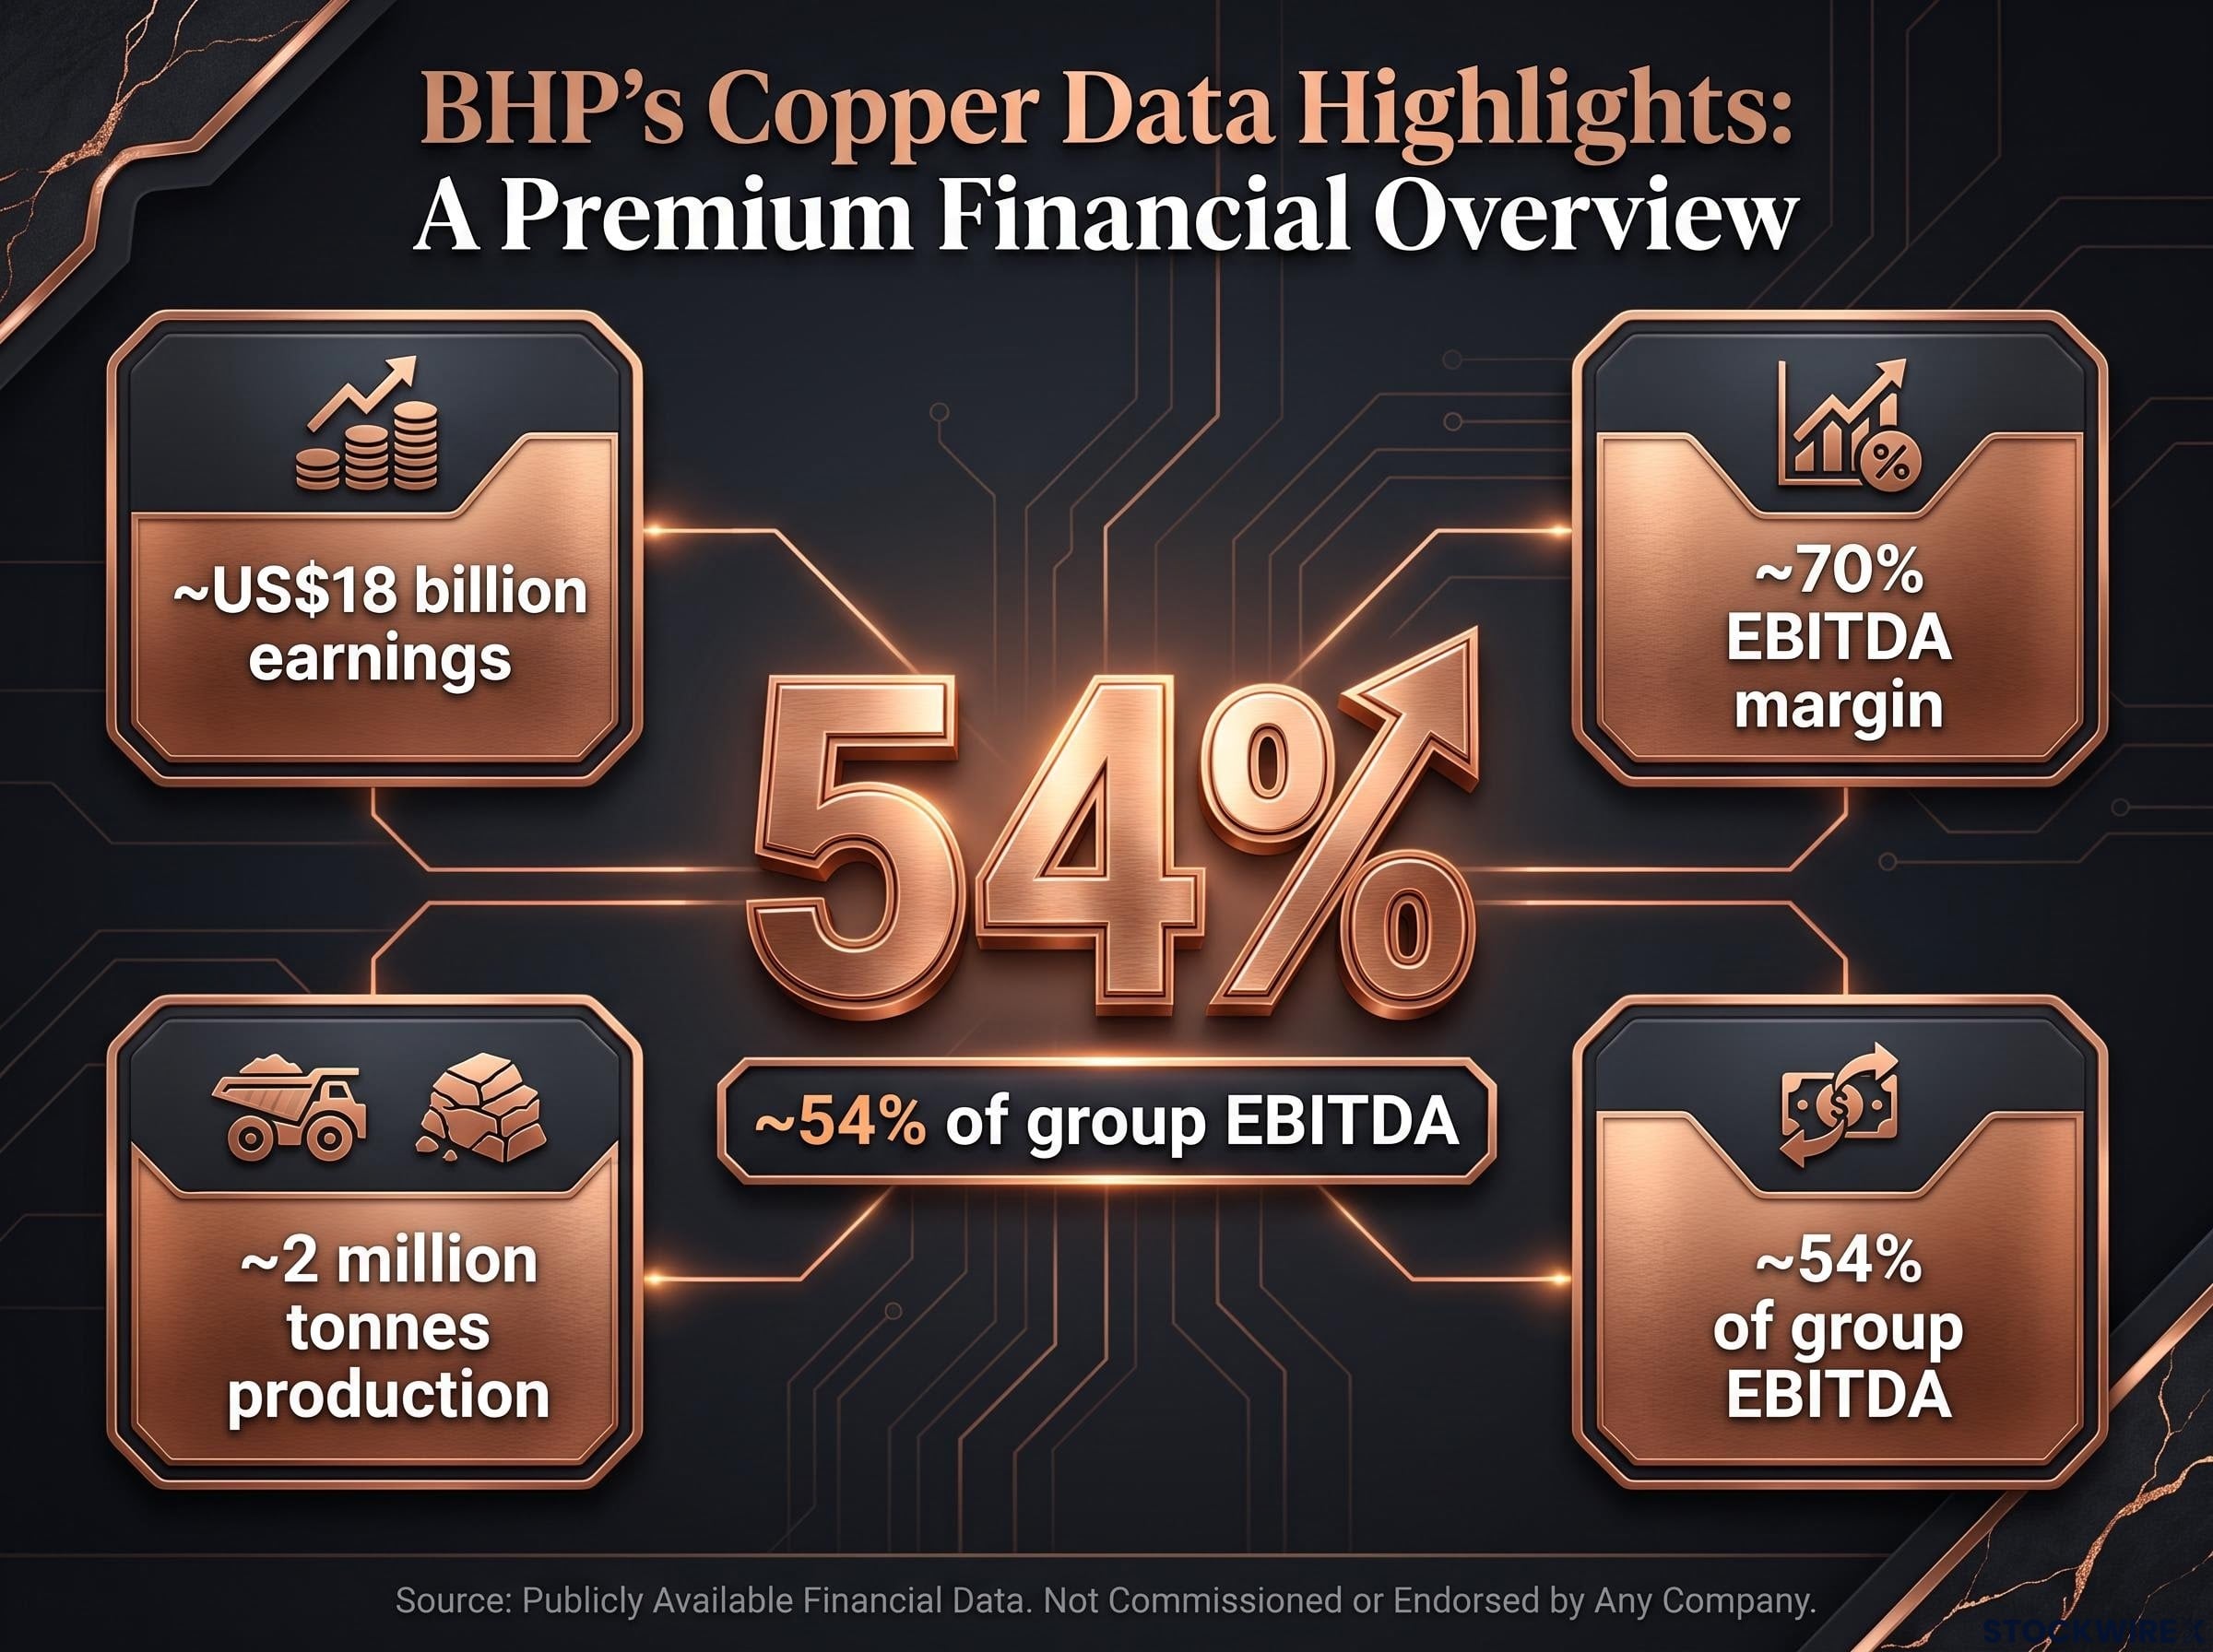
A 70% EBITDA margin on a primary business segment tells you something specific about earnings quality. It means the business can absorb meaningful price declines before earnings turn negative. It means free cash flow generation is structurally high, not just cyclically elevated. Iron ore still contributed positively, but the centre of gravity has permanently shifted.
Copper production held close to 2 million tonnes for a second consecutive year, and the demand side is not purely price-cyclical. Grid infrastructure buildouts, electric vehicle manufacturing, and broader electrification programmes are creating structural consumption growth. That is the earnings driver investors need to price in: not just where copper trades today, but why the floor under demand is rising.
The copper supply deficit underpinning BHP’s earnings visibility is larger than most investors appreciate: UBS projects a 2026 refined market shortfall of approximately 520,000 metric tonnes, more than double the 2025 deficit, driven by three simultaneous supply failures including a Chinese sulphuric acid export halt and a force majeure at Freeport-McMoRan’s Grasberg mine.
When big ASX news breaks, our subscribers know first
CBA’s record profit and the housing problem buried inside it
Start with what CBA genuinely achieved. Cash net profit after tax (NPAT) rose approximately 7% to A$10.98-11.0 billion, a record. Pre-provision profit increased around 6% to A$16.5 billion. Return on equity (ROE, the profit a company generates relative to shareholders’ equity) lifted to approximately 14.0%.
The final dividend was set at A$2.70 per share, fully franked, taking the full-year payout to A$5.05 per share, up A$0.20 on FY25. The CET1 capital ratio (a measure of a bank’s core capital strength) ended the year at approximately 12.0%, comfortably above regulatory requirements.
On the surface, this is a business firing on every cylinder. Then you look at the mortgage data.
Why CBA’s mortgage exposure matters more than the headline profit
Net interest margin (NIM, the difference between what a bank earns on loans and pays on deposits) edged down from 2.08% to 2.05%, a 3 basis point decline. That compression matters, but it is the volume picture that carries the real signal.
| Applicant Type | Decline from May Peak | Year-on-Year Change |
|---|---|---|
| Total | ~15% | ~17% below |
| Owner-Occupier | ~9% | — |
| Investor | ~28% | — |
A 28% drop in investor loan applications since the May 2026 federal budget tells you the most price-sensitive segment of CBA’s mortgage book is pulling back hard. If that persists, loan-book growth will slow materially in the periods ahead.
Across the peer group, all four major banks reported weakness in mortgage volumes. ANZ fared best among the four, with a decline of around 12%, while NAB suffered the steepest fall. CBA’s approximate 15% decline placed it in the middle of the pack, though its position as Australia’s dominant home lender means the earnings impact is proportionally larger than for peers. Credit quality remains relatively sound, with arrears rising gradually and bad debts contained, but that limits near-term downside rather than resolving the structural drag from weaker demand.
Arrears across home and personal loans are rising in parallel with the mortgage volume decline, with 90-plus day home loan arrears at 0.73% and personal loan delinquencies also climbing, confirming that the mortgage application trend and credit quality indicators are moving in the same direction simultaneously.
For CBA, the headline profit is the lagging indicator. The mortgage application trend is the leading one.
Understanding the valuation gap between a mid-teens multiple and a 24x multiple
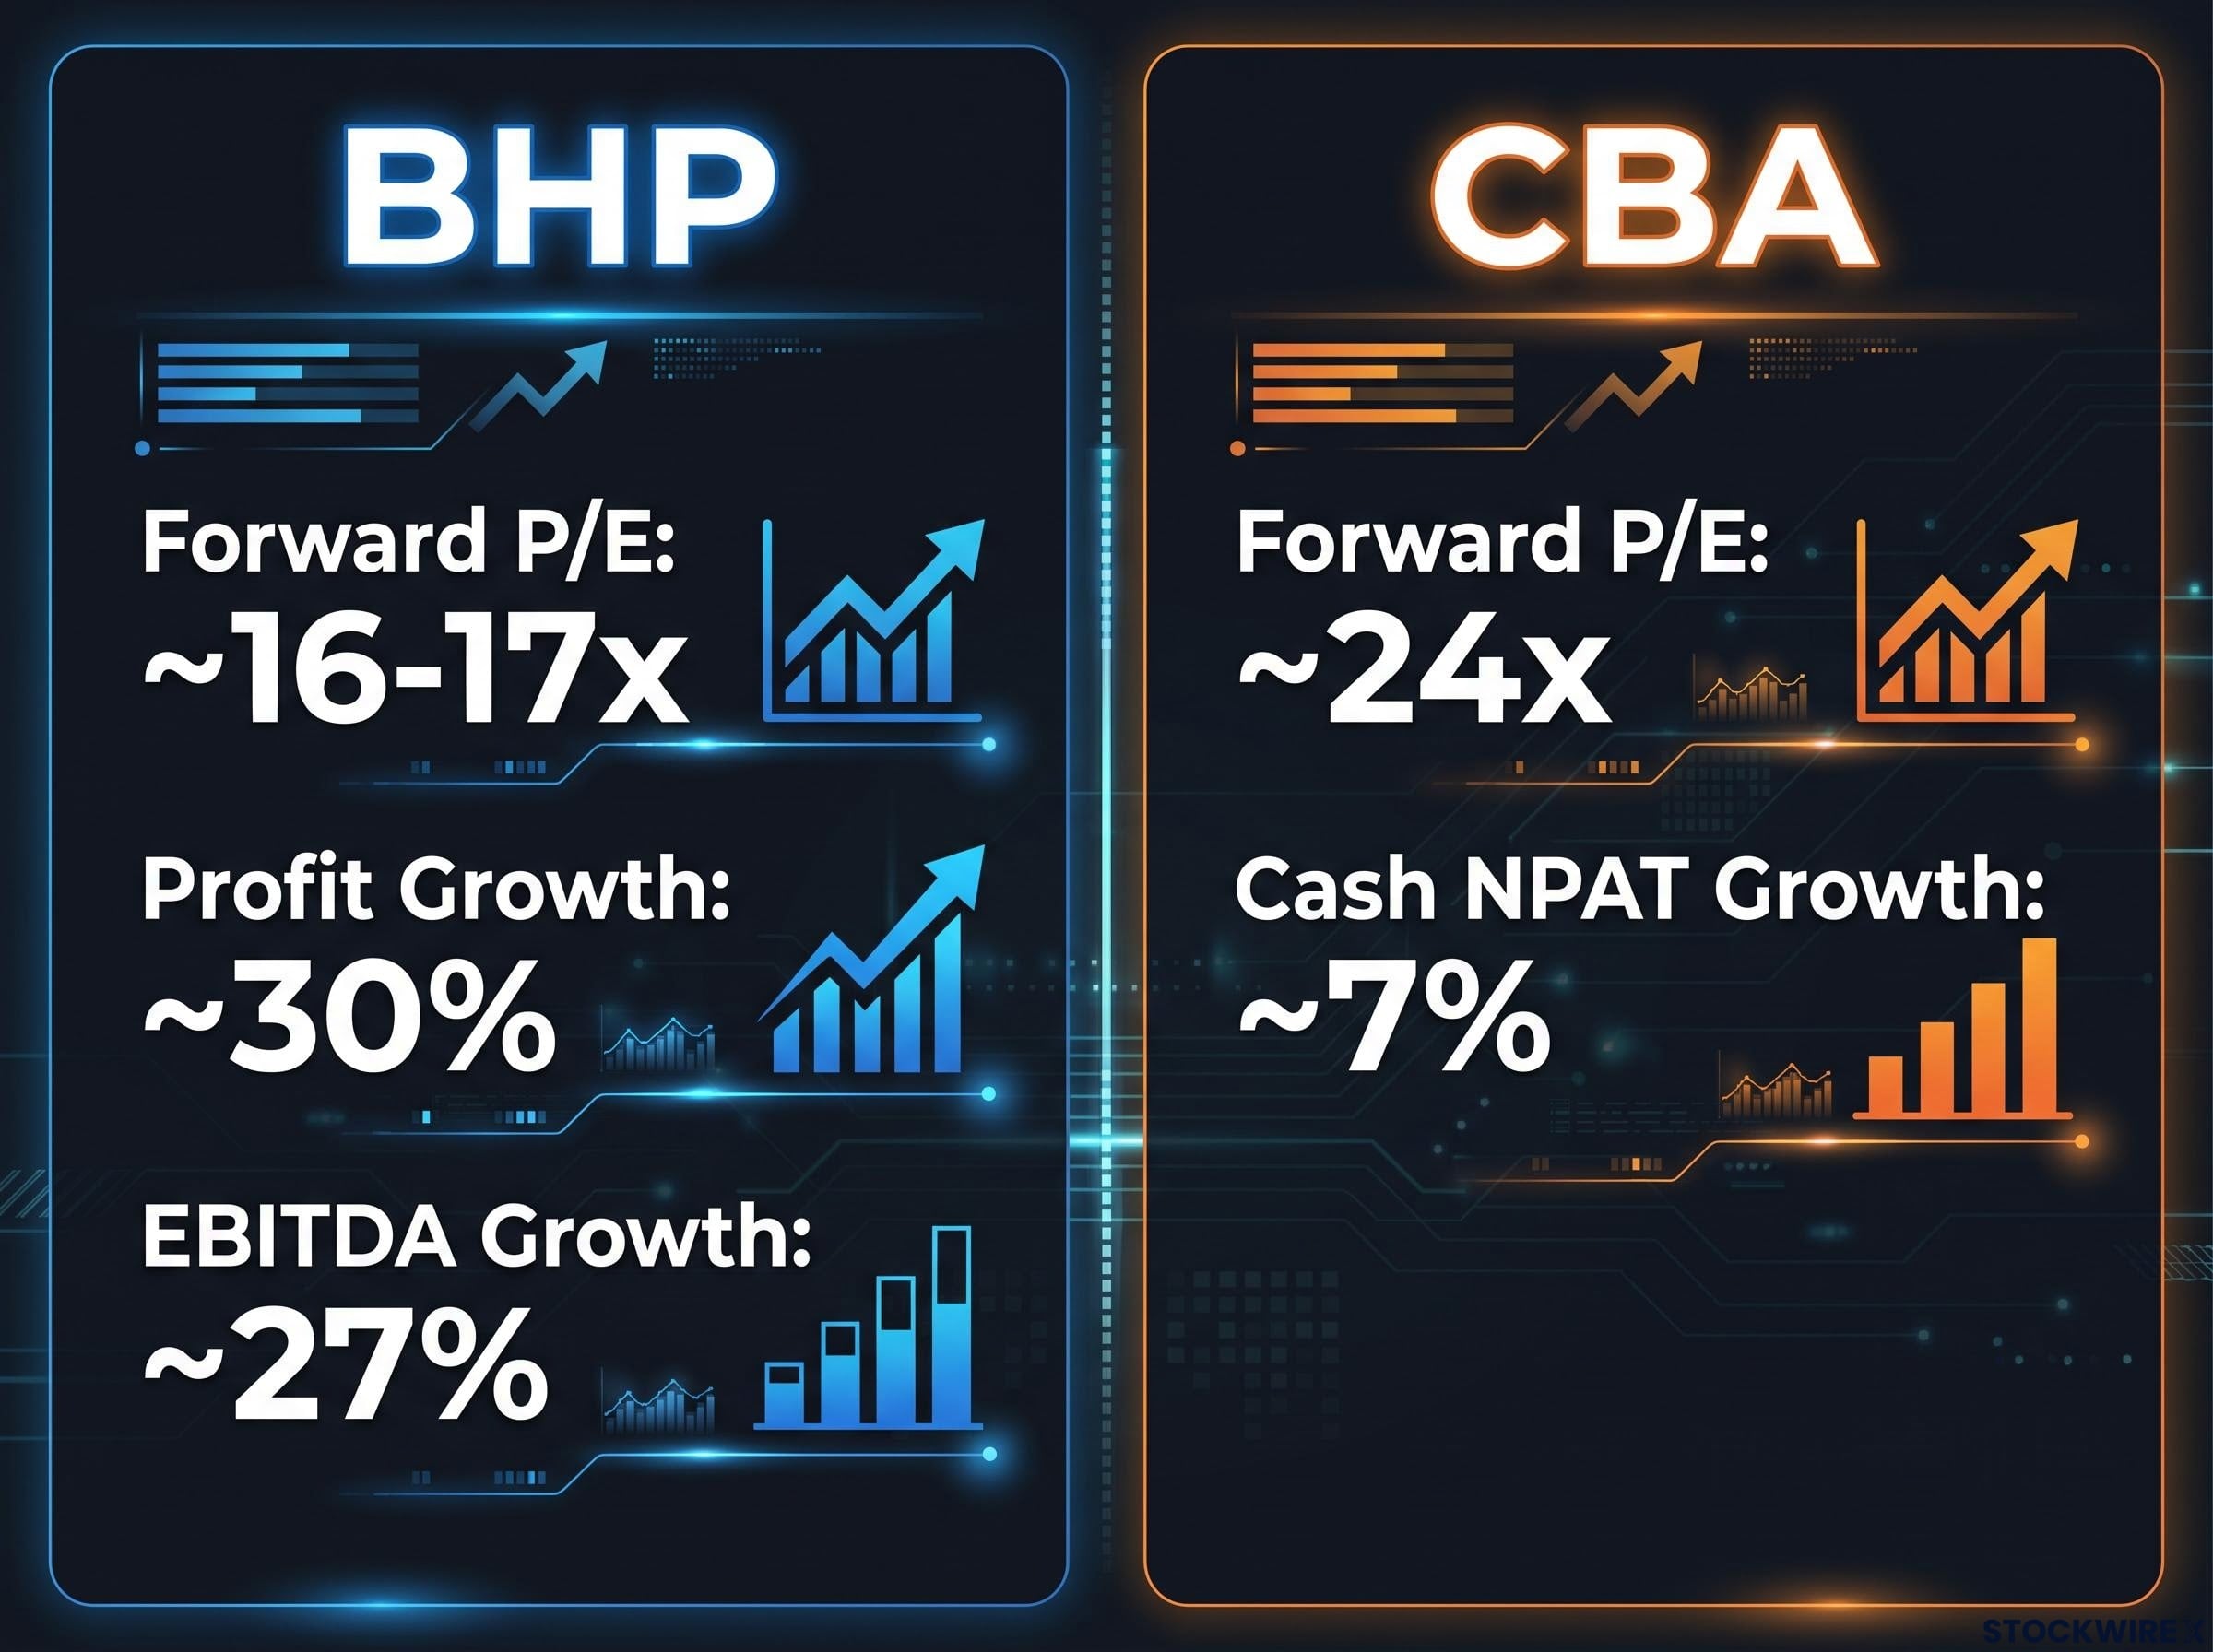
A price-to-earnings (P/E) multiple tells you how much investors are paying for each dollar of a company’s annual profit. A stock on a 16x multiple costs you $16 for every $1 of earnings. A stock on 24x costs you $24 for the same dollar. The higher the multiple, the more growth or stability the market is already pricing in, and the less room there is for disappointment.
| Stock | Forward P/E | FY26 Earnings Growth | Net Debt/EBITDA | Full-Year Dividend |
|---|---|---|---|---|
| BHP | ~16-17x | ~30% (profit), ~27% (EBITDA) | ~0.3x | US$1.72/share |
| CBA | ~24x | ~7% (cash NPAT) | N/A (bank) | A$5.05/share |
BHP trades on approximately 16-17x forward earnings despite delivering 27% EBITDA growth and a 30% profit increase. CBA trades on approximately 24x with 7% cash NPAT growth and a mortgage franchise under visible pressure. CBA’s valuation is considered stretched relative to both global banking peers and domestic growth stocks.
Here is why that gap matters in practical terms:
- Assume CBA earns exactly the same profit next year (flat earnings, no deterioration).
- If the market de-rates CBA from 24x to 20x, which is still a premium multiple for an Australian bank, the share price would fall approximately 17%.
- That capital loss would occur without any earnings decline. The risk is purely valuation compression.
What this tells you is that at 24x, CBA’s primary risk is not an earnings risk but a valuation risk. The stock can fall meaningfully even if the business performs to expectations, simply because the market decides to pay less per dollar of profit. BHP at 16-17x, supported by 0.3x leverage and strong cash generation, carries a much wider margin of safety.
CBA’s valuation gap relative to global banking peers has persisted for years partly because compulsory superannuation flows into ASX 200 index funds create a structural, valuation-insensitive bid that keeps the stock elevated regardless of analyst price targets clustered 30-40% below the market price.
Dividend income in 2026: which blue-chip pays you more, and why the answer has flipped
Australian income investors have long defaulted to banks for yield. That pattern has inverted.
| Stock | Full-Year Dividend | Approximate Current Yield | Franking | Payout Ratio |
|---|---|---|---|---|
| BHP | US$1.72/share | Mid-single digits (higher than CBA) | Partial | 66% |
| CBA | A$5.05/share | Lower than BHP at current prices | Fully franked | — |
BHP’s full-year payout of US$1.72 per share, the highest in four years, translates to a mid-single-digit yield that currently exceeds CBA’s. CBA’s A$5.05 per share is fully franked, and franking credits (tax credits passed to shareholders on dividends where the company has already paid tax) remain a genuine advantage for eligible Australian investors. But that franking benefit does not fully close the yield gap at current relative prices.
Franking credit mechanics materially change the after-tax yield comparison for eligible Australian investors: fully franked dividends can be worth significantly more than their headline cash amount for superannuation funds and retirees, because excess franking credits are refundable directly by the ATO rather than simply offsetting tax owed.
The yield advantage sitting with a miner rather than a bank represents an unusual reversal of the traditional Australian income investing pattern. For self-managed super fund investors and retirees in particular, this warrants a position review.
The sustainability question matters too. BHP’s 66% payout ratio and 0.3x net debt to EBITDA tell you this is not a one-year anomaly funded by balance sheet drawdown. The dividend is supported by structural cash generation, principally from a copper business earning 70% margins.
If you are an income investor who defaults to banks for yield, the FY26 data says the default no longer holds.
Risk and cycle position: what each stock requires you to accept
The choice between BHP and CBA is not about which company is “better.” It is about which set of risks you are better equipped to carry.
BHP’s risks in context
Key positives:
- Copper as the primary earnings driver, supported by structural energy-transition demand
- Net debt at approximately 0.3x EBITDA, providing a significant buffer against commodity price swings
- Long-dated optionality through the Jansen potash project
- Balance-sheet flexibility for further capital management or strategic investment
Commodity price volatility remains real. A meaningful pullback in copper or iron ore prices would hit earnings and potentially compress the multiple. The legacy liability from the Samarco dam failure, which contributed roughly US$3.4 billion in exceptional items during FY26, continues to represent an unresolved balance-sheet overhang. The CEO transition following Mike Henry’s departure introduces low-level execution risk around major growth projects, even though recent communications have emphasised continuity.
For investors with a three-to-five-year view who can tolerate commodity cycles, the structural copper story plus diversified bulk and potash exposure provide a credible path for earnings to hold up better than at a typical cyclical peak.
CBA’s risks in context
Key positives:
- Australia’s most profitable bank, with sector-leading ROE and strong technology capabilities
- Record cash NPAT and growing dividends confirming underlying franchise strength
- Credit quality still reasonably sound, with arrears rising only gradually
| Stock | Primary Risk | Secondary Risk | Tail Risk | Current Mitigation |
|---|---|---|---|---|
| BHP | Commodity price volatility | Project execution / CEO transition | Samarco liability | 0.3x leverage, diversified portfolio |
| CBA | Valuation compression | Loan-book deceleration | Sustained housing downturn / unemployment rise | 12.0% CET1, sound credit quality |
The more immediate risk for CBA is not loan losses but valuation compression. The May 2026 budget changes have created a structural shift in investor borrowing appetite that could persist across multiple reporting periods. The August 2026 rotation episode is instructive: as sentiment shifted back toward technology stocks once the July AI market disruption cleared, funds flowed out of CBA and the share price fell without any deterioration in the underlying business. CBA’s premium valuation is not a static feature; it is an active exposure, one that leaves the stock vulnerable whenever higher-returning alternatives come back into view.
That distinction between earnings risk and valuation risk is the one Australian retail investors most often miss. A “defensive” sector label does not guarantee capital safety when the multiple is already stretched.
Matching each stock to the investor who should hold it
The right allocation depends on what you are trying to achieve.
| Investor Type | BHP Fit | CBA Fit | Key Consideration |
|---|---|---|---|
| Income-focused (incl. SMSF) | Higher yield, strong payout growth | Predictable, fully franked | BHP currently offers more income per dollar invested |
| Total-return | Copper structural demand, potash optionality | Growth constrained by NIM and mortgage volumes | BHP has a clearer medium-term earnings runway |
| Risk-averse | Commodity volatility requires tolerance | More stable earnings, but premium already priced | CBA’s “safety” is in the price; valuation risk is the dominant concern |
There is also a diversification argument that cuts one way. Many Australian portfolios are already concentrated in financials. Adding more CBA at current prices increases that concentration in a single, fully-valued sector. BHP adds global commodity exposure and a hedge against inflationary environments, making it an additive diversifier rather than a like-for-like trade.
For an investor who already holds CBA as a core position, the FY26 result does not justify adding more at current prices. The valuation leaves you exposed to de-rating risk without a commensurate return opportunity. For new capital heading into Q4 2026, the risk-reward case is clearer with BHP.
Three variables would change this analysis:
- A meaningful copper price pullback, which would weaken BHP’s case
- A significant CBA de-rating to approximately 20x or below, which would improve CBA’s value proposition
- A sustained rebound in mortgage applications over two or more quarters, which would improve CBA’s growth outlook
The allocation call heading into Q4 2026
The evidence built across this comparison points in one direction. BHP delivered approximately 27% EBITDA growth, a 30% profit increase, its highest dividend in four years, and a portfolio now led by copper at approximately 70% margins, all while trading on a mid-teens multiple with minimal leverage. CBA produced record cash NPAT and rising dividends, but faces a 15-17% decline in mortgage applications, a 28% drop in investor volumes, and a 24x multiple that leaves limited margin of safety.
For new capital heading into Q4 2026, BHP offers better value, stronger income, and clearer earnings momentum. CBA remains a quality hold rather than a fresh opportunity at current prices.
Rather than treating this as a permanent verdict, track three specific variables across the next two reporting periods:
- Copper price trajectory and tariff developments: a sustained pullback would compress BHP’s earnings and narrow the relative case.
- Australian mortgage application trends in the October and November data: a rebound sustained over two or more quarters would materially improve CBA’s growth outlook.
- CBA’s P/E multiple relative to the approximately 20x reversion level: a de-rating to that range would reopen the value case for the bank.
The most valuable habit an investor can build is not picking a winner once. It is knowing exactly which data points would change your mind, and watching them.
This article is for informational purposes only and should not be considered financial advice. Investors should conduct their own research and consult with financial professionals before making investment decisions. Past performance does not guarantee future results. Financial projections are subject to market conditions and various risk factors.