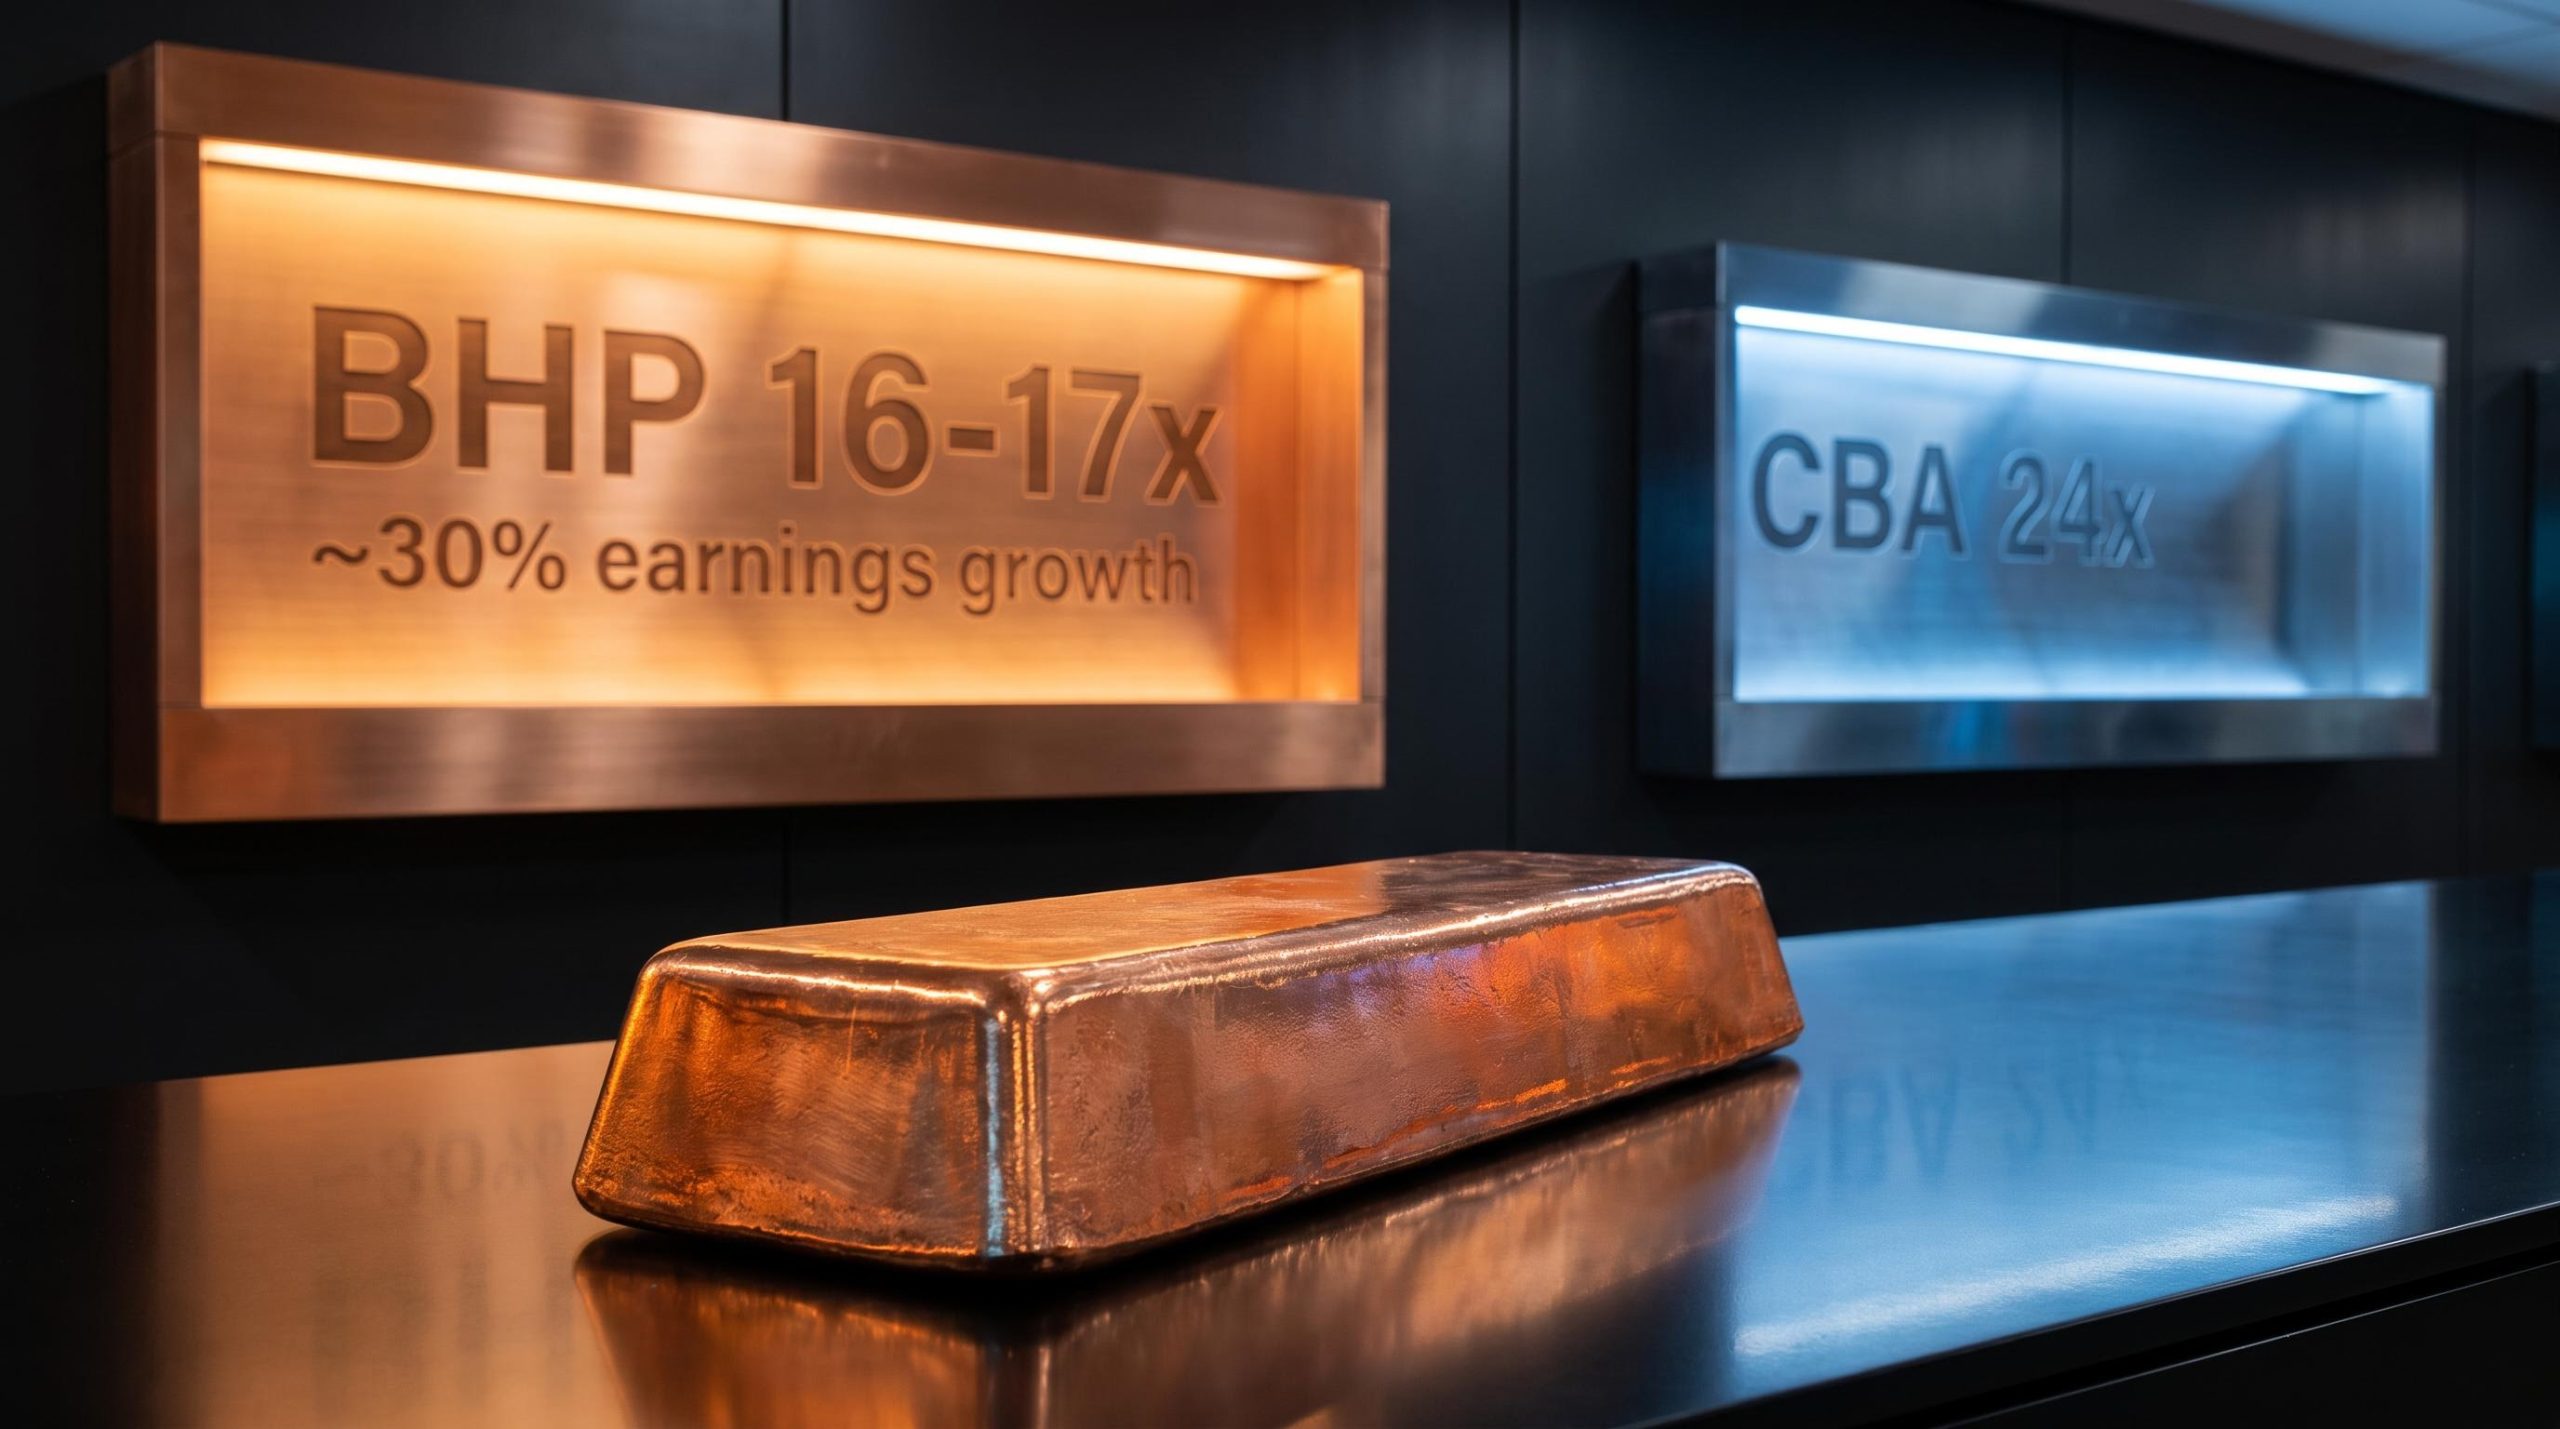
BHP trades at roughly 16-17x earnings. CBA trades at roughly 24x. The company growing profits at 30% a year costs less than the one growing them at 7%. That inversion is where every allocation decision between these two stocks should start.
Both companies have just reported full-year results, and the numbers brought genuine new information. BHP’s copper-led EBITDA surge confirmed a structural shift in its earnings mix. CBA’s mortgage application data revealed forward pressure that the headline profit figure does not capture. With Q4 2026 underway, investors reviewing their ASX core holdings have fresher data than they have had in months.
Here is what that data actually says about each company’s value at today’s price, broken down across earnings, income, risk, and forward positioning, so you can make a more grounded call on where to direct the next dollar.
The valuation gap that defines this comparison
BHP trades at approximately 16-17x forward earnings. CBA trades at approximately 24x. That is a 7-8 multiple point gap between two of the ASX’s largest companies.
The premium CBA commands is not irrational on its face. Its earnings are predictable. Its dividends are fully franked. Its retail banking franchise is dominant. Investors pay more for that combination because they trust it to deliver consistent returns with less volatility.
The analytical tension sits elsewhere. BHP grew underlying attributable profit by roughly 30% year-on-year in FY26. CBA grew cash net profit after tax by roughly 7%. When the faster-growing company trades at a materially lower multiple than the slower-growing one, the burden of proof shifts to the premium stock to justify its price. Charlie Akin is among the commentators who have publicly stated that BHP and miners more broadly are still trading well below their intrinsic worth.
ASX bank valuation methods beyond the headline PE ratio, including price-to-book, dividend discount models, and APRA capital-adjusted comparisons, often produce a meaningfully different picture of CBA’s risk-reward than a simple multiple comparison, particularly when franking credits and the credit cycle position are explicitly incorporated.
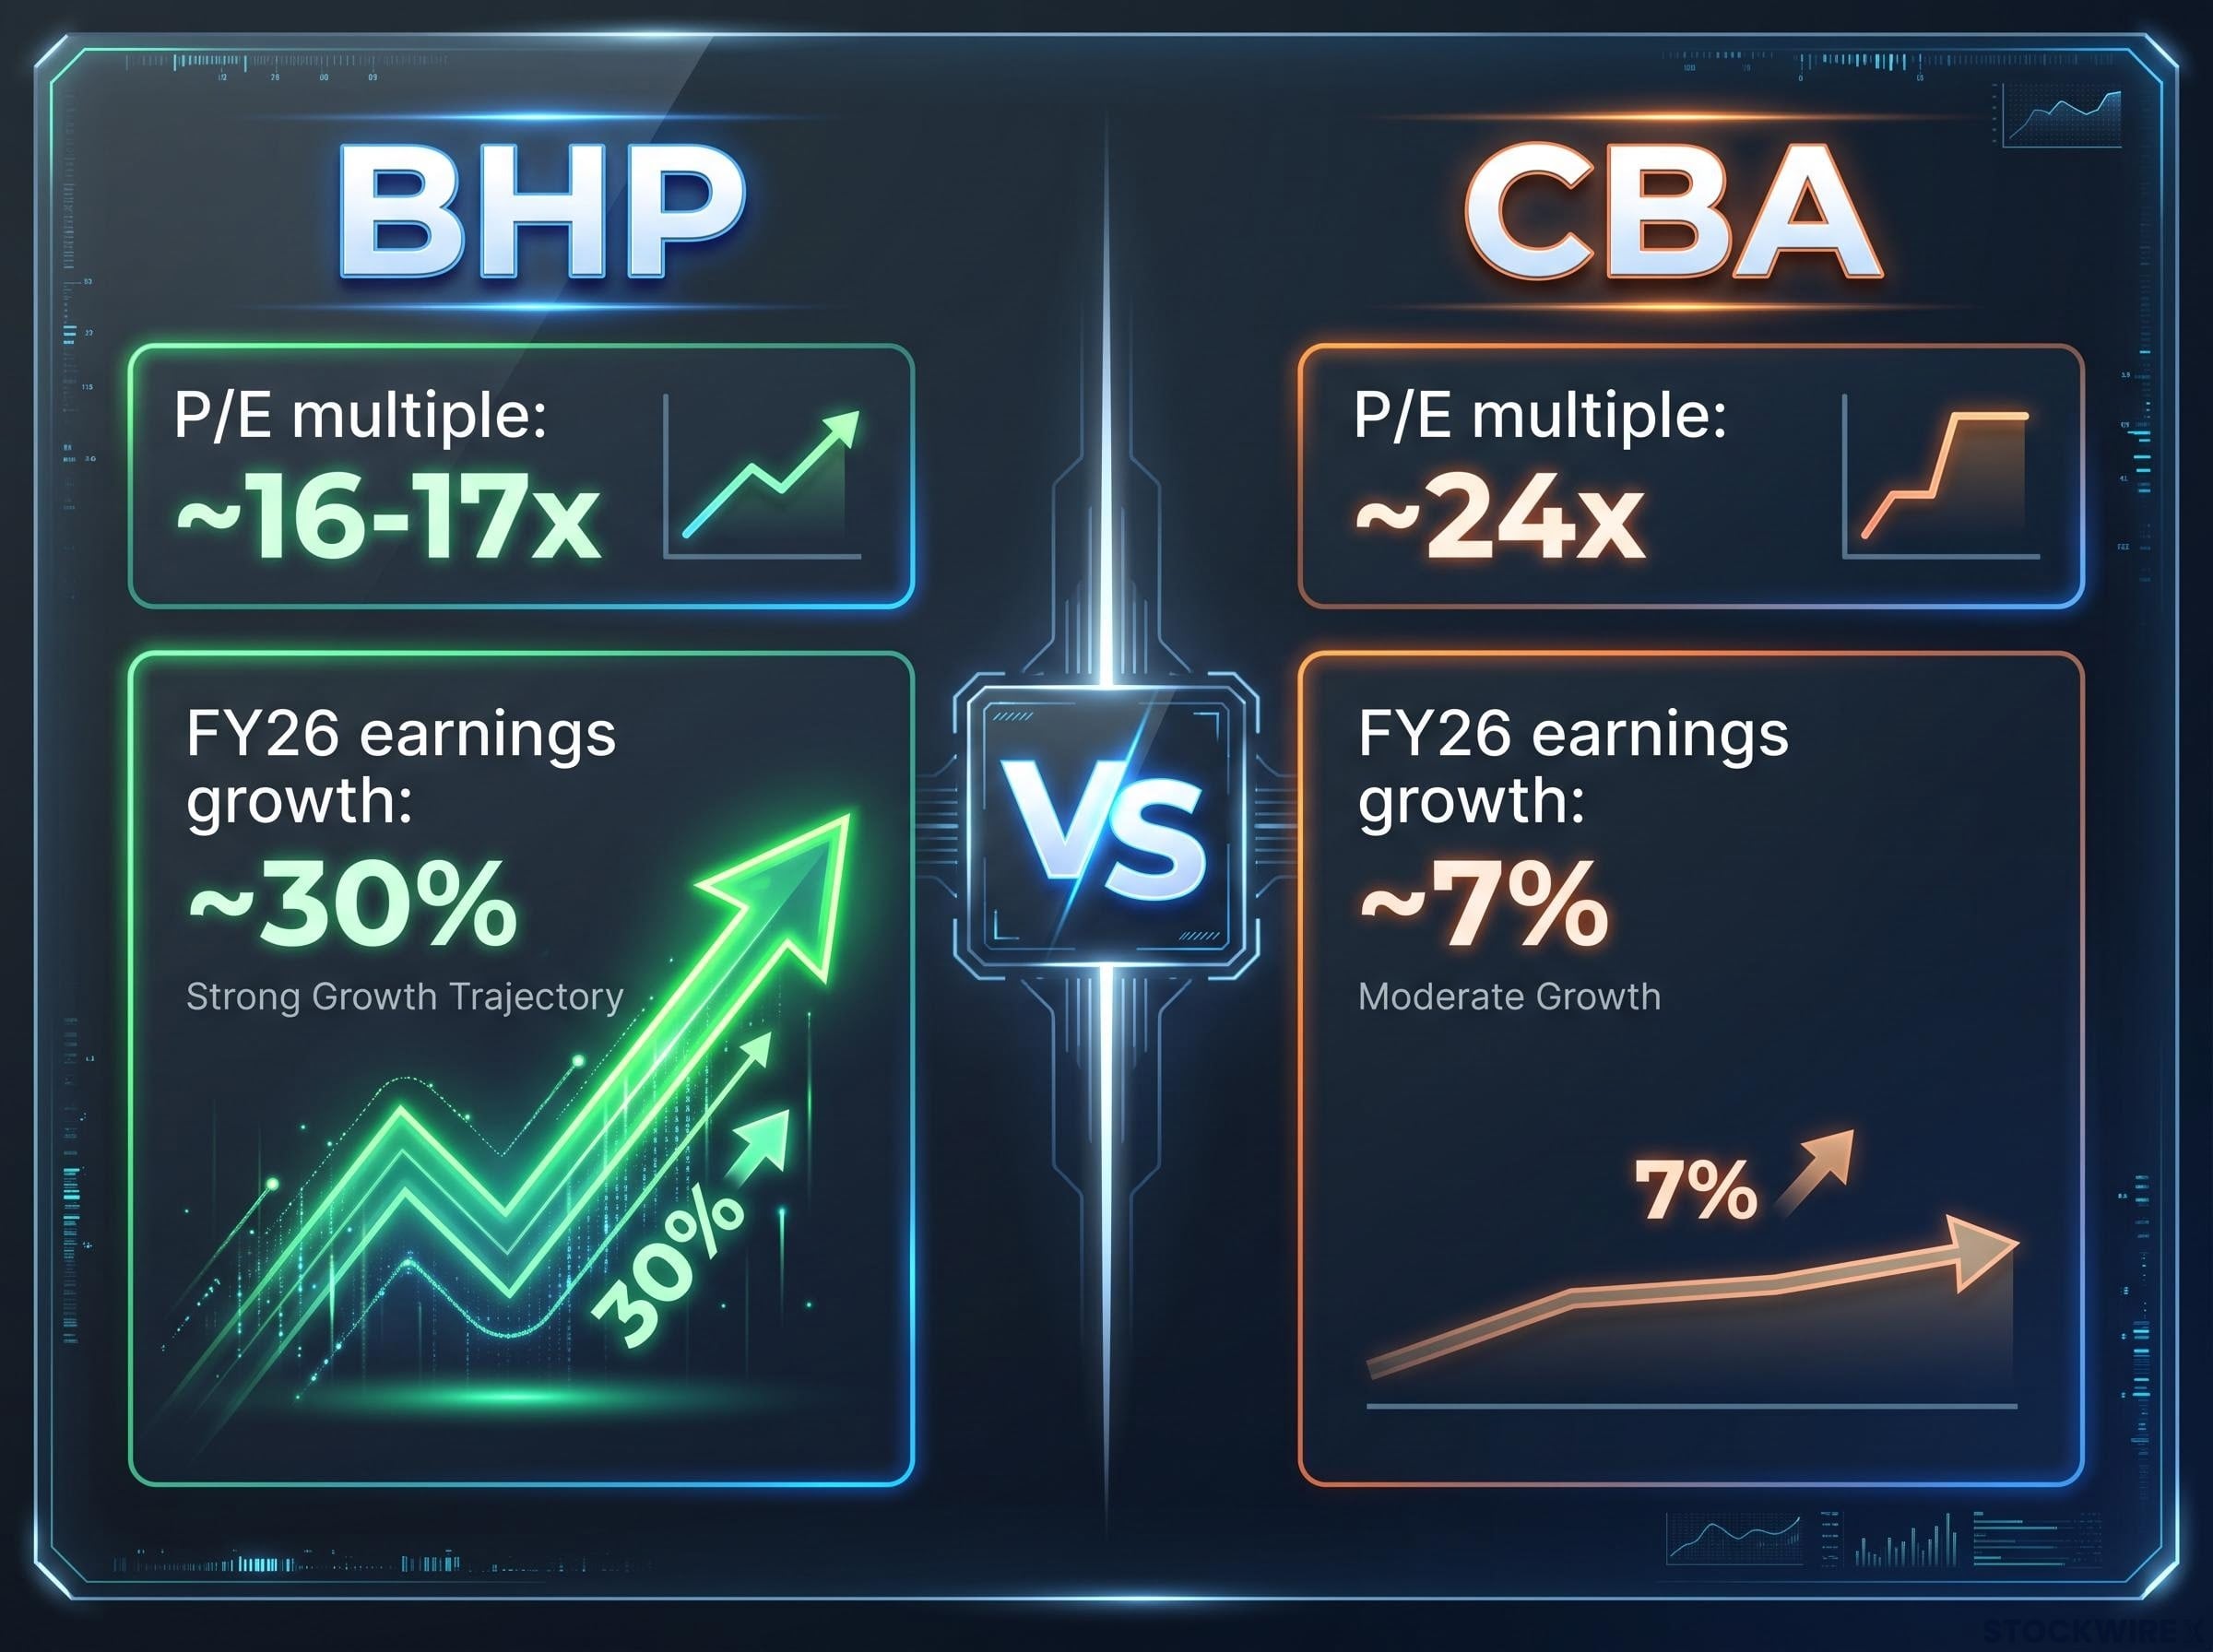
For investors adding fresh capital, that gap means entering CBA today requires paying a premium for predictability that may already be eroding, while BHP’s growth rate is not yet reflected in its price.
| Metric | BHP | CBA |
|---|---|---|
| P/E multiple | ~16-17x | ~24x |
| FY26 earnings growth (YoY) | ~30% | ~7% |
| Earnings quality | Cyclical, commodity-linked, copper-weighted | Predictable, housing-credit-linked, fully franked |
When big ASX news breaks, our subscribers know first
What BHP’s FY26 numbers actually show
The headline metrics tell a growth story: underlying EBITDA rose approximately 27% year-on-year to roughly US$33 billion, with margins close to 60%. Revenue reached approximately US$58.8 billion. Underlying attributable profit climbed roughly 30% to around US$13.2 billion. Net debt fell to approximately US$8.7 billion, equivalent to only 0.3x last-twelve-months EBITDA.
- Underlying EBITDA: ~US$33 billion, up ~27% YoY, ~60% margin
- Revenue: ~US$58.8 billion
- Underlying attributable profit: ~US$13.2 billion, up ~30%
- Net debt: ~US$8.7 billion (~0.3x LTM EBITDA)
- Copper EBITDA contribution: ~US$18 billion at ~70% margin
- Total FY26 dividends: US$1.72 per share (US$8.7 billion total), highest in four years, 66% payout ratio
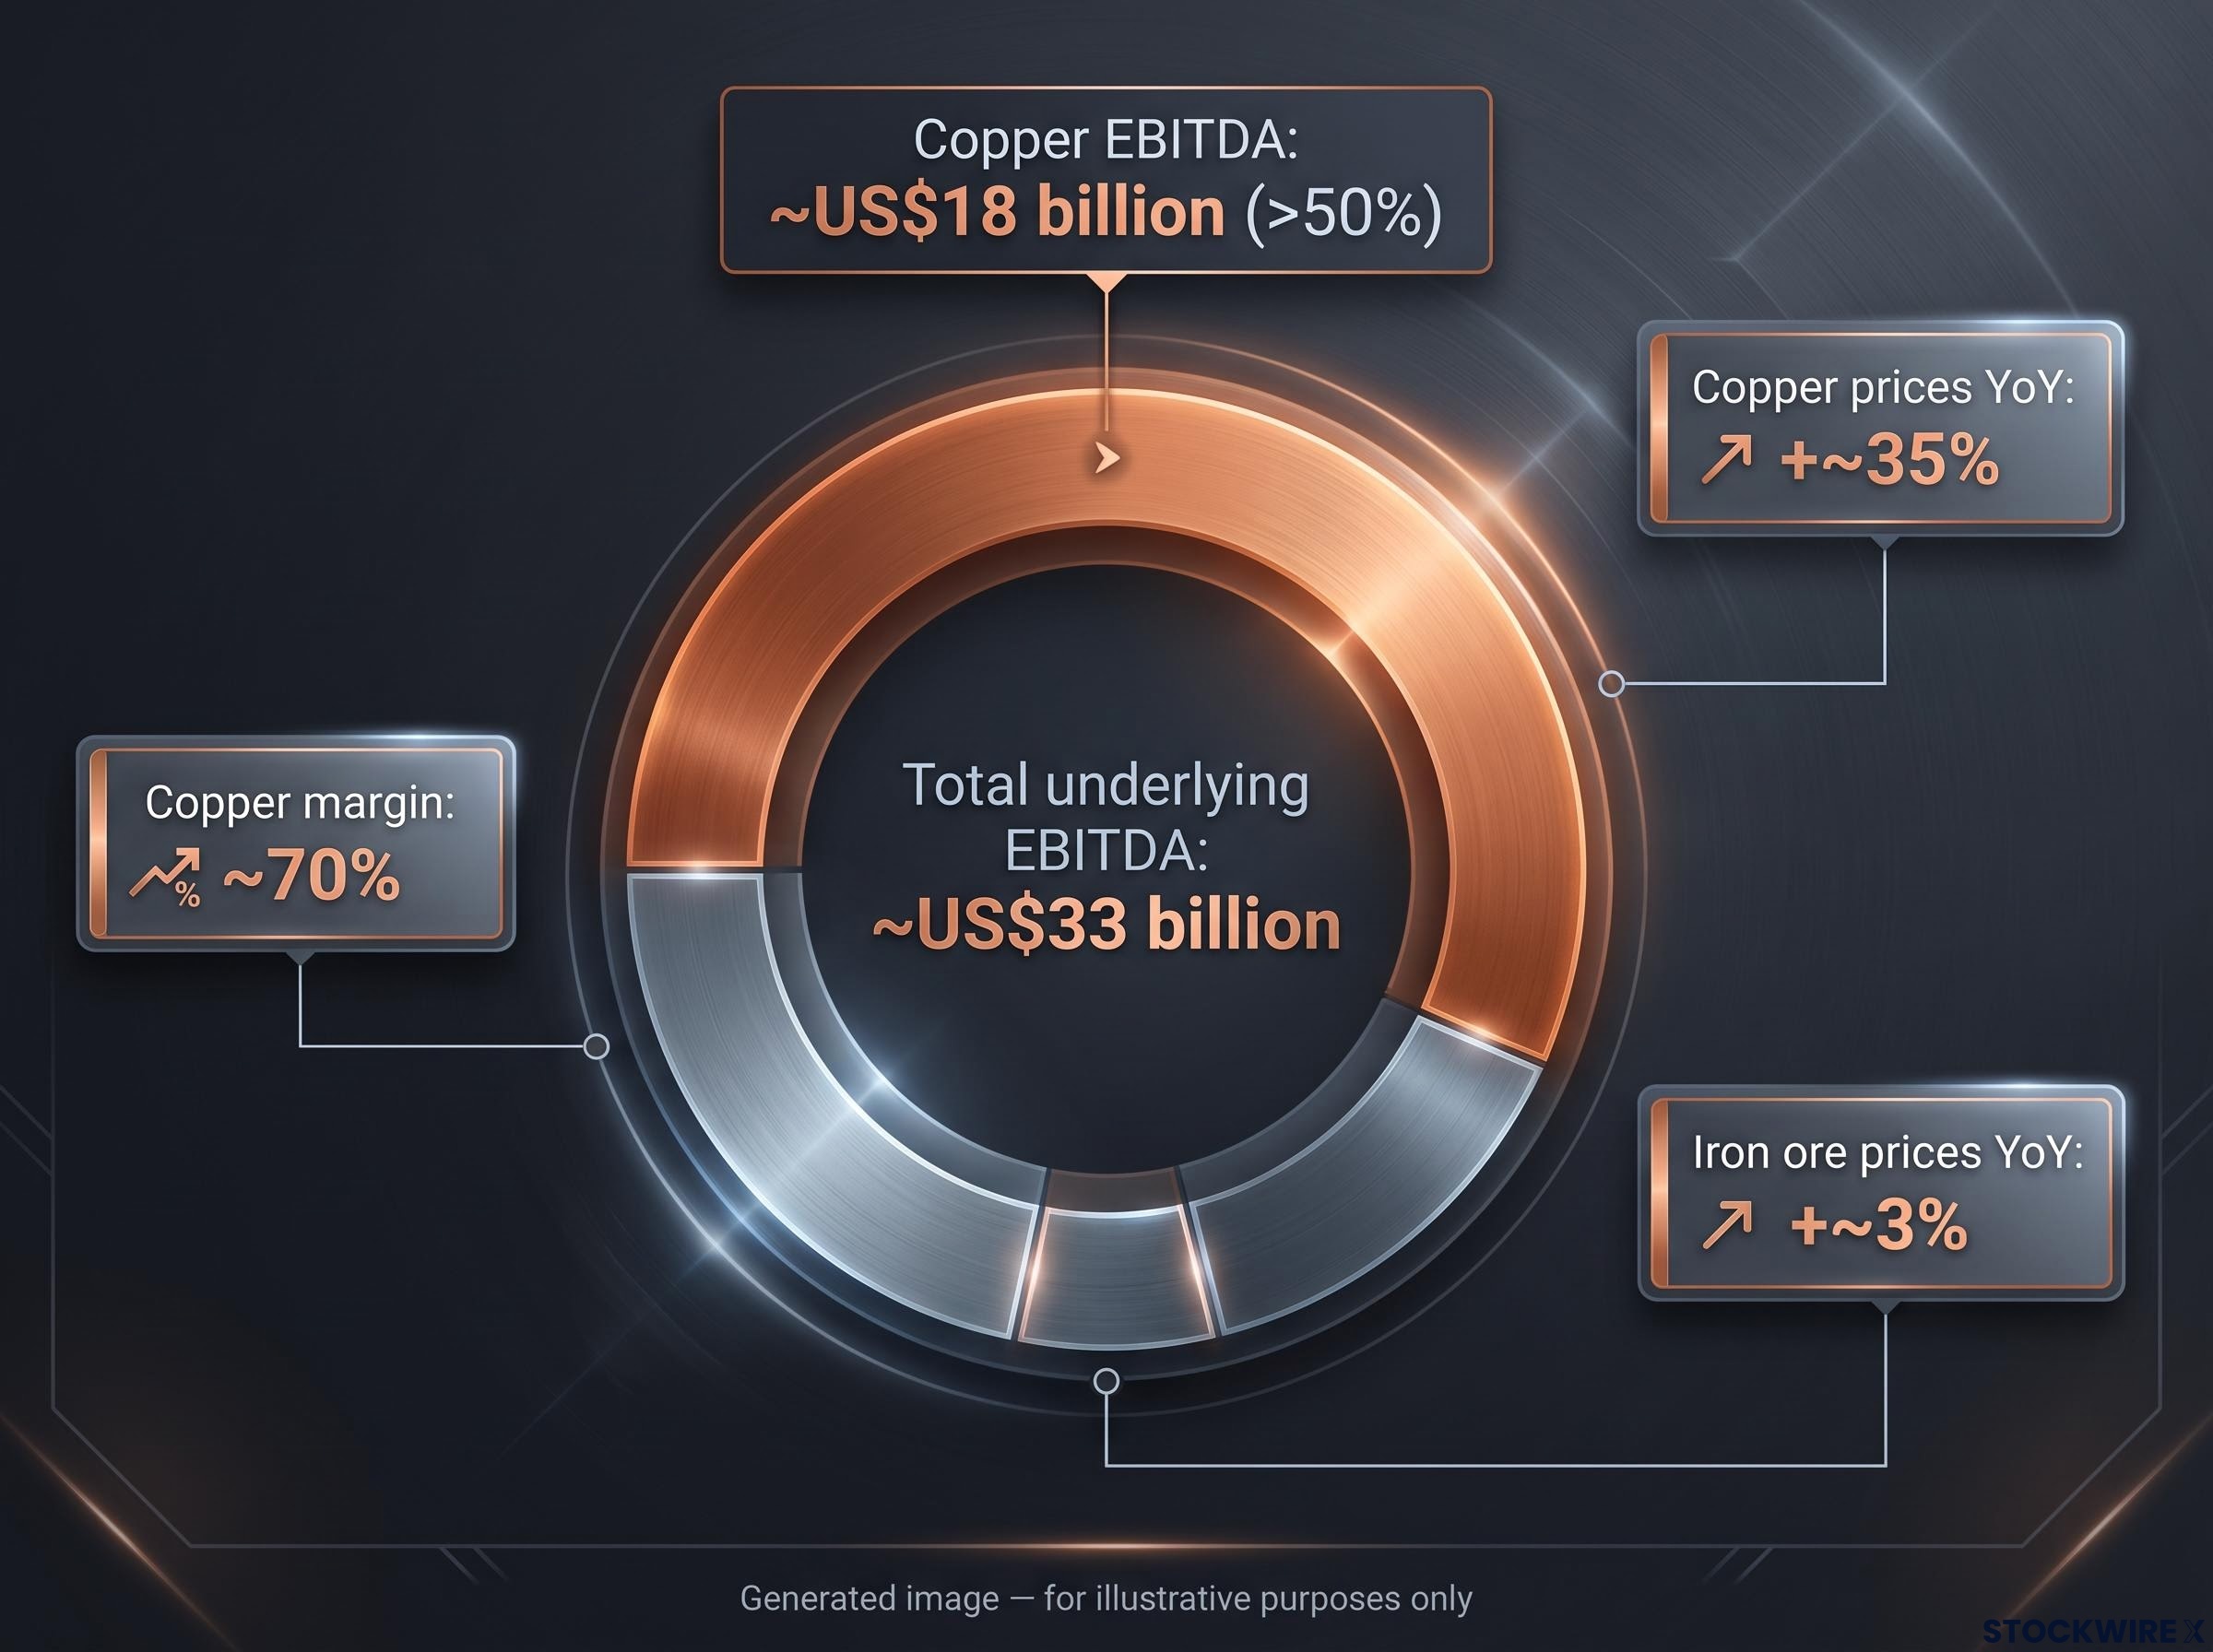
But the structural story sits beneath those figures. For the first time, copper accounted for more than half of group EBITDA, delivering approximately US$18 billion at roughly a 70% margin. Copper prices rose approximately 35% year-on-year during FY26; iron ore managed roughly 3%.
The copper supply deficit underpinning BHP’s earnings growth is not merely a cyclical uptick; UBS, Goldman Sachs, and J.P. Morgan independently project a 2026 refined market shortfall ranging from 300,000 to 600,000 tonnes, driven by simultaneous supply failures at Grasberg, Chinese sulphuric acid export restrictions, and Teck’s reduced guidance.
Copper’s share of BHP’s group EBITDA exceeded 50% for the first time, at roughly a 70% margin, a milestone that marks the company’s earnings as fundamentally linked to the global electrification and infrastructure buildout.
That milestone is not a footnote. It signals that BHP’s earnings are now as much about global electrification and infrastructure demand as they are about Chinese steel. The Jansen potash project adds a third long-duration growth leg, further diversifying the earnings base. The handover of the chief executive role from Mike Henry was completed without disruption, while the Samarco liability remains an unresolved overhang that could affect capital returns.
For investors who still think of BHP primarily as an iron ore and China play, this result resets the picture and, with it, the stock’s relevance to portfolios seeking exposure to structural global themes.
CBA’s result and the mortgage headwind investors cannot ignore
CBA’s FY26 result was genuinely solid. Cash net profit after tax rose approximately 7% to A$11.0 billion. Pre-provision profit increased roughly 6% to A$16.5 billion. Return on equity edged up to approximately 14%. The full-year dividend of A$5.05 per share (including a final dividend of A$2.70), fully franked and up approximately 4%, with a 77% payout ratio, delivered exactly what income investors expected.
Loan impairment expense rose but remained below market expectations. The franchise is performing.
What the mortgage data signals about the next 12-24 months
The forward picture is where the strain appears. Mortgage applications at CBA dropped by roughly 15%, with investor mortgage applications falling by closer to 28%, reflecting the impact of tax changes introduced in the May federal budget alongside the dampening effect of elevated rates on property investors.
| Bank | Mortgage application decline | Note |
|---|---|---|
| CBA | ~15% (investor: ~28%) | FY27 credit growth guidance trimmed to 4-5% |
| ANZ | ~12% | Best performer among majors |
| NAB | ~20% | Particularly hard hit |
The pressure on mortgage volumes is an industry-wide issue, not a CBA idiosyncrasy. Every major bank is contending with similar headwinds from a cooling housing market and a competitive mortgage environment that is compressing net interest margins. The Reserve Bank of Australia (RBA) now forecasts housing credit growth to decelerate from approximately 7.5% to approximately 2.2% over the forecast period, with investor credit projected to turn slightly negative by early 2028.
CBA management has trimmed FY27 mortgage credit growth guidance to 4-5%, down from 4-6%. A 28% drop in investor mortgage applications is not a temporary dip: it reflects a policy-driven structural shift in borrower behaviour that will pressure CBA’s primary revenue engine over the next two to three years. At 24x earnings, if growth slows to low single digits, the multiple leaves very little room for disappointment.
The divergence in housing credit forecasts across the major banks sharpens the earnings risk picture for CBA specifically; NAB projects just 2.5% system credit growth for FY27, and the convergence of CBA’s own revised guidance toward that pessimistic anchor is a directional signal that earnings models built on 5%-plus growth require re-baselining.
Dividend income: why the traditional comparison no longer holds
The assumption most investors carry into this comparison is straightforward: CBA is the income stock, BHP is for capital growth. The current data dismantles that framing.
- BHP FY26 dividend: US$1.72 per share (US$8.7 billion total), 66% payout ratio, highest in four years
- CBA FY26 dividend: A$5.05 per share, fully franked, 77% payout ratio, up ~4%
- Franking: CBA fully franked; BHP partial and variable depending on Australian-sourced profit proportion
- Income predictability: CBA lower yield but highly stable; BHP higher yield but cyclical
Because CBA’s share price embeds a valuation premium, its dividend yield is no longer dramatically higher than BHP’s on current figures. The yield gap has narrowed materially from what historical reputation suggests.
BHP’s FY26 dividend was its highest in four years, at a 66% payout ratio on significantly stronger earnings, challenging the assumption that it is only a capital-growth story.
Franking remains a genuine differentiator. CBA’s fully franked dividends are highly valuable for tax-advantaged investors, particularly self-managed super funds (SMSFs). BHP’s franking level is lower and varies with the proportion of Australian-sourced profits. For investors whose primary goal is maximising after-tax income through franking credits, CBA retains a structural advantage. For investors focused on gross yield and total cash return, BHP’s current position is at least equally compelling and arguably stronger.
Risk profiles side by side: commodity cycle versus housing cycle
The relevant question is not “which stock is riskier” but “which risk is more consistent with what you already hold.”
| Risk category | BHP | CBA |
|---|---|---|
| Cycle exposure | Global commodity prices (copper up ~35% YoY in FY26; can reverse) | Australian housing credit (investor applications down ~28%) |
| Valuation risk | ~16-17x; growth not yet priced in | ~24x; limited room for earnings disappointment |
| Regulatory / legacy | Samarco liability unresolved; potential US tariffs (15-30% on refined copper from 2027 under discussion) | Federal budget policy changes cooling investor borrowing |
| Macro sensitivity | China construction, US trade policy, global industrial demand | RBA rate path, household leverage, margin competition |
BHP’s risks are externally driven: global commodity dynamics, Chinese demand, US tariff decisions, and the Samarco legacy liability. CBA’s risks are domestically embedded: housing policy, household leverage, and margin competition across the major banks. That distinction makes them genuine diversifiers of each other rather than substitutes.
If your portfolio already holds significant bank or property exposure, adding CBA at current levels deepens that concentration. BHP at current levels reduces it.
Where to direct fresh capital heading into Q4 2026
BHP may suit you if:
- You want exposure to the global commodity and electrification cycle, particularly copper
- You are comfortable with earnings and share-price volatility tied to commodity prices
- You value strong current cash generation, rising dividends, and identifiable long-term growth projects (Jansen potash)
- You are seeking diversification away from domestic financials and the Australian housing cycle
- You see a 16-17x multiple on ~30% earnings growth as an attractive entry point
CBA may suit you if:
- You prioritise earnings predictability, capital strength, and fully franked income from a core Australian bank
- You prefer lower fundamental volatility even at the cost of a valuation premium
- Your portfolio is already heavily exposed to resources and you need financials to balance sector risk
- You have a strong focus on franking credits and long-term bank income, particularly within an SMSF structure
Holding both makes sense if:
- Your portfolio is large enough to build a diversified ASX core across sectors
- You want to pair cyclical upside in resources with the defensive characteristics of a major bank
- You prefer not to make a binary call on either the commodity or housing cycle
An investor adding fresh capital to CBA at current prices is buying earnings predictability at a price that assumes that predictability will continue, precisely when the mortgage data and RBA forecasts suggest it is under the most structural pressure in several years.
Which stock earns the next dollar of Australian investor capital
For fresh capital in Q4 2026, BHP is the more compelling value proposition. Earnings are growing at roughly 30%, copper has crossed above half of group EBITDA at 70% margins, leverage sits at 0.3x, and dividends are at a four-year high. All of that at a 16-17x multiple. CBA remains a high-quality, income-oriented cornerstone, but at 24x earnings with mortgage applications declining and credit growth guidance trimming, the risk-reward for new money is less favourable.
What would change this view: a material de-rating of CBA toward more reasonable multiples, or a sharp reversal in copper prices that undermined BHP’s earnings trajectory. Either would shift the calculus.
For large enough portfolios, holding both remains a sound structural choice; these stocks serve different functions. The pragmatic tilt, however, favours BHP for incremental capital, while retaining CBA where it already sits, without adding materially at current prices.
This article is for informational purposes only and should not be considered financial advice. Investors should conduct their own research and consult with financial professionals before making investment decisions. Past performance does not guarantee future results. Financial projections are subject to market conditions and various risk factors.