May 2026 Jobs Report: How the World Cup Skewed the Numbers
1 hr ago
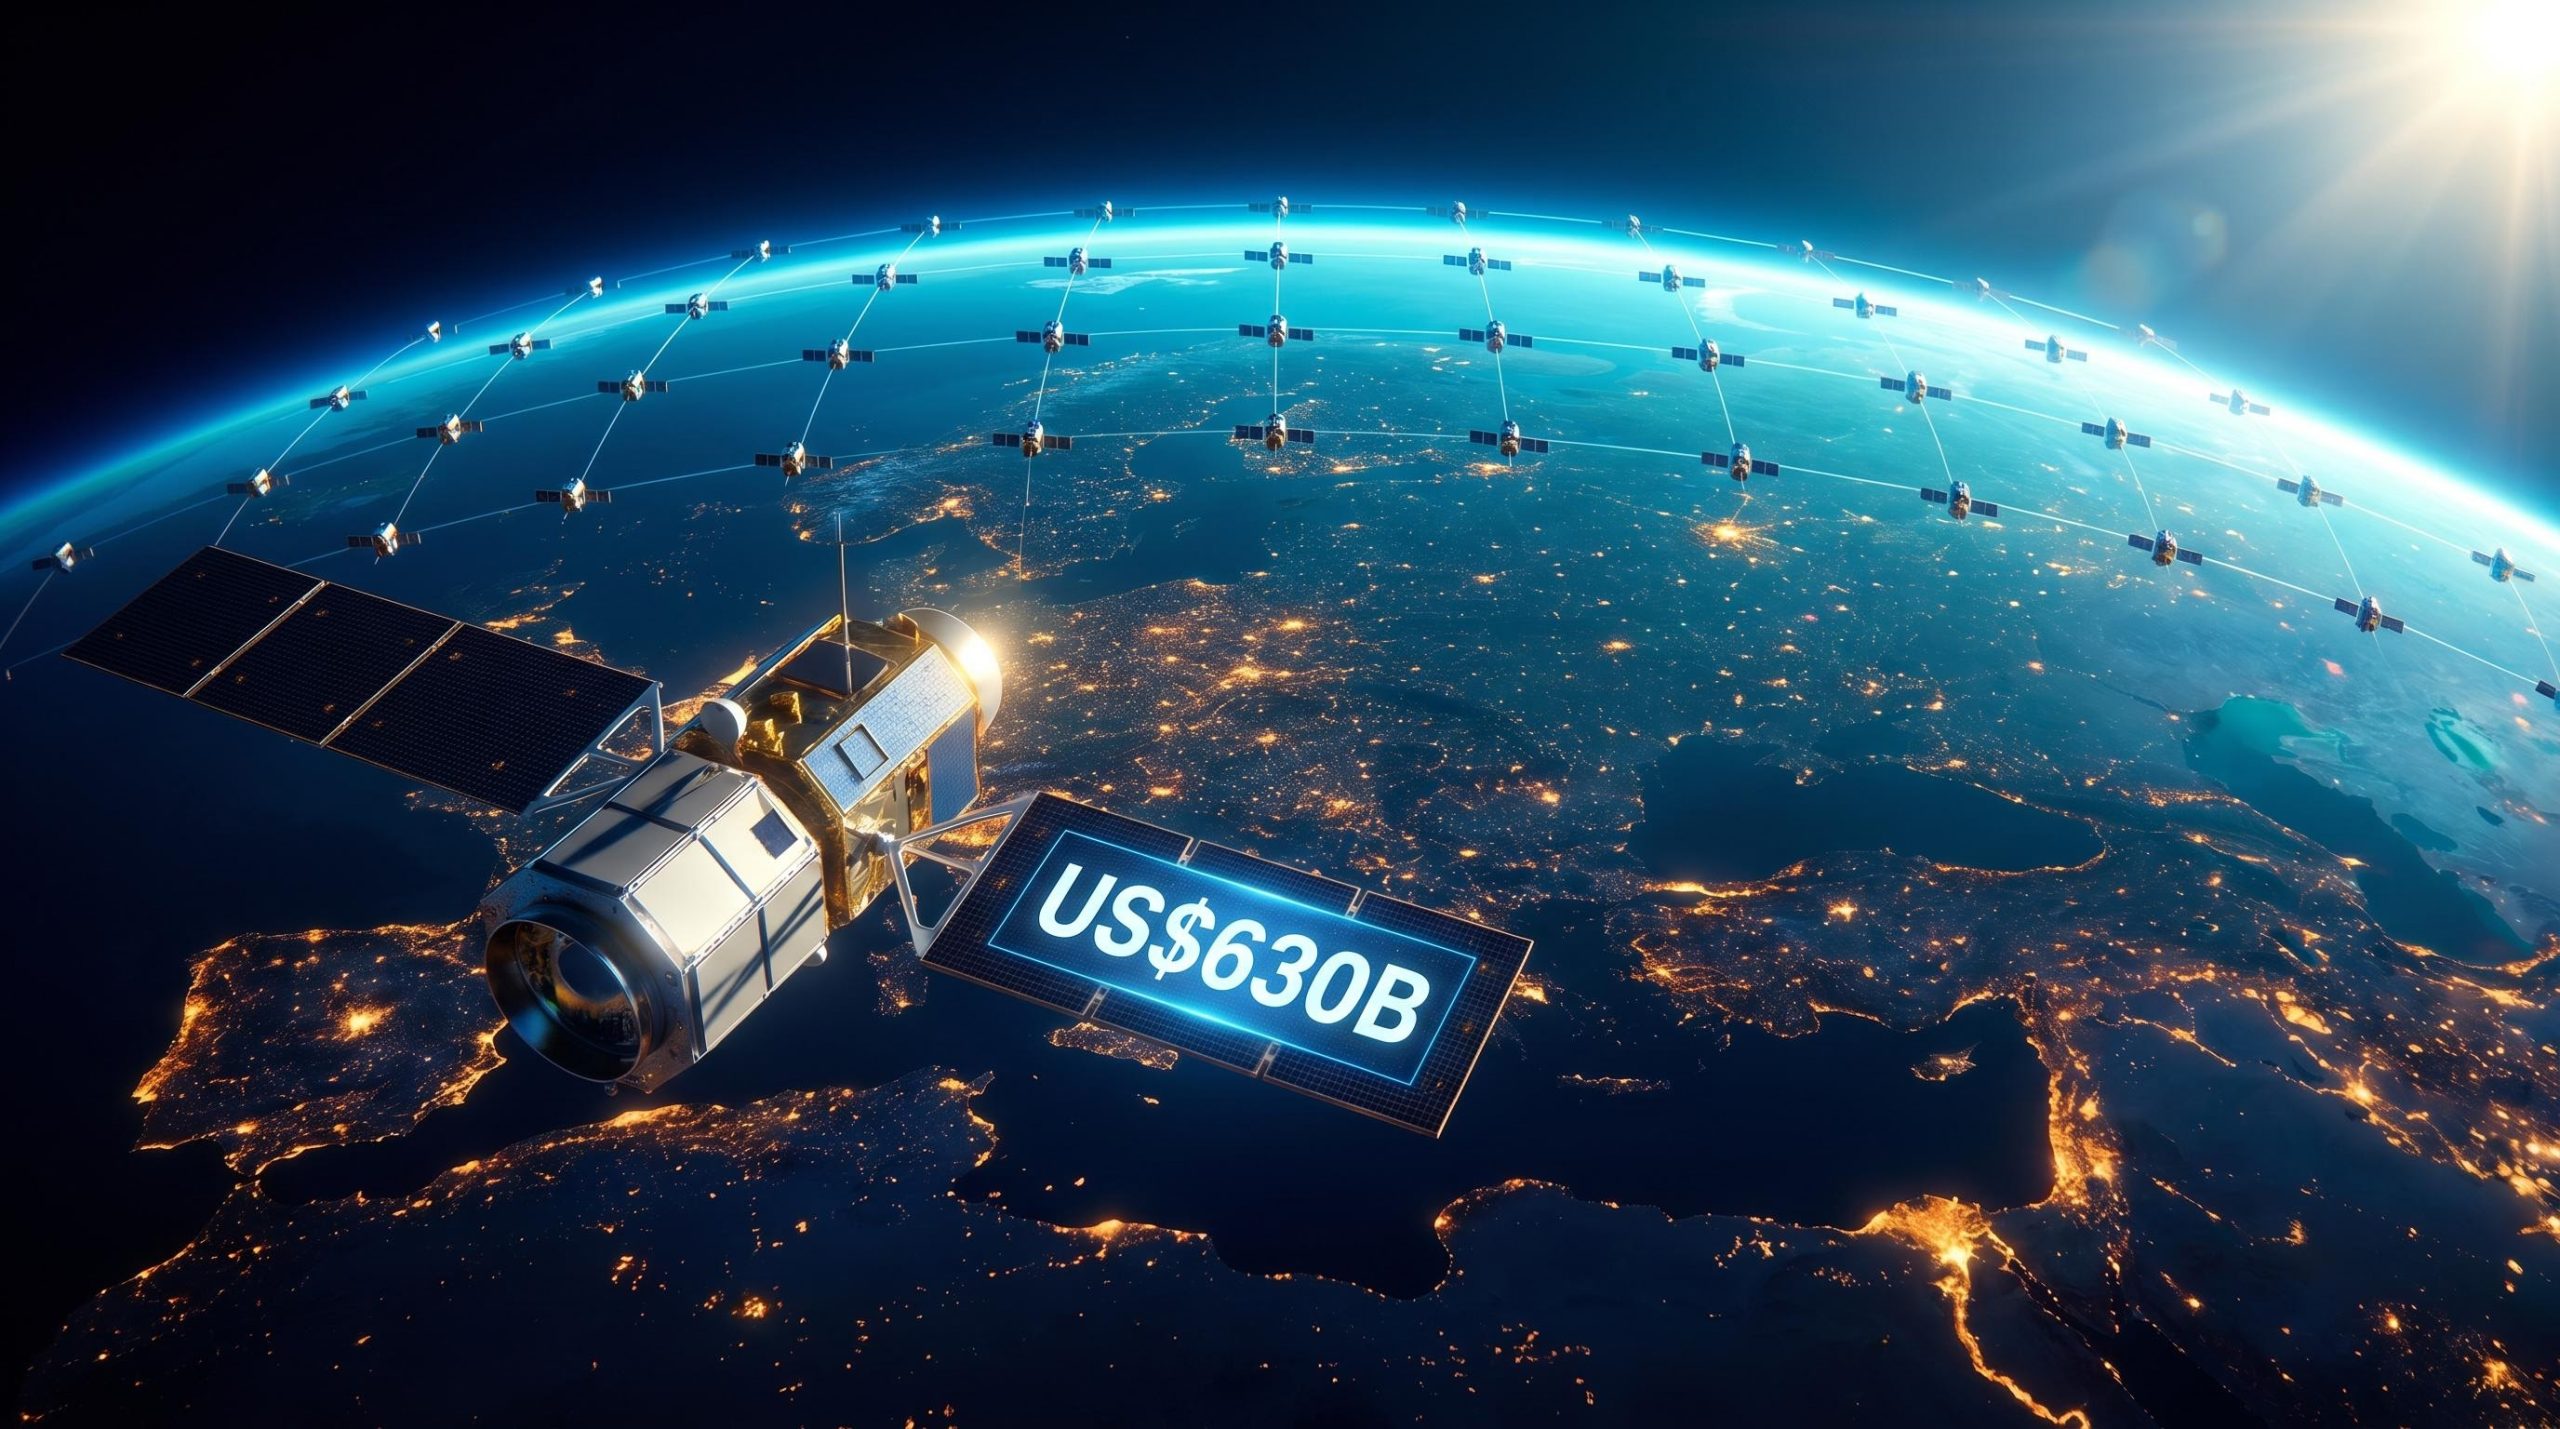
The global space economy is worth roughly US$630 billion as of 2023, and approximately 80% of that revenue is generated commercially rather than by government programmes. This is not a projection. It is the current baseline.
For most of its history, the space sector ran on government budgets, national prestige, and engineering ambition. That model is giving way to something structurally different: satellite networks that charge monthly subscriptions, data platforms that sell analytics to hedge funds and insurance companies, and launch providers that have industrialised access to orbit. The shift changes who captures the value, how that value compounds, and what investors should be evaluating. This article maps the structural transformation underway, explains the four recurring-revenue pillars that will carry the industry past US$1 trillion, identifies the companies positioned at each stage of the value chain, and examines what the commercial space economy investment thesis looks like for US-focused investors in 2026.
The old model was singular and government-led: design a rocket, win a budget allocation, launch once, celebrate the achievement. The new model is commercial and repeating: deploy orbital assets, connect paying customers, and bill them monthly. That transition is not on the horizon. It is already the dominant reality.
The numbers make the case quickly:
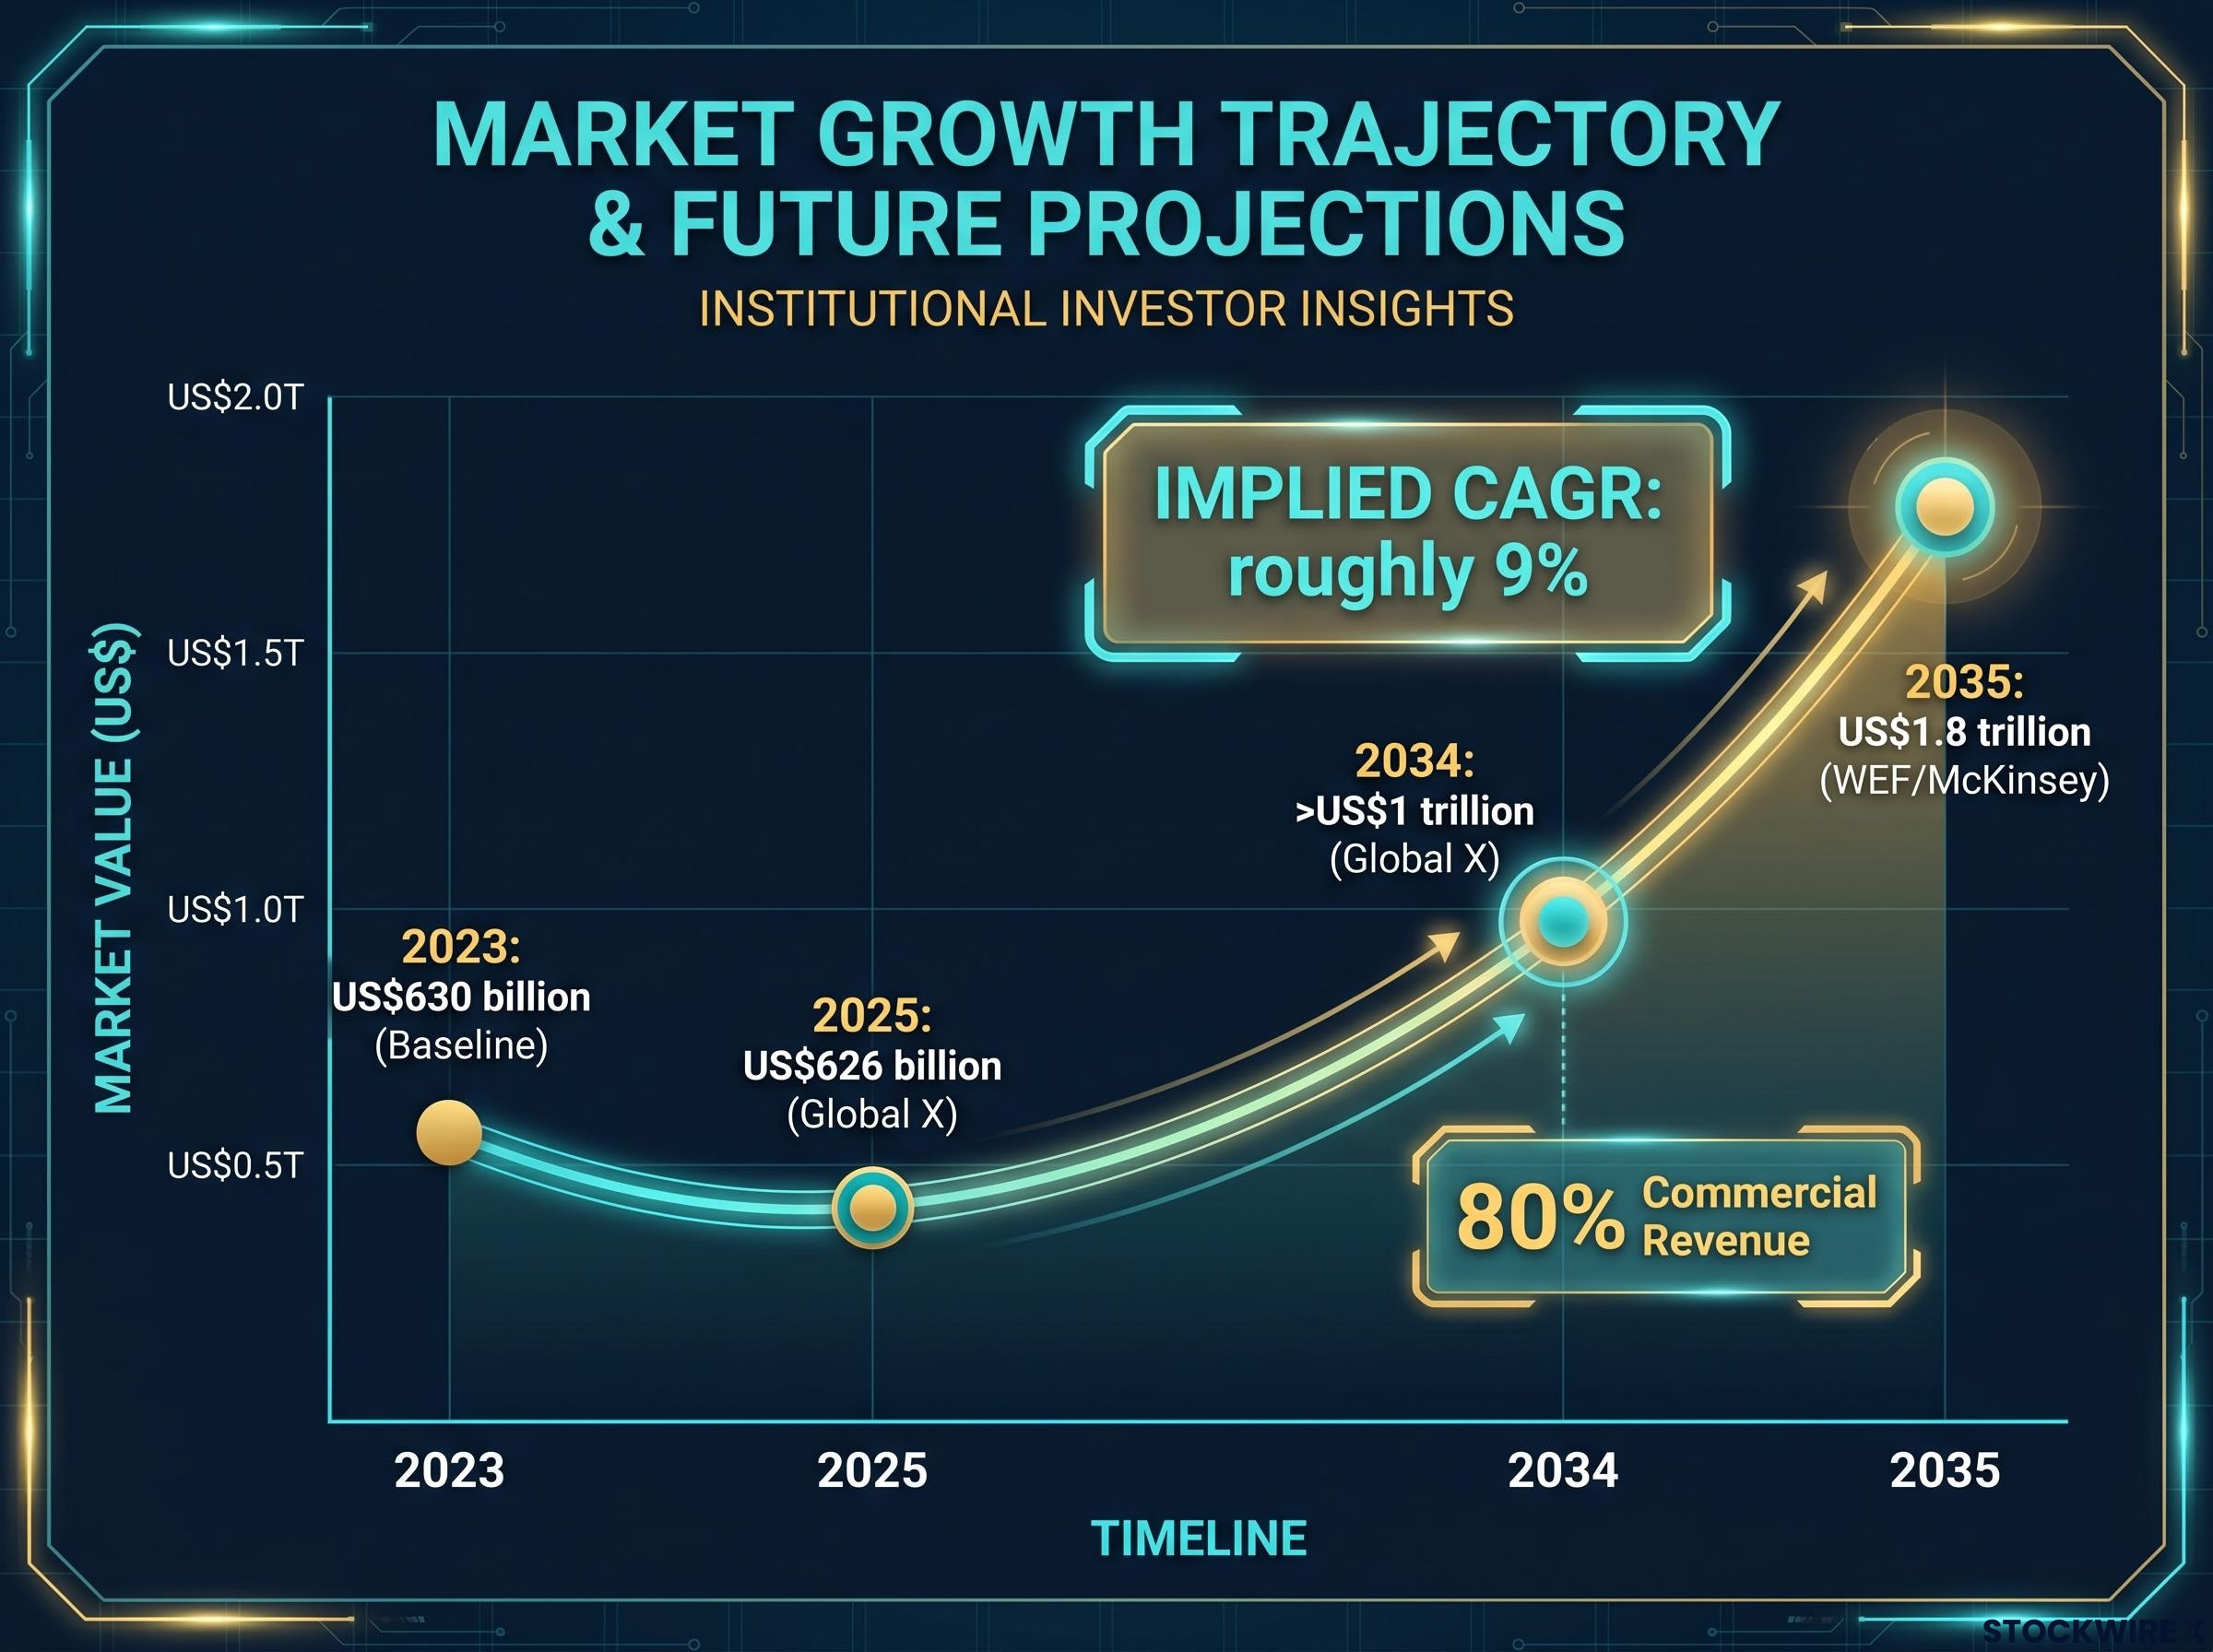
The McKinsey space economy projections place the sector at US$1.8 trillion by 2035, up from a US$630 billion baseline in 2023, a growth trajectory that underpins the infrastructure-like framing applied to commercial space investments throughout this analysis.
80% of current space revenues are already commercial rather than government-driven. That single figure reframes the sector from “emerging frontier” to “scaling infrastructure business.”
At a 9% compound annual growth rate, the space economy is growing at roughly twice the pace of the global economy. The trillion-dollar threshold is not an aspiration. It is the baseline scenario within the next decade, with the upside path approaching US$1.8 trillion by 2035. For investors, this recalibrates the sector from speculative science project to infrastructure growth story, which matters directly for how exposure is sized and categorised.
Launch costs have fallen roughly tenfold over approximately 20 years, driven primarily by reusable launch vehicles. The operational consequence is visible in sheer volume: 2,664 objects were launched in 2023, compared with fewer than 170 per year before 2012.
On the satellite side, a parallel cost collapse was underway. Miniaturisation and off-the-shelf components reduced both build times and upfront capital requirements.
This cost-curve argument is what makes the trillion-dollar projections structurally credible rather than promotional. Cheaper access to orbit is not a one-off event; it is a compounding force that continues to unlock new business models.
The space economy’s recurring revenue concentrates in four distinct pillars. Each has a different customer base, a different revenue mechanic, and a different set of public companies positioned to capture value.
According to the OECD, satellite systems now support more than half of critical infrastructure and services in member countries, from transport and energy to food supply and law enforcement. Space-based services are no longer supplementary; they are embedded in the systems that economies depend on.
| Pillar | Core Revenue Mechanic | Key Customers | Representative Public Companies |
|---|---|---|---|
| Broadband Connectivity | Subscription (household, enterprise, aviation/maritime) | Consumers, airlines, shipping, governments | SpaceX/Starlink, Iridium (IRDM), Viasat (VSAT) |
| Navigation & Positioning | Precision services, software licensing, hardware plus services | Agriculture, construction, logistics, autonomous vehicles | Trimble (TRMB), Hexagon |
| Earth Observation & Geospatial Intelligence | Data-as-a-service (imagery subscriptions, analytics APIs) | Insurance, finance, agriculture, government, ESG analytics | Planet Labs (PL), Spire Global (SPIR), ICEYE |
| Defence & Security Data Services | Government contracts (multi-year, subscription intelligence feeds) | Defence and intelligence agencies | L3Harris (LHX), Northrop Grumman, Raytheon/RTX |
Space-based observations also provide over half of the key climate variables used in climate monitoring, embedding satellite data into environmental policy, insurance underwriting, and risk management. Institutional space budgets (civil plus defence) reached a record approximately EUR 106 billion in 2023, up 11% year-on-year, with defence as the primary growth driver.
SpaceX business model segments illustrate the multi-pillar structure at its most advanced stage: launch services operating as a mature industrial business, Starlink running at recurring-revenue scale, and earlier-stage bets on Direct-to-Cell infrastructure and orbital compute each sitting at different points on the build-out-to-operations curve the current article describes.
Across all four pillars, subscription and data-as-a-service models dominate recurring revenues. That financial characteristic is what justifies infrastructure-like valuation frameworks rather than aerospace-project multiples.
The most important analytical distinction in space investing is not which pillar a company occupies. It is whether that company has crossed the line from building its constellation to operating it.
During the build-out phase, cash flows are lumpy, capital requirements are heavy, and technical risk is high. A single launch failure or satellite anomaly can set timelines back by quarters. During the operational phase, the economics invert: each incremental subscriber arrives at high gross margins, switching costs lock customers in, and the asset base (satellites already in orbit) is largely paid for.
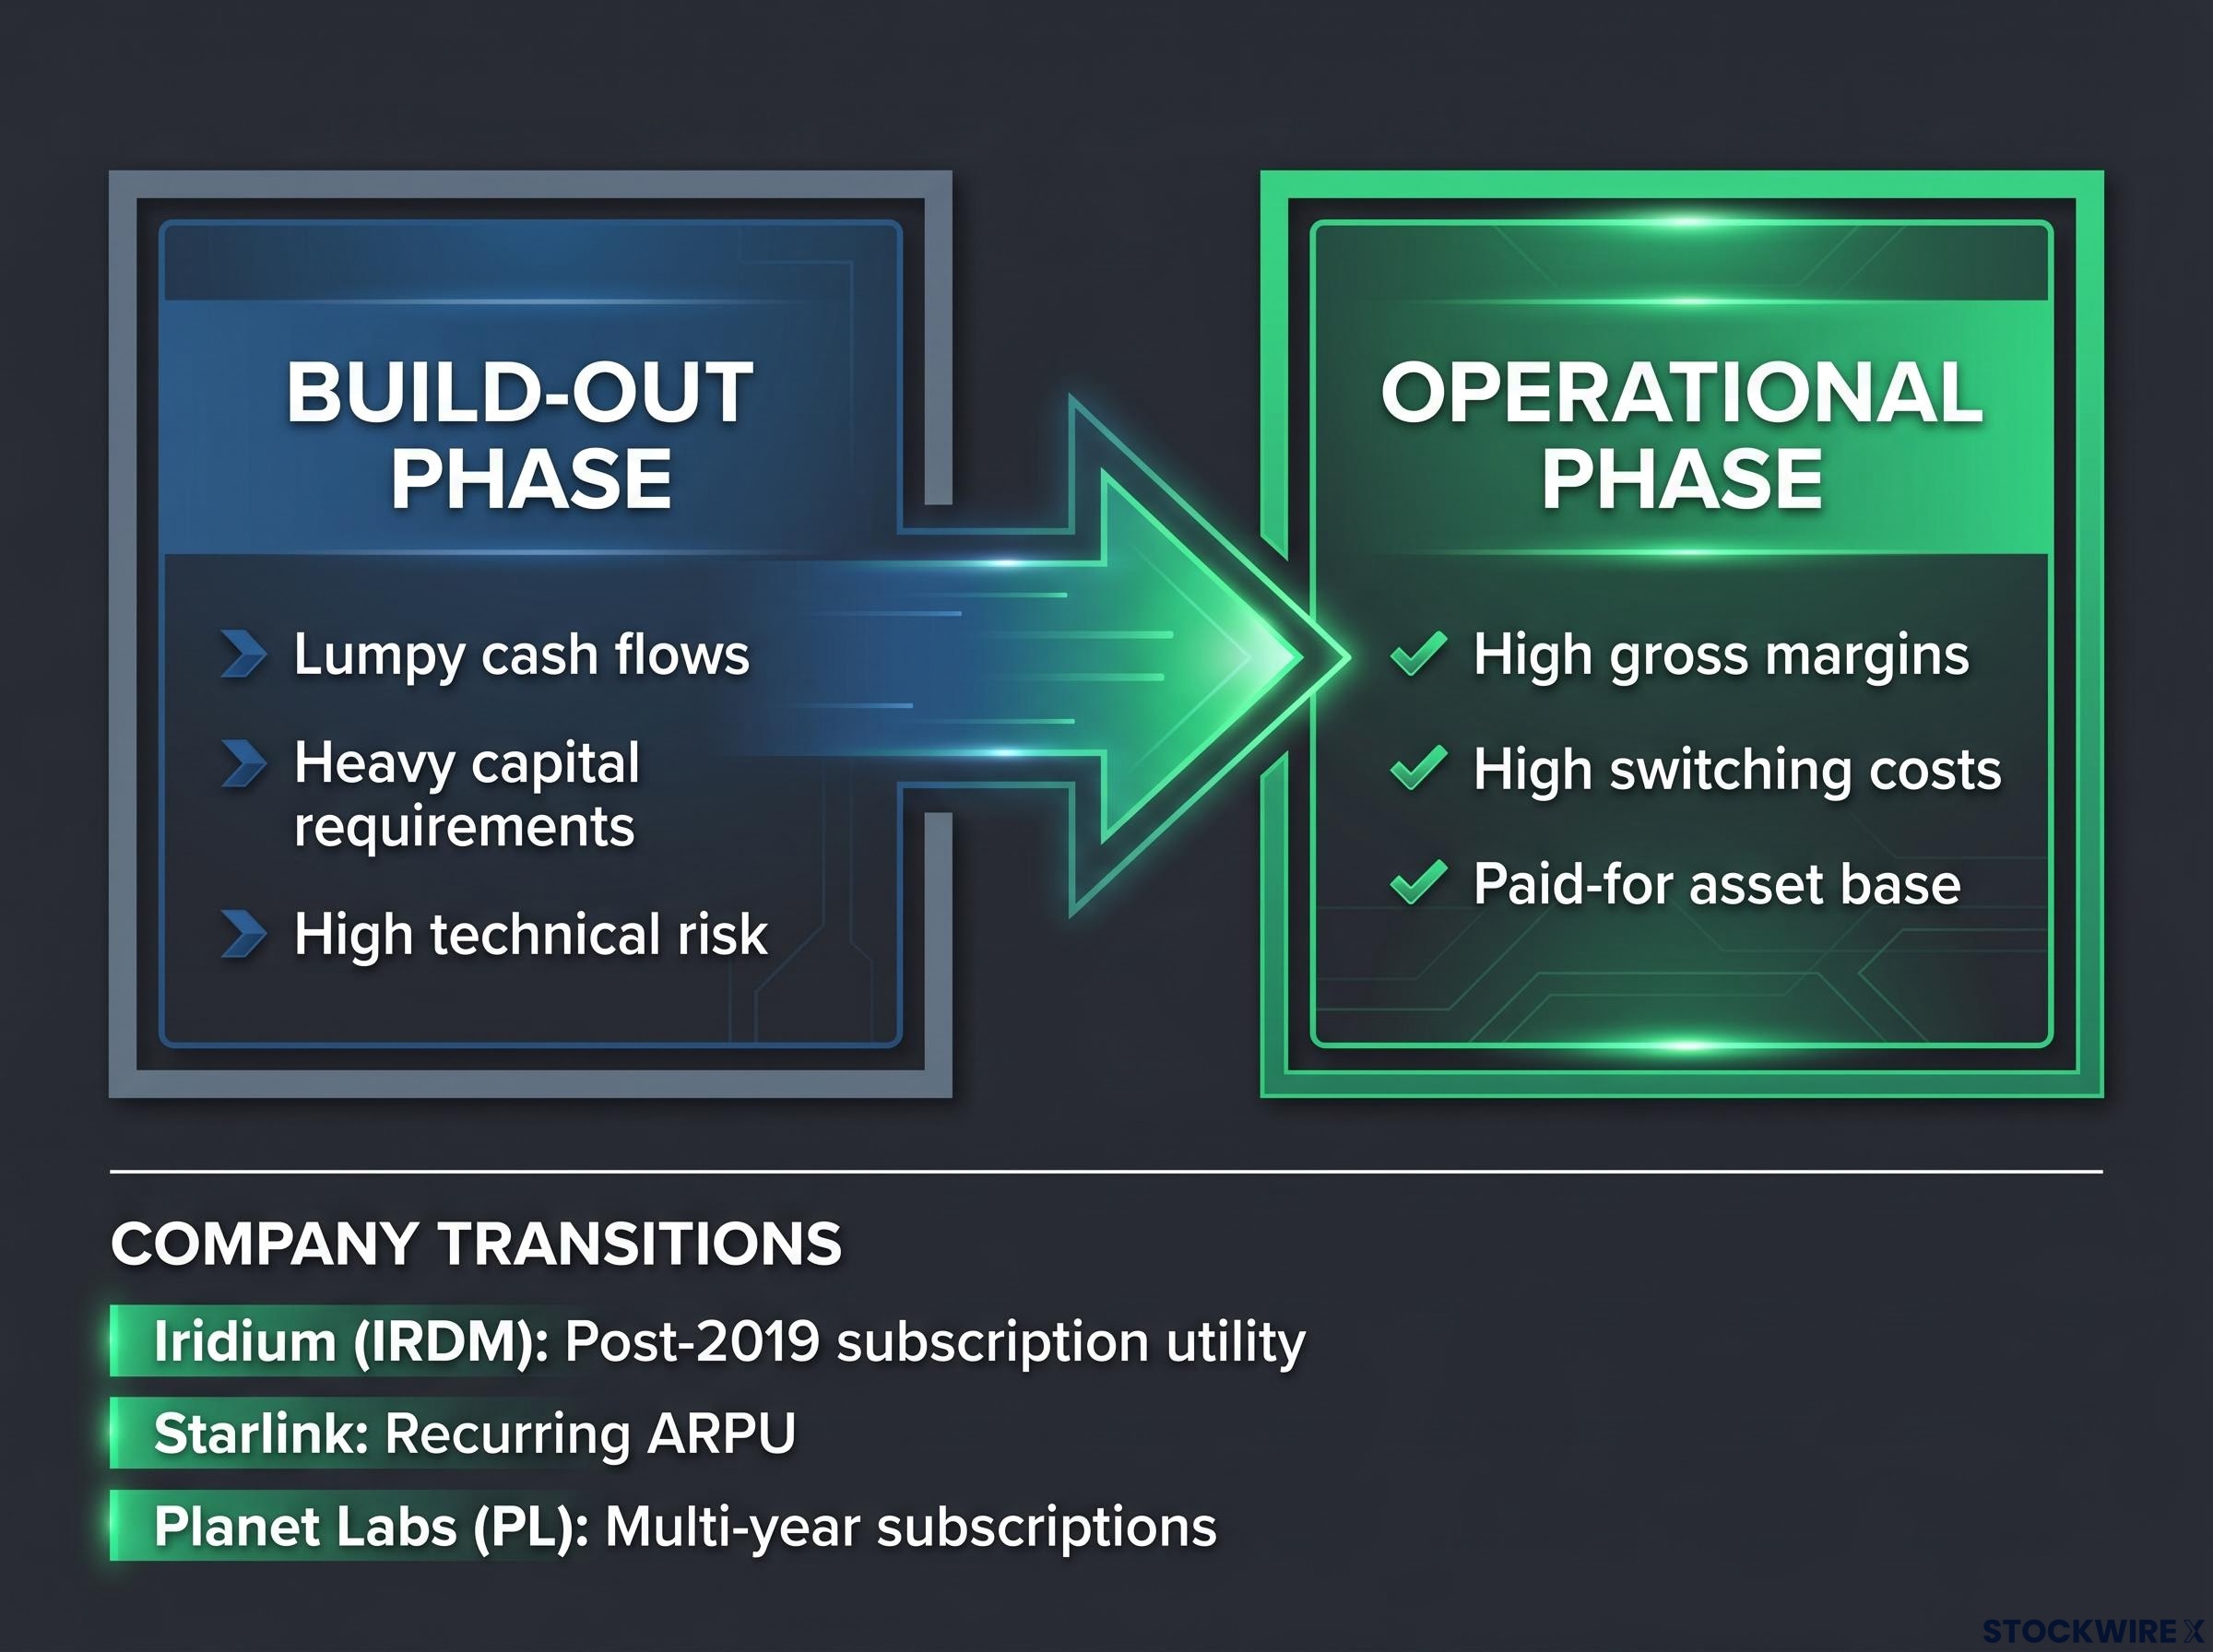
Iridium Communications provides the clearest public example. After completing its NEXT constellation refresh in 2019, the company’s business shifted to a subscription-heavy, high-margin services model with relatively stable capital expenditure. The transformation from capital-intensive builder to recurring-revenue utility happened within a few years of the constellation reaching full operational capability.
The same pattern is repeating across different business models:
Starlink subscriber economics provide the clearest live test of the high-margin subscription model the article describes: with approximately 10.3 million subscribers and an estimated 69% share of SpaceX’s quarterly revenue, the broadband segment has already crossed the build-out-to-operations inflection while AI infrastructure and orbital compute segments remain firmly in capital-intensive pre-revenue territory.
Once satellite data feeds or connectivity services are integrated into a customer’s core operations, the cost of switching providers becomes significant. A logistics company routing fleets through GNSS-enabled software or an insurer underwriting crop risk using satellite imagery cannot easily swap providers mid-contract. These switching costs are structurally similar to those in telecom networks or cloud infrastructure, and they are what make the recurring revenue durable rather than merely repeating.
Identifying firms that have crossed or are approaching this inflection point is the primary analytical task for investors in the sector.
The macro thesis is compelling: 9% CAGR, a US$1 trillion market by 2034, and structural demand across connectivity, navigation, observation, and defence. Individual company outcomes, however, may diverge sharply from that aggregate trajectory.
Four categories of company-level risk can decouple stock performance from sector growth:
The macro thesis and company-level caution are not contradictory. Forecasts suggest the sector will grow to US$1 trillion or more, but a significant share of that value may concentrate in a handful of winners. The gap between the sector’s trajectory and individual stock outcomes is where risk lives.
For that reason, many investors use diversified vehicles, whether broad aerospace and defence funds or thematic space ETFs, to gain exposure to the overall commercial space theme without depending on any single company, launch event, or technological development. The structural response to concentrated-winner dynamics is breadth, not conviction in a single name.
The space sector repricing that followed SpaceX’s June 2026 listing demonstrated the concentrated-winner risk in practice: companies carrying price-to-sales multiples above 100x faced immediate structural pressure once a live benchmark with superior scale and revenue diversification began trading publicly.
The analytical thread runs in a straight line. Falling costs unlocked viable business models. Viable business models are generating recurring revenues. Recurring revenues on orbital infrastructure compound in ways that resemble telecom and cloud more than aerospace projects.
Two filters matter most for investors evaluating companies in this space going forward:
The four-pillar framework (connectivity, navigation, Earth observation, defence) provides the lens for categorising both new entrants and established players. The United States remains the dominant hub for commercial space investment, regulatory innovation through the FCC and NASA’s commercial programmes, and publicly listed pure-play companies. That concentrates both opportunity and risk for US-based investors.
The US$1 trillion threshold by 2034 is the baseline scenario. The US$1.8 trillion upside by 2035 is plausible if adoption curves in LEO broadband, autonomous navigation, and defence intelligence procurement continue at current rates. The investment question is no longer whether the commercial space economy reaches scale. It is which companies will capture the margins when it does.
For investors who have absorbed the two-filter framework and want to apply it to specific names, our deep-dive into public space stocks with documented one-year returns of 271% to over 1,000% examines which of those gains rest on verifiable revenue foundations, such as Rocket Lab’s US$602 million Q4 2025 figure, and which are driven primarily by sector sentiment rather than operational inflection.
This article is for informational purposes only and should not be considered financial advice. Investors should conduct their own research and consult with financial professionals before making investment decisions. Past performance does not guarantee future results. Financial projections are subject to market conditions and various risk factors.
The commercial space economy refers to the private-sector portion of the global space industry, encompassing satellite broadband, navigation services, Earth observation data, and defence contracts. As of 2023, the total global space economy was valued at approximately US$630 billion, with around 80% of that revenue generated by commercial activity rather than government programmes.
The four core revenue pillars are broadband connectivity (subscription-based satellite internet), navigation and positioning services (precision software and hardware for agriculture, logistics, and autonomous vehicles), Earth observation and geospatial intelligence (data-as-a-service imagery and analytics), and defence and security data services (multi-year government intelligence contracts).
Launch costs have fallen roughly tenfold over approximately 20 years, driven by reusable rocket technology from companies like SpaceX and Rocket Lab. This cost collapse is what made dense satellite constellations, recurring-revenue business models, and the trillion-dollar growth projections structurally credible rather than speculative.
The inflection point is when a space company transitions from capital-intensive constellation building to operating a deployed asset base with high-margin recurring revenues. Iridium Communications is the clearest public example, having completed its NEXT constellation in 2019 and subsequently shifting to a stable subscription-based utility model.
Key risks include technology and execution failures such as launch anomalies, fast-changing competitive dynamics as new entrants lower costs, long cash-flow timelines as build-out phases extend, and concentrated winner dynamics where a small number of scaled firms capture most of the economic surplus while others fail to reach sustainable scale.