
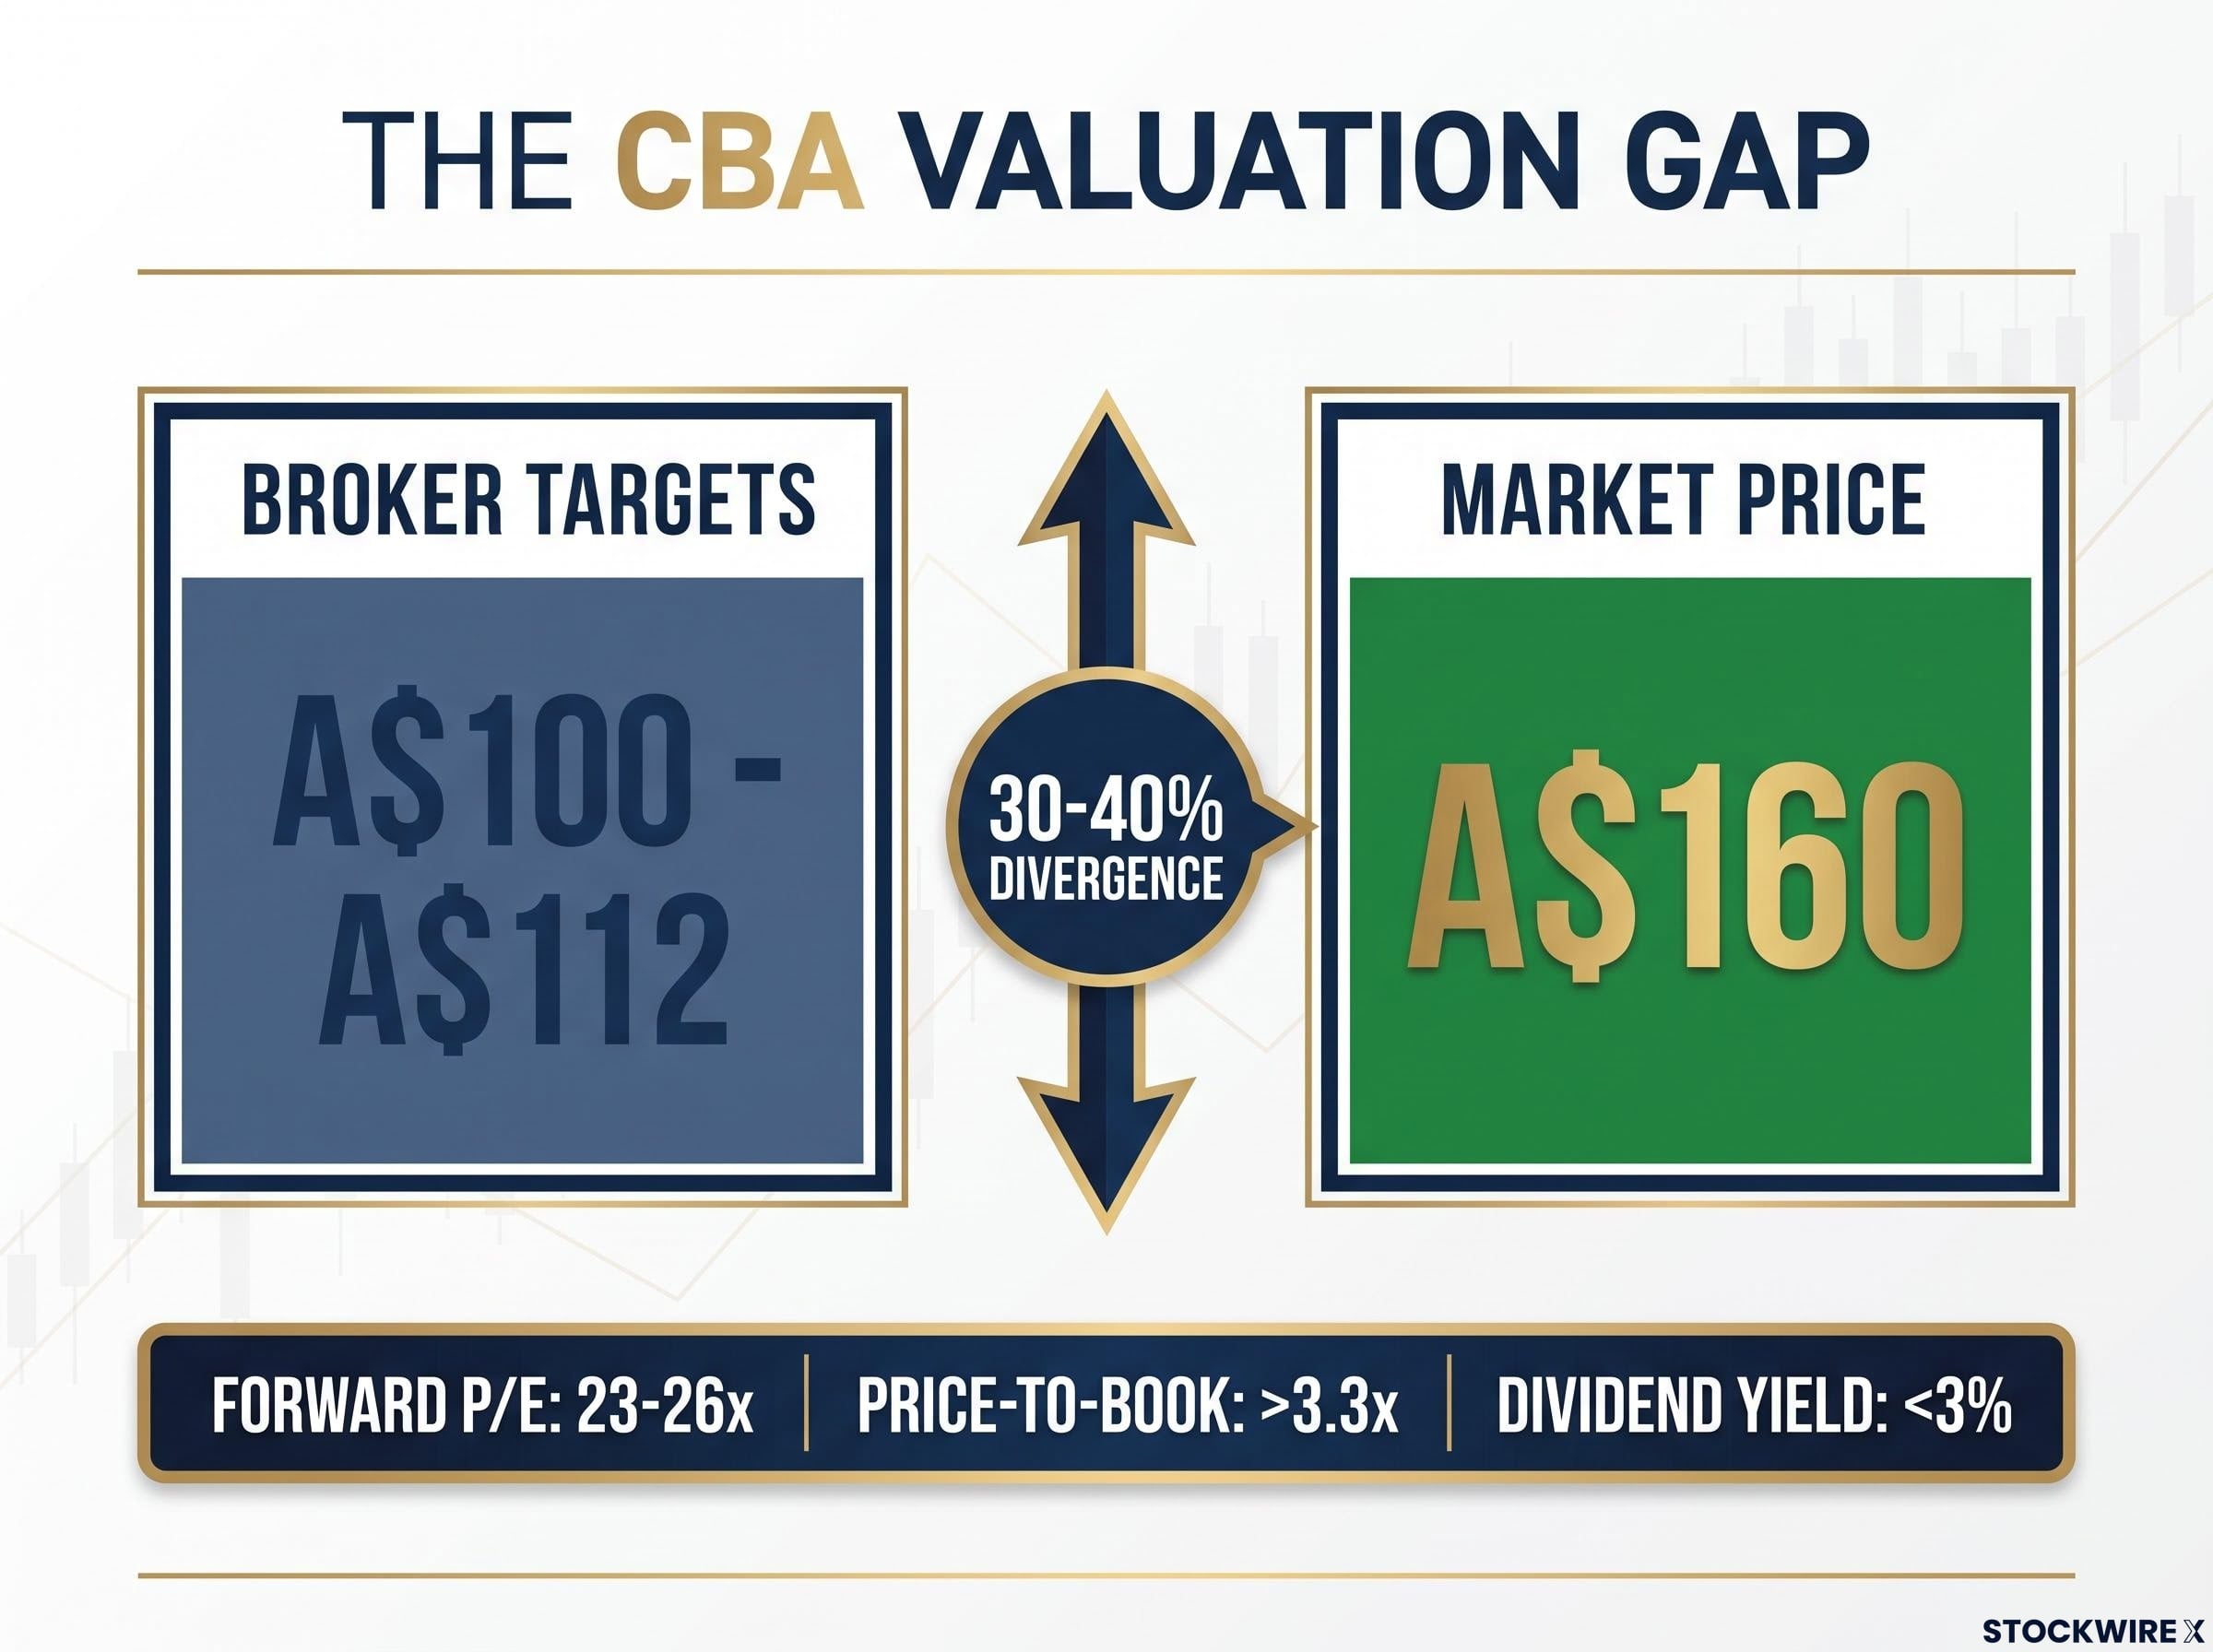
Analyst sentiment has long flagged Commonwealth Bank of Australia as overvalued, with price targets persistently anchored well below market prices. Those targets have clustered around A$100-A$112, while the stock has continued to trade in the vicinity of A$160. The bear case has been internally consistent and analytically sound, yet investors who acted on it have watched the stock shrug off their concerns and continue higher, leaving substantial gains uncaptured.
But the combination of headwinds now visible in the data looks different to what came before. May 2026 federal budget changes have produced a measurable 15% decline in CBA’s mortgage application volumes. Conforming 30+ day arrears have reached their highest level in over a decade. The dollar value of mortgages in serious delinquency is rising fastest in the exact markets and loan sizes where CBA’s book is most concentrated. This is not a theoretical valuation complaint. It is observable deterioration in the bank’s core business.
What this piece does is separate what CBA genuinely does well, and it does a lot well, from what the current share price requires you to believe about the next 12-24 months of housing and credit data. That distinction is where the practical investment decision lives.
The stock that made the bears look foolish, year after year
The gap between what analysts say CBA is worth and what the market pays for it is not a rounding error. It is a structural feature of this stock that has persisted for years.
The valuation gap in one line: Bearish broker price targets have long hovered near A$112, yet CBA has continued trading around A$160. That spread is not a minor modelling disagreement. It represents a 30-40% divergence between fundamental analysis and where the market consistently clears.
On every conventional measure, the bear case looks airtight:
- Forward P/E: approximately 23-26x, far above domestic and global banking peers
- Price-to-book: above 3.3x, roughly double other Australian major banks
- Dividend yield: sitting under 3%, a notably thin income return for a stock long regarded as a cornerstone holding for yield-seeking investors
Those numbers have been roughly this stretched for some time. And the stock has kept climbing, or at best pulling back modestly before resuming. Investors who sold on valuation grounds in 2024 or 2025 missed further upside. The models were internally consistent. The market simply did not care.
Two standard valuation models place fair value estimates for CBA between $98 and $143, with the gap to the $160-plus market price reflecting qualitative franchise factors that quantitative frameworks cannot easily capture, a divergence that defines the analytical challenge rather than resolving it.
That pattern is what makes August 2026 interesting. The question is no longer whether CBA is expensive; it always has been. The question is whether the housing credit deterioration now confirmed in the data is the catalyst that finally closes the gap, or whether the same structural forces will absorb this pressure too. Understanding why the bear case has failed before is the prerequisite for judging whether it will fail again.
When big ASX news breaks, our subscribers know first
What CBA’s record profits actually tell you about the franchise
Before interrogating the risks, it is worth being honest about what CBA has built. Record annual cash profit of A$10.98 billion is not a number that happens by accident or by favourable conditions alone.
CBA’s dominance sits on a combination of structural advantages that peers have struggled to replicate: the largest retail banking franchise in Australia, a digital platform that consistently captures a disproportionate share of new customer flows, a deep and stable funding base, and capital ratios that give management room to absorb shocks without cutting dividends or retreating from growth investments.
Why the franchise quality matters for the valuation debate
The mortgage book tends to be more prime-weighted than peers, and CBA’s arrears metrics have generally run below sector averages. When comparing how lenders fared following the May 2026 policy changes, CBA’s mortgage application volumes fell by around 15%, which held up better than one peer whose volumes dropped by roughly 20%, even if another recorded a somewhat smaller decline of approximately 12%.
This is why the price-to-book above 3.3x is not simply a sign of froth. It partially reflects genuine franchise quality. Even analysts who maintain bearish price targets typically acknowledge that if any Australian bank deserves a premium, it is CBA. The debate is about how much premium, not whether one is warranted.
The record profit tells you the engine is running well. It does not, on its own, tell you whether the price you pay today appropriately reflects what that engine is worth under deteriorating conditions. Those are different questions, and treating them as the same one is where both bulls and bears tend to go wrong.
How passive superannuation flows rewrote the valuation rulebook for CBA
The single biggest reason bearish price targets have repeatedly misfired is a structural feature of the Australian market that conventional valuation models were never built to capture.
Here is how it works:
- Compulsory superannuation contributions flow steadily into retirement savings accounts across the Australian workforce, a legislated and growing stream of capital.
- A significant portion of that capital enters index-tracking funds that must hold each ASX 200 constituent in proportion to its weighting. CBA carries one of the largest weightings in the index.
- These funds buy CBA regardless of its P/E, P/B, or dividend yield. The buying is valuation-insensitive by design, creating a structural bid that acts as an ongoing price floor beneath the stock.
This mechanism is not captured in standard discounted cash flow or price-to-earnings frameworks. Those models are calibrated on markets where buying and selling decisions respond to valuation signals. In a market where a meaningful share of capital flows are compulsory and index-weighted, the models systematically underestimate the price at which equilibrium settles. That is the primary reason a 30-40% gap between analyst targets and market price has persisted as a multi-year feature rather than correcting.
Structural forces including ASX 200 index weighting, passive superannuation inflows, and SMSF familiarity bias create persistent mechanical buying that has sustained CBA’s premium regardless of earnings revisions, a combination that conventional discounted cash flow and price-to-earnings frameworks were never calibrated to price.
The original source analysis identified passive inflow recovery as “an eventual but uncertain future event” that could support the stock. Even bulls do not treat this structural bid as unconditional protection.
What this tells you is practical: do not treat an analyst’s price target as a reliable near-term floor for when or where a correction might stop. But equally, do not treat the passive flow dynamic as evidence that standard valuation logic is simply inapplicable. Passive flows slow corrections. They do not prevent them when fundamentals deteriorate materially.
Where the credit stress is actually showing up in the data
The abstract risk of housing deterioration is no longer abstract. The signals are arriving in the arrears and application data, and they are concentrated in the parts of the mortgage book that matter most.
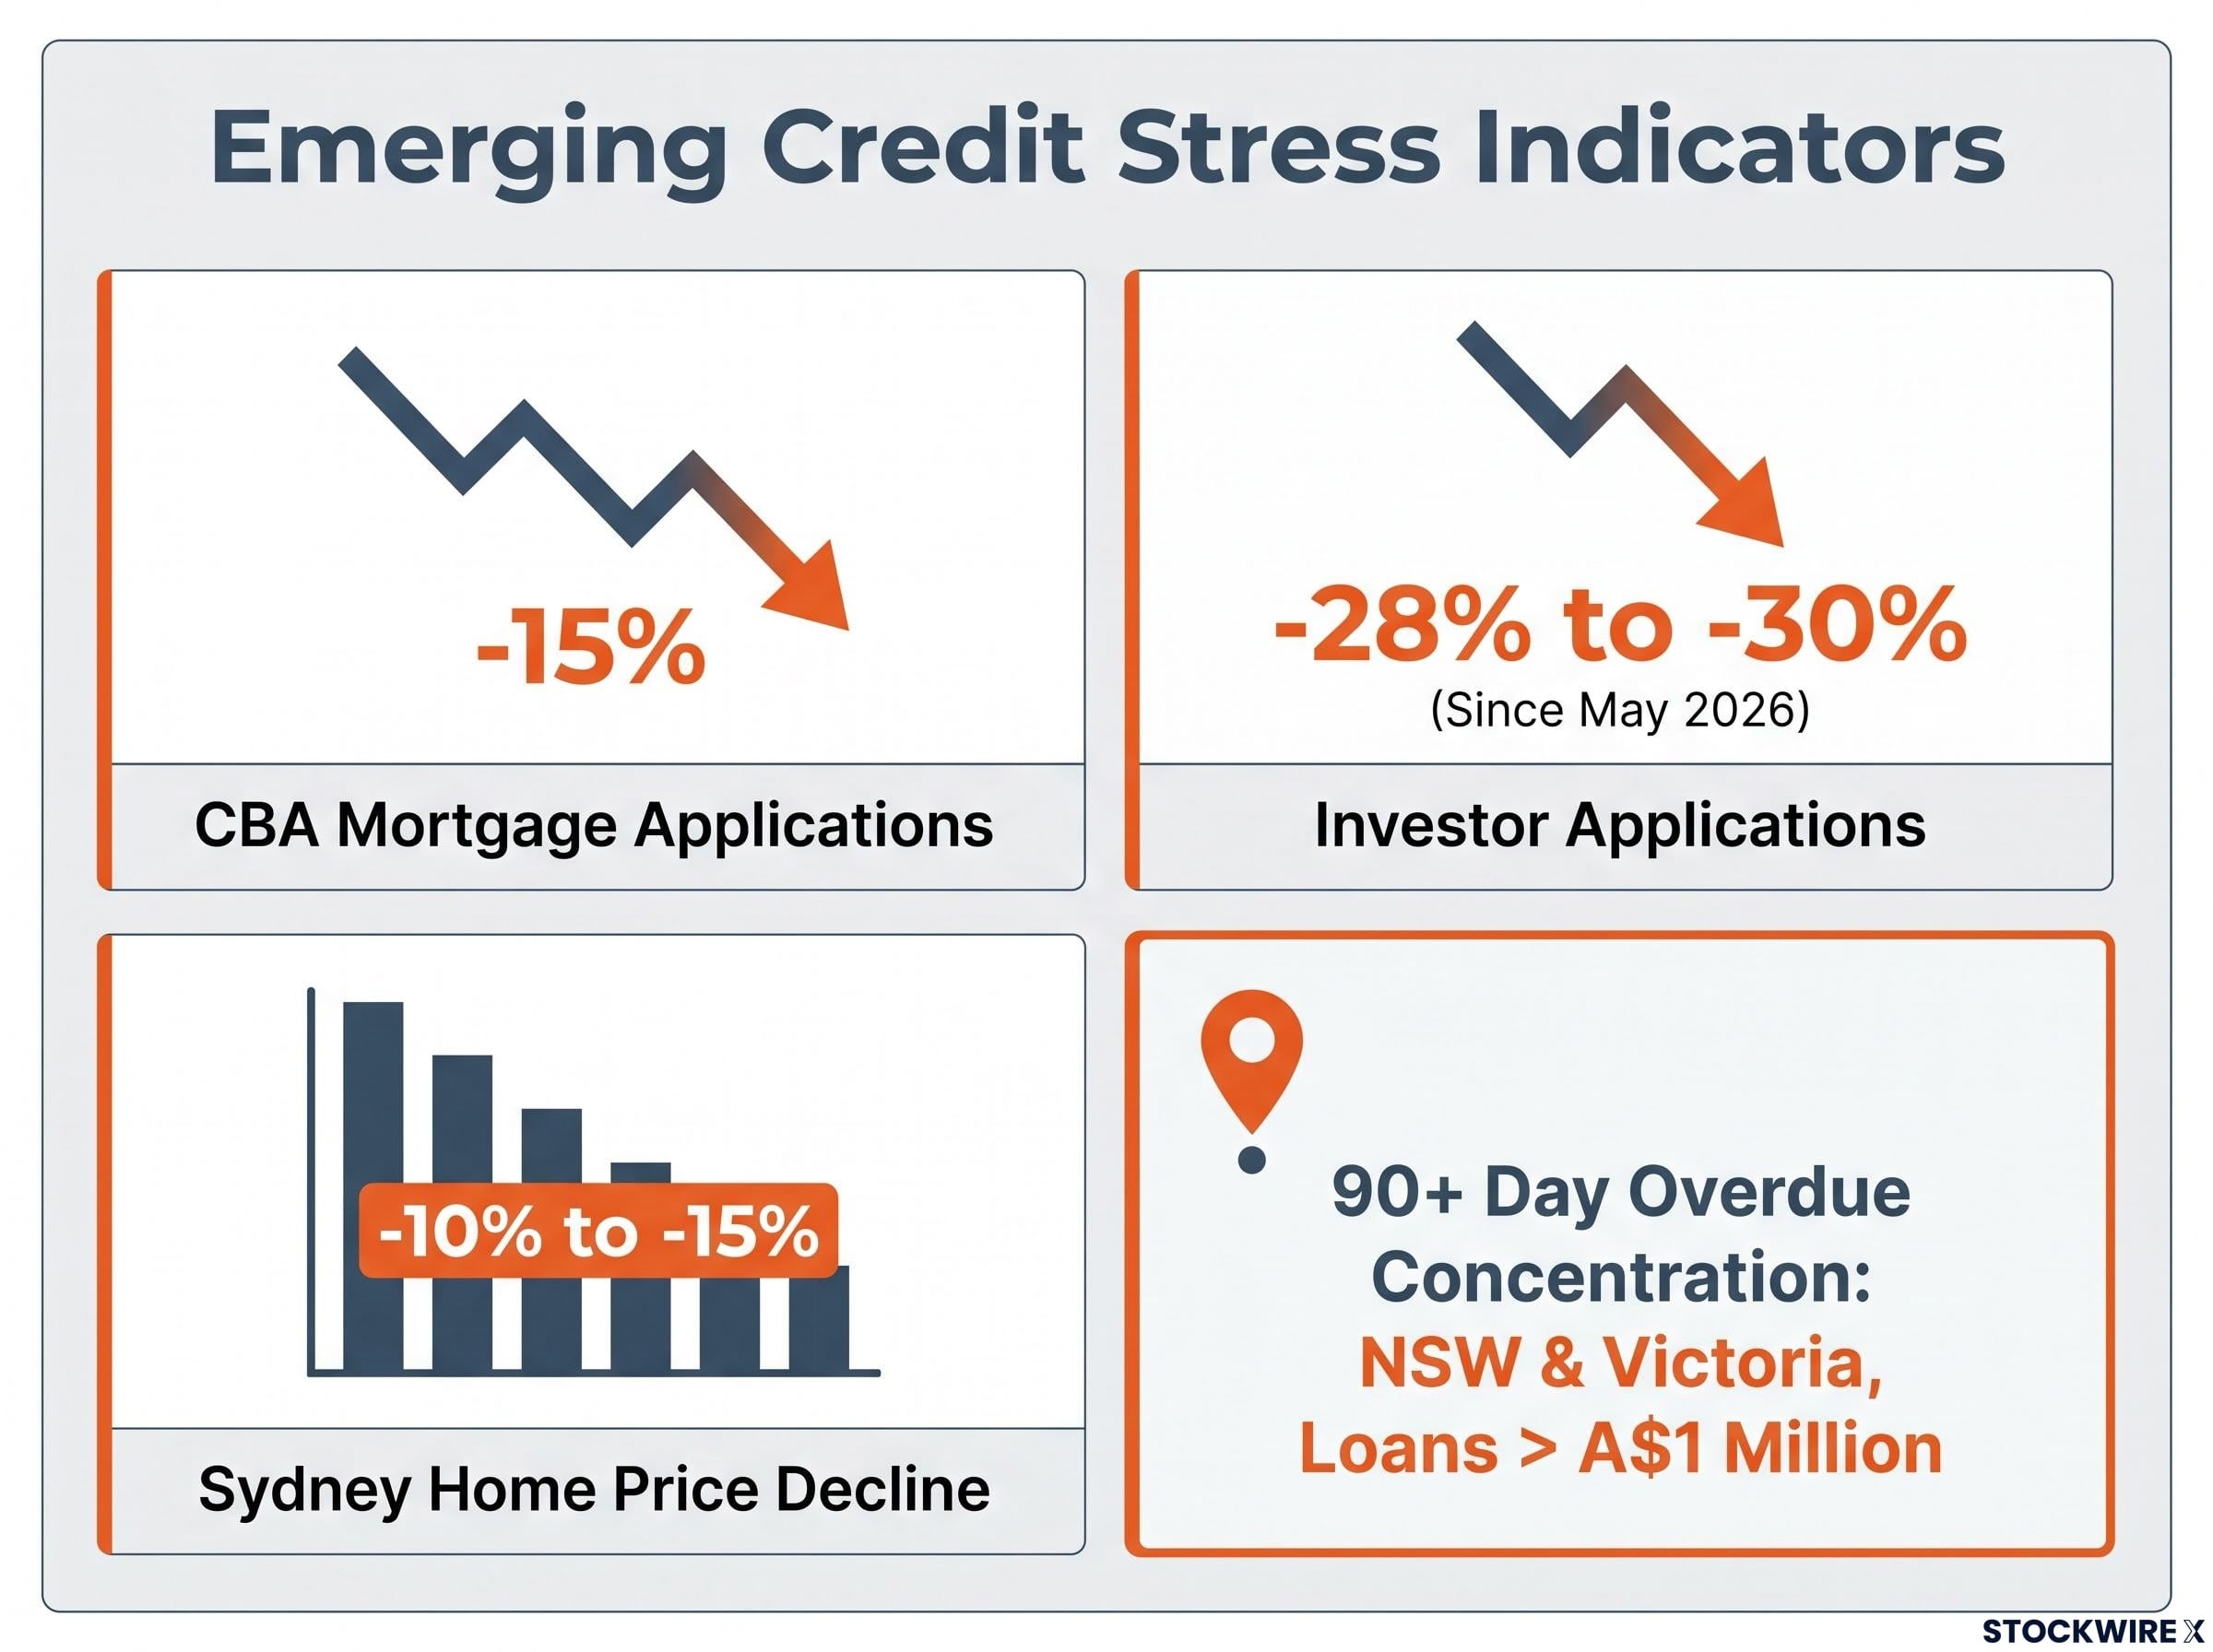
| Metric | CBA figure | Sector context | State concentration | Signal direction |
|---|---|---|---|---|
| Mortgage application decline | Approx. -15% | Peers: -20% and -12% | National | Deteriorating |
| Investor application decline | Down ~28-30% | Sharpest segment decline | National | Deteriorating |
| Conforming 30+ day arrears | Sector-wide high | Highest in over a decade | Broad-based | Deteriorating |
| 90+ day overdue (dollar value) | Rising faster than account numbers | Large loans overrepresented | NSW and Victoria; loans above A$1M | Accelerating |
| Sydney home price decline (annualised) | ~10-15% | CBA’s highest-value exposure market | Sydney | Deteriorating |
The application data confirms that the top of the funnel is slowing. Fewer new loans mean less fresh, relatively low-risk business entering the book. The May 2026 policy and tax changes are the identifiable trigger, with investor lending absorbing the sharpest hit at 28-30% down.
The arrears data is where the composition matters more than the headline. Conforming 30+ day arrears are at their highest level in over a decade across the sector, but the more pointed signal sits beneath that surface number.
Credit bureau data shows the dollar value of mortgages 90+ days overdue is rising faster than the number of accounts, particularly in NSW and Victoria and in loans above A$1 million. That pattern tells you stress is accumulating where loan balances are largest, not spreading uniformly across the book.
This is not yet systemic. But it is concentrated precisely where it would hurt CBA most: large, highly leveraged loans in the bank’s core high-value property markets. For anyone trying to time a new position or reassess an existing one, these are the early-warning signals that define the direction of travel.
The asymmetry problem: what the current price requires you to believe
Strip away the narrative momentum and ask what the numbers demand of the future. The risk and reward from here are not symmetrical.
Upside from current prices requires either a sustained re-rating to even richer multiples (pushing the forward P/E of 23-26x higher still) or earnings growth that materially outpaces current expectations. Both are possible. Neither is the base case in a softening housing market.
Downside, by contrast, requires only a continuation or modest worsening of the trends already confirmed in the arrears and application data. Those trends are already moving in the wrong direction.
Morgan Stanley’s post-downgrade preference order ranked ANZ first and CBA last among the Big Four precisely because CBA’s dominant mortgage market share translates directly into the greatest differential housing cycle exposure, a structural positioning that amplifies the arrears and origination data rather than buffering it.
The two investor scenarios are different enough that they deserve separate treatment:
- Existing holders: CBA can remain a core exposure, but position sizing and return expectations need to reflect the premium. Record profits and structural flow support are real, but they are already in the price. The margin for disappointment is thin.
- New capital: Paying A$156-167 for a stock sitting 30-40% above analyst fair value targets requires a specific belief: that CBA’s structural advantages and Australia’s passive-flow dynamics will once again outweigh the cyclical pressures building in housing and credit. You need to know whether you actually hold that belief before committing capital.
The dividend question
The sub-3% yield deserves direct attention. At current prices, CBA is no longer functioning as the income anchor it was historically assumed to be for Australian retail investors. A yield below 3% from a stock trading 30-40% above analyst fair value tells you the rationale for ownership has shifted. What was once an income-and-quality thesis has become a growth-and-structural-dominance thesis. Those are different investment cases with very different risk profiles, and income-oriented investors need to recalibrate accordingly.
What to watch before the housing cycle settles
Binary calls on CBA have aged poorly in both directions. What works better is knowing which specific signals to track as the housing cycle plays out.
The two-scenario framing: If arrears stay low and drift only modestly upward, current valuations may prove sustainable given structural flow support. If arrears accelerate or spread from large loans into the broader book, provision increases and possible dividend pressure become the central scenario.
Credit stress signals
- APRA and RBA: Sector-wide arrears levels and provisioning trends, particularly any step-change in bank capital adequacy guidance
- Equifax and credit bureaus: Dollar value of mortgages 90+ days overdue, with specific focus on NSW and Victoria concentration and loans above A$1 million
- Ratings agencies: Any outlook changes on Australian bank mortgage portfolio credit quality
Housing market indicators
- Sydney and Melbourne residential property price indices as CBA’s primary exposure markets; Sydney’s annualised home price decline of around 10-15% represents the current baseline to monitor for signs of stabilisation or further deterioration
CBA management commentary
- Mortgage application volume disclosures (baseline: volumes have fallen approximately 15% following the May 2026 policy changes)
- Investor lending trends (baseline: down 28-30%) as the segment absorbing the sharpest policy impact
- Forward guidance on provisioning as the earliest internal signal of management’s own credit-quality assessment
The housing cycle is deteriorating but not yet at a level that forces a sharp re-rating. The next 12-24 months of data will determine which direction the asymmetry resolves. Knowing which data to watch, rather than reacting to share price movement or headline noise, is the practical edge.
The practical distinction between cyclical bank risk and a systemic event matters here: cyclical drawdowns of 10-25% have historically rewarded accumulation in Australian bank stocks, while systemic events produced peak-to-trough collapses of 56% with recoveries taking nearly a decade, and the current arrears and application data looks more consistent with the former than the latter.
Owning CBA at a premium: what the trade-off actually looks like in 2026
CBA’s durable strengths are confirmed: a dominant franchise, record profits of A$10.98 billion, structural passive flow support, and capital ratios that provide genuine buffer. These are not going away in a downturn.
The cyclical risks are equally confirmed: housing deterioration visible in the arrears data since May 2026, slowing mortgage origination, and stress concentrating in large loans within CBA’s core markets. These are not going away quickly either.
What CBA is no longer: a straightforward income play for Australian retail investors. What it has become: a structural-dominance thesis with cyclical execution risk, priced with almost no margin for error.
The forward question is whether CBA’s structural advantages will absorb the housing cycle cleanly, as they have absorbed previous bearish arguments, or whether 2026 will prove to be the year the valuation gap between broker targets and market price finally begins to close. The monitoring framework above is designed to let you answer that question on evidence rather than instinct, updating your view as the data arrives rather than locking in a verdict that the market has a long history of making look foolish.
This article is for informational purposes only and should not be considered financial advice. Investors should conduct their own research and consult with financial professionals before making investment decisions. Past performance does not guarantee future results. Financial projections are subject to market conditions and various risk factors.