Australian bank shares sit in more portfolios than almost any other asset class on the ASX. They anchor self-managed superannuation funds, populate individual brokerage accounts, and underpin the income strategies of retirees across the country. Most holders share a single mental model for what happens when these positions fall in value: the price drops, you wait, dividends keep arriving, and the share price recovers. That model has worked often enough to feel like a rule.
It is not a rule. It is a description of one type of risk. There is a second type, structurally different in kind, where waiting is not rewarded, dividends are cut, and recovery takes the better part of a decade. The two look almost identical in their early stages, which is precisely why most investors fail to distinguish between them until the damage is done.
Here is the framework that separates them. After working through it, you will have a concrete basis for identifying which type of risk you are facing in real market conditions, and a practical signal set you can monitor without needing to predict what comes next.
Two risks that look alike on the surface but require opposite responses
The distinction that matters most for anyone holding Australian bank shares is between cyclical drawdowns and systemic events. A cyclical drawdown is a periodic decline driven by the normal economic cycle: interest rates rise, housing cools, loan growth slows, and bank share prices fall. A systemic event is a crisis that breaks the financial plumbing itself, disrupting funding markets, impairing balance sheets, and compressing dividends for years.
The correct response to each is not just different in degree. It is opposite in direction. Cyclical weakness has historically rewarded investors who added exposure. Systemic events have punished those who treated them the same way.
The cyclical and defensive allocation question extends beyond individual bank shares to the broader portfolio: institutional allocators currently favour a barbell approach that retains meaningful exposure to both ends of the spectrum simultaneously, a structure that maps directly onto the defensive repositioning this framework recommends when systemic signals activate.
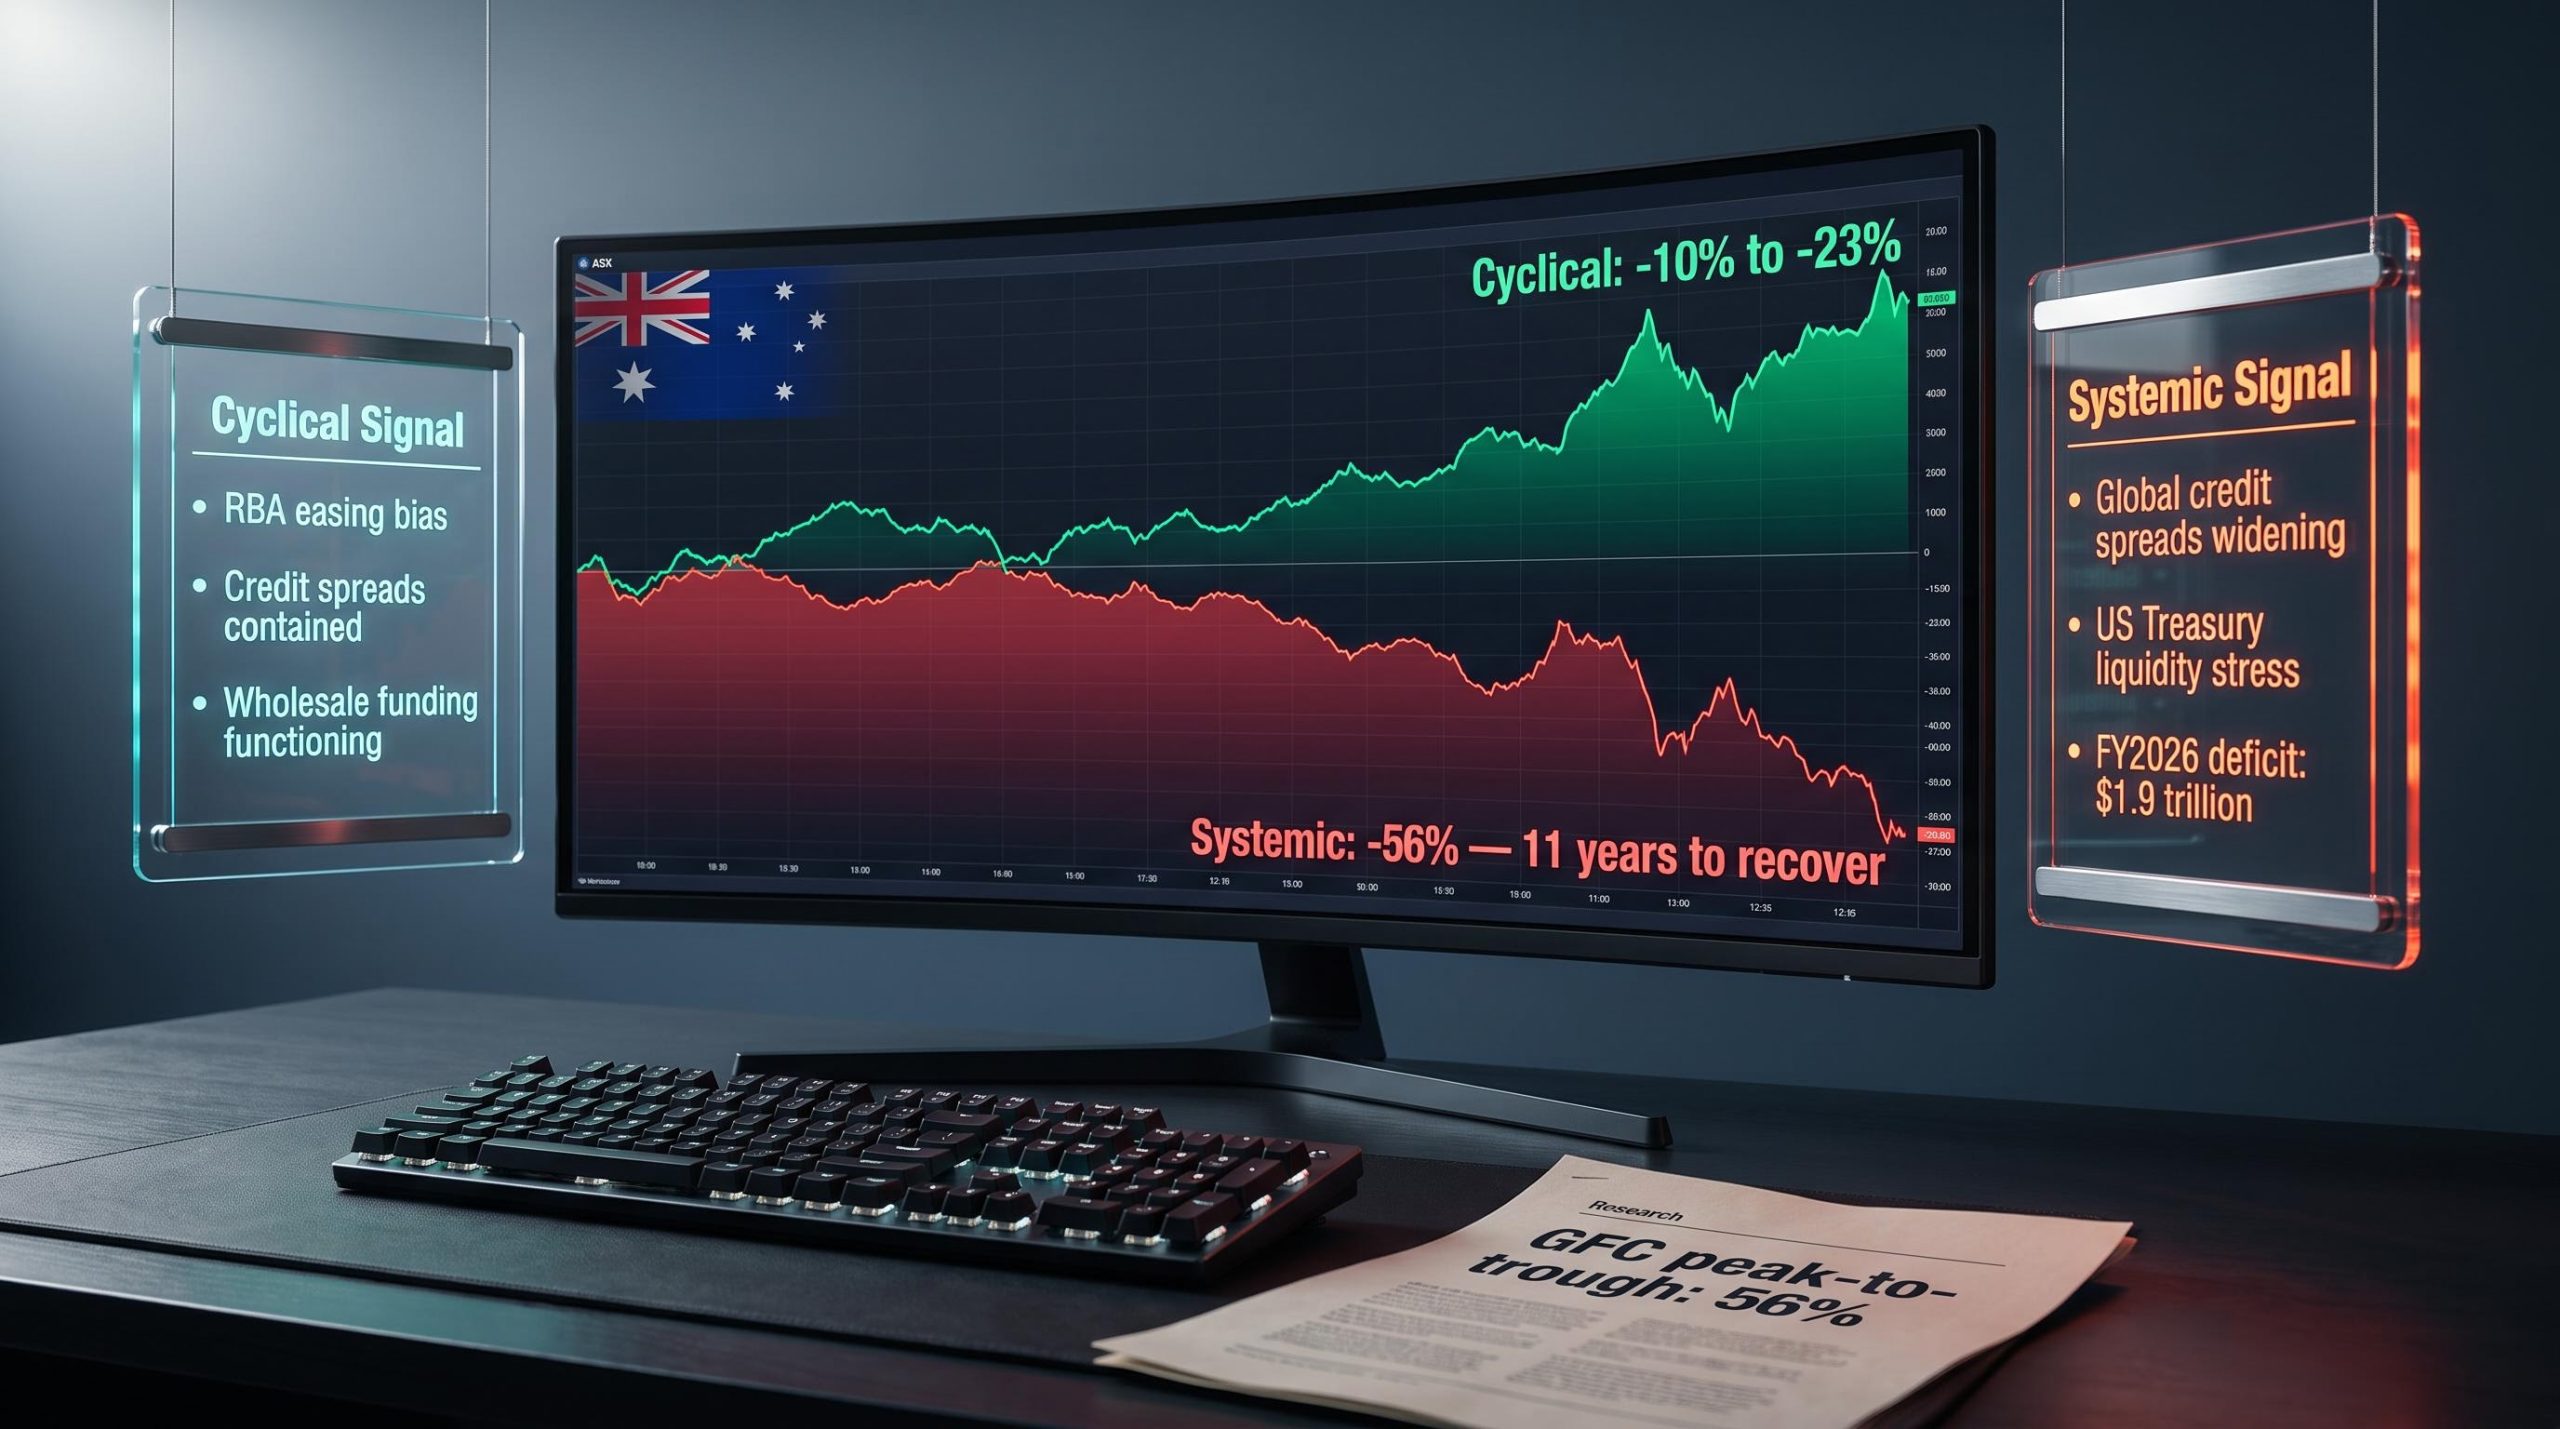
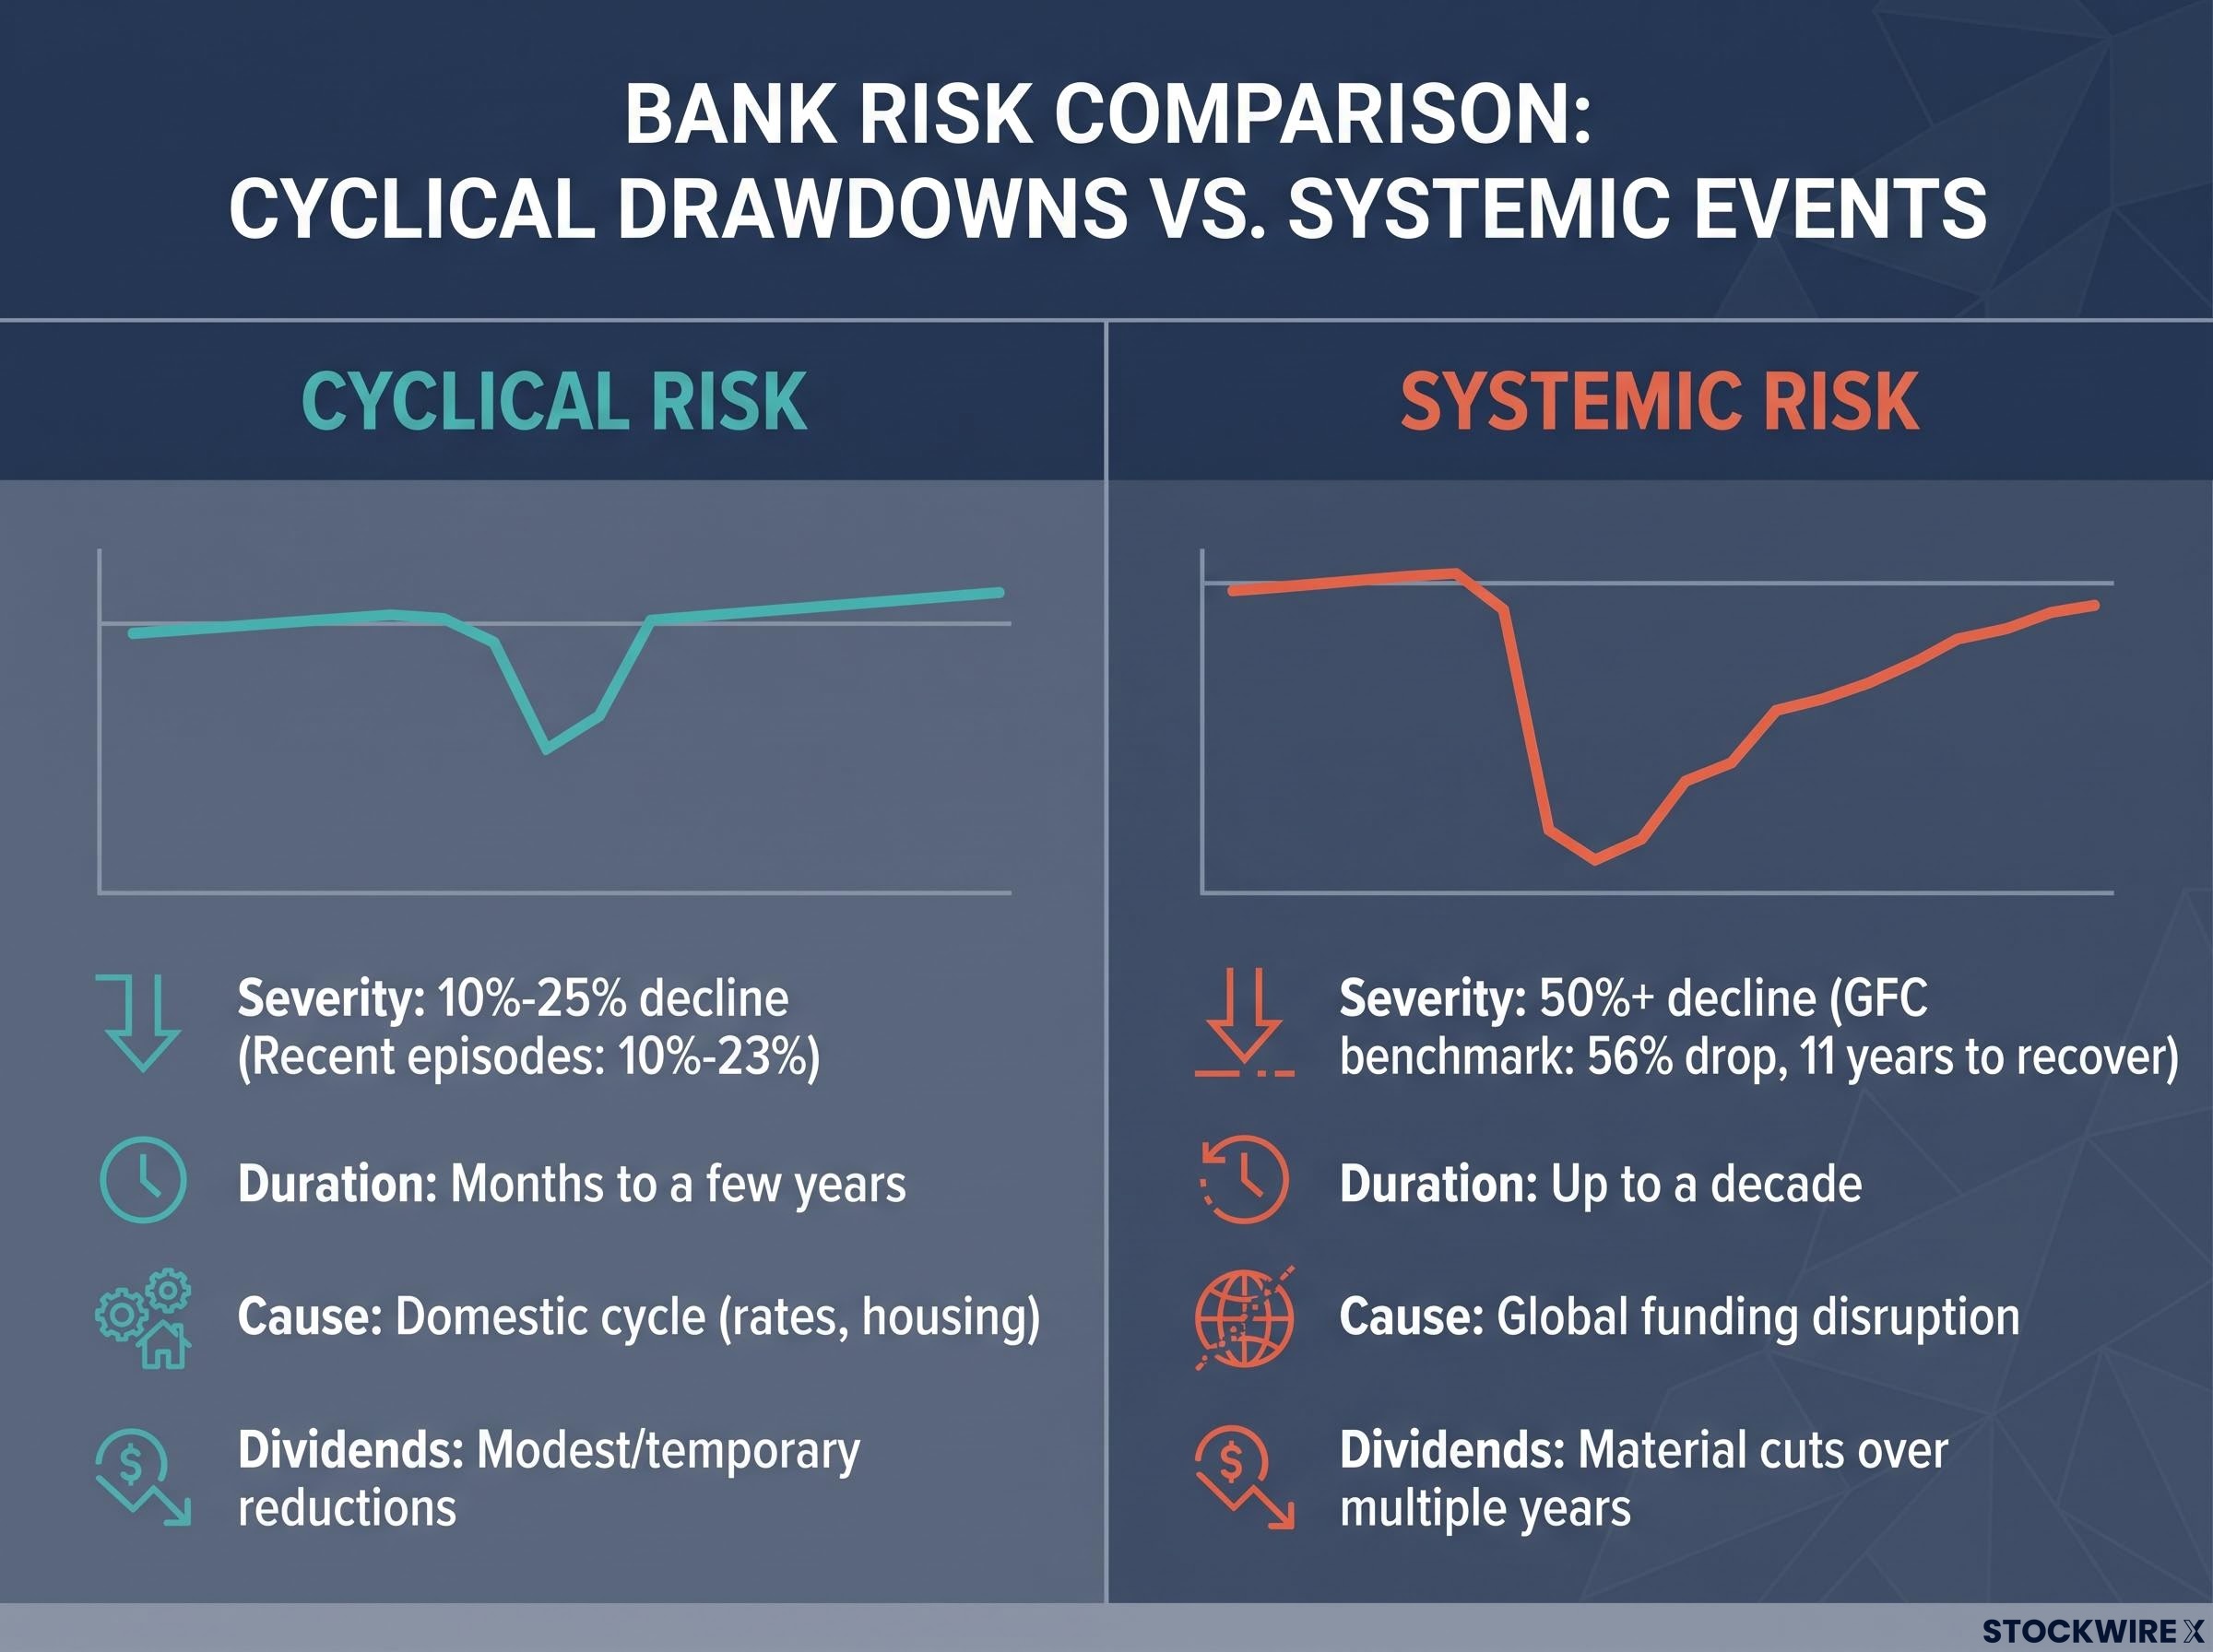
The Global Financial Crisis inflicted a peak-to-trough decline of approximately 56% on Australian bank share prices, accompanied by dividend cuts across the sector. Recovering to prior peak levels required close to 11 years, a timeline that transformed what many holders assumed was a temporary setback into a fundamental disruption of their income and capital plans. For retirees or near-retirees holding concentrated bank positions, that was not a temporary inconvenience; it was a permanent alteration to retirement income.
By contrast, more recent cyclical episodes have seen some major bank share prices decline between 10% and 23% from their peaks, magnitudes that fit comfortably within the recoverable category.
The difficulty is not identifying these risks in hindsight. It is telling them apart in real time, when both initially present as falling share prices.
Cyclical drawdown characteristics:
- Severity: 10%-25% price decline
- Duration: months to a few years
- Cause: domestic economic cycle (rates, housing, credit growth)
- Dividend impact: modest or temporary reductions
- Appropriate response: consider adding exposure
Systemic event characteristics:
- Severity: 50%+ price decline
- Duration: potentially a decade of impaired returns
- Cause: global funding market disruption, structural crisis
- Dividend impact: material cuts sustained over multiple years
- Appropriate response: defensive repositioning
When big ASX news breaks, our subscribers know first
What drives the cyclical risk, and why it has historically been manageable
Cyclical bank risk follows a pattern that has repeated across multiple economic cycles. The drivers are domestic: interest rate movements, housing market conditions, and loan growth, which is the primary engine of bank profitability and share prices.
When the Reserve Bank of Australia (RBA) tightens monetary policy, borrowing costs rise, housing activity slows, and credit growth contracts. Bank earnings come under pressure and share prices decline. The mechanism works in reverse during easing cycles: falling rates reduce funding costs, support the housing market, and revive loan demand.
This is why cyclical drawdowns are recoverable by design. The underlying demand for credit, housing, and banking services does not disappear. It contracts temporarily. Federal budget policies and housing market settings directly influence the speed of recovery, particularly for the major banks.
During the recent episodes where share prices fell 10%-23% from their peaks, underlying bank fundamentals remained intact. Net interest margins held up, capital ratios stayed healthy, and the decline reflected economic cycle positioning rather than structural impairment. For income-focused investors with a multi-year horizon and no forced-selling pressure, these episodes have historically represented accumulation opportunities rather than exit signals.
Bank valuation fundamentals including mortgage book concentration, household debt levels at approximately 186% of disposable income, and rising unemployment trajectories all feed directly into the earnings stability assumptions that determine whether a cyclical drawdown is recoverable or whether structural impairment is underway.
The signal set that characterises cyclical conditions includes:
- Domestic economic slowdown or mild recession
- Gradual credit quality deterioration (rising arrears, some impairments)
- Functioning interbank and wholesale funding markets
- RBA easing bias or active rate cuts
- Credit spreads contained within normal ranges
- Normal Treasury market functioning
When these conditions hold, you are dealing with the recoverable category.
Understanding the systemic threat and why it operates by different rules
The reassurance of the cyclical framework only holds when you are actually in a cyclical scenario. A second category of risk exists where the normal playbook fails completely, and it originates not in the domestic economy but in the structure of global funding markets.
US Treasuries are the global pricing anchor. Every other asset, from corporate bonds to mortgage rates to the cost at which Australian banks borrow offshore, is priced relative to US government debt. When that anchor is stable, the system works. When it is not, the disruption is qualitatively different from anything in the domestic cycle.
The structural vulnerabilities in the Treasury market are not speculative. They are documented in Congressional Budget Office (CBO) projections and Federal Reserve financial stability assessments. US government interest payments have roughly quadrupled over the past decade and now exceed defence spending, a warning signal for long-term fiscal sustainability. The CBO projects the FY2026 deficit at $1.9 trillion, rising thereafter through its 2036 projection horizon.
Geopolitical instability and private credit stress operate through cross-border transmission channels that standard domestic stress tests were not designed to fully capture, reaching Australian bank balance sheets indirectly through commodity demand contraction and wholesale credit spread widening rather than through direct balance sheet exposure.
The CBO projects the FY2026 US federal deficit at $1.9 trillion, with deficits rising through its 2036 projection horizon, meaning a growing share of tax revenues and new borrowing must go to debt service rather than new spending.
Bank dealer capacity to absorb large Treasury flows is constrained by capital requirements, increasing market fragility during stress periods. Hedge-fund basis trades in Treasuries, a form of cash-futures arbitrage, are recognised as a potential amplifier of stress episodes when unwound under leverage pressure.
Why the size of this risk is different in kind, not just degree
The distinction here is not between a larger and smaller drawdown. It is between a risk that impairs a sector temporarily and one that impairs the global pricing mechanism itself.
A severe loss of confidence or liquidity disruption in the Treasury market would likely produce global impacts at least comparable to past major crises, including the GFC, given Treasuries’ central role in global pricing and funding. The March 2020 COVID-period disruption, which required Federal Reserve backstop intervention to stabilise Treasury markets, illustrated how quickly dysfunction can emerge and how narrow the margin can be between normal volatility and genuine systemic risk.
That episode lasted days before the intervention arrived. A scenario where the intervention is slower, smaller, or less effective would transmit globally with extraordinary speed.
How a US Treasury shock reaches Australian bank investors
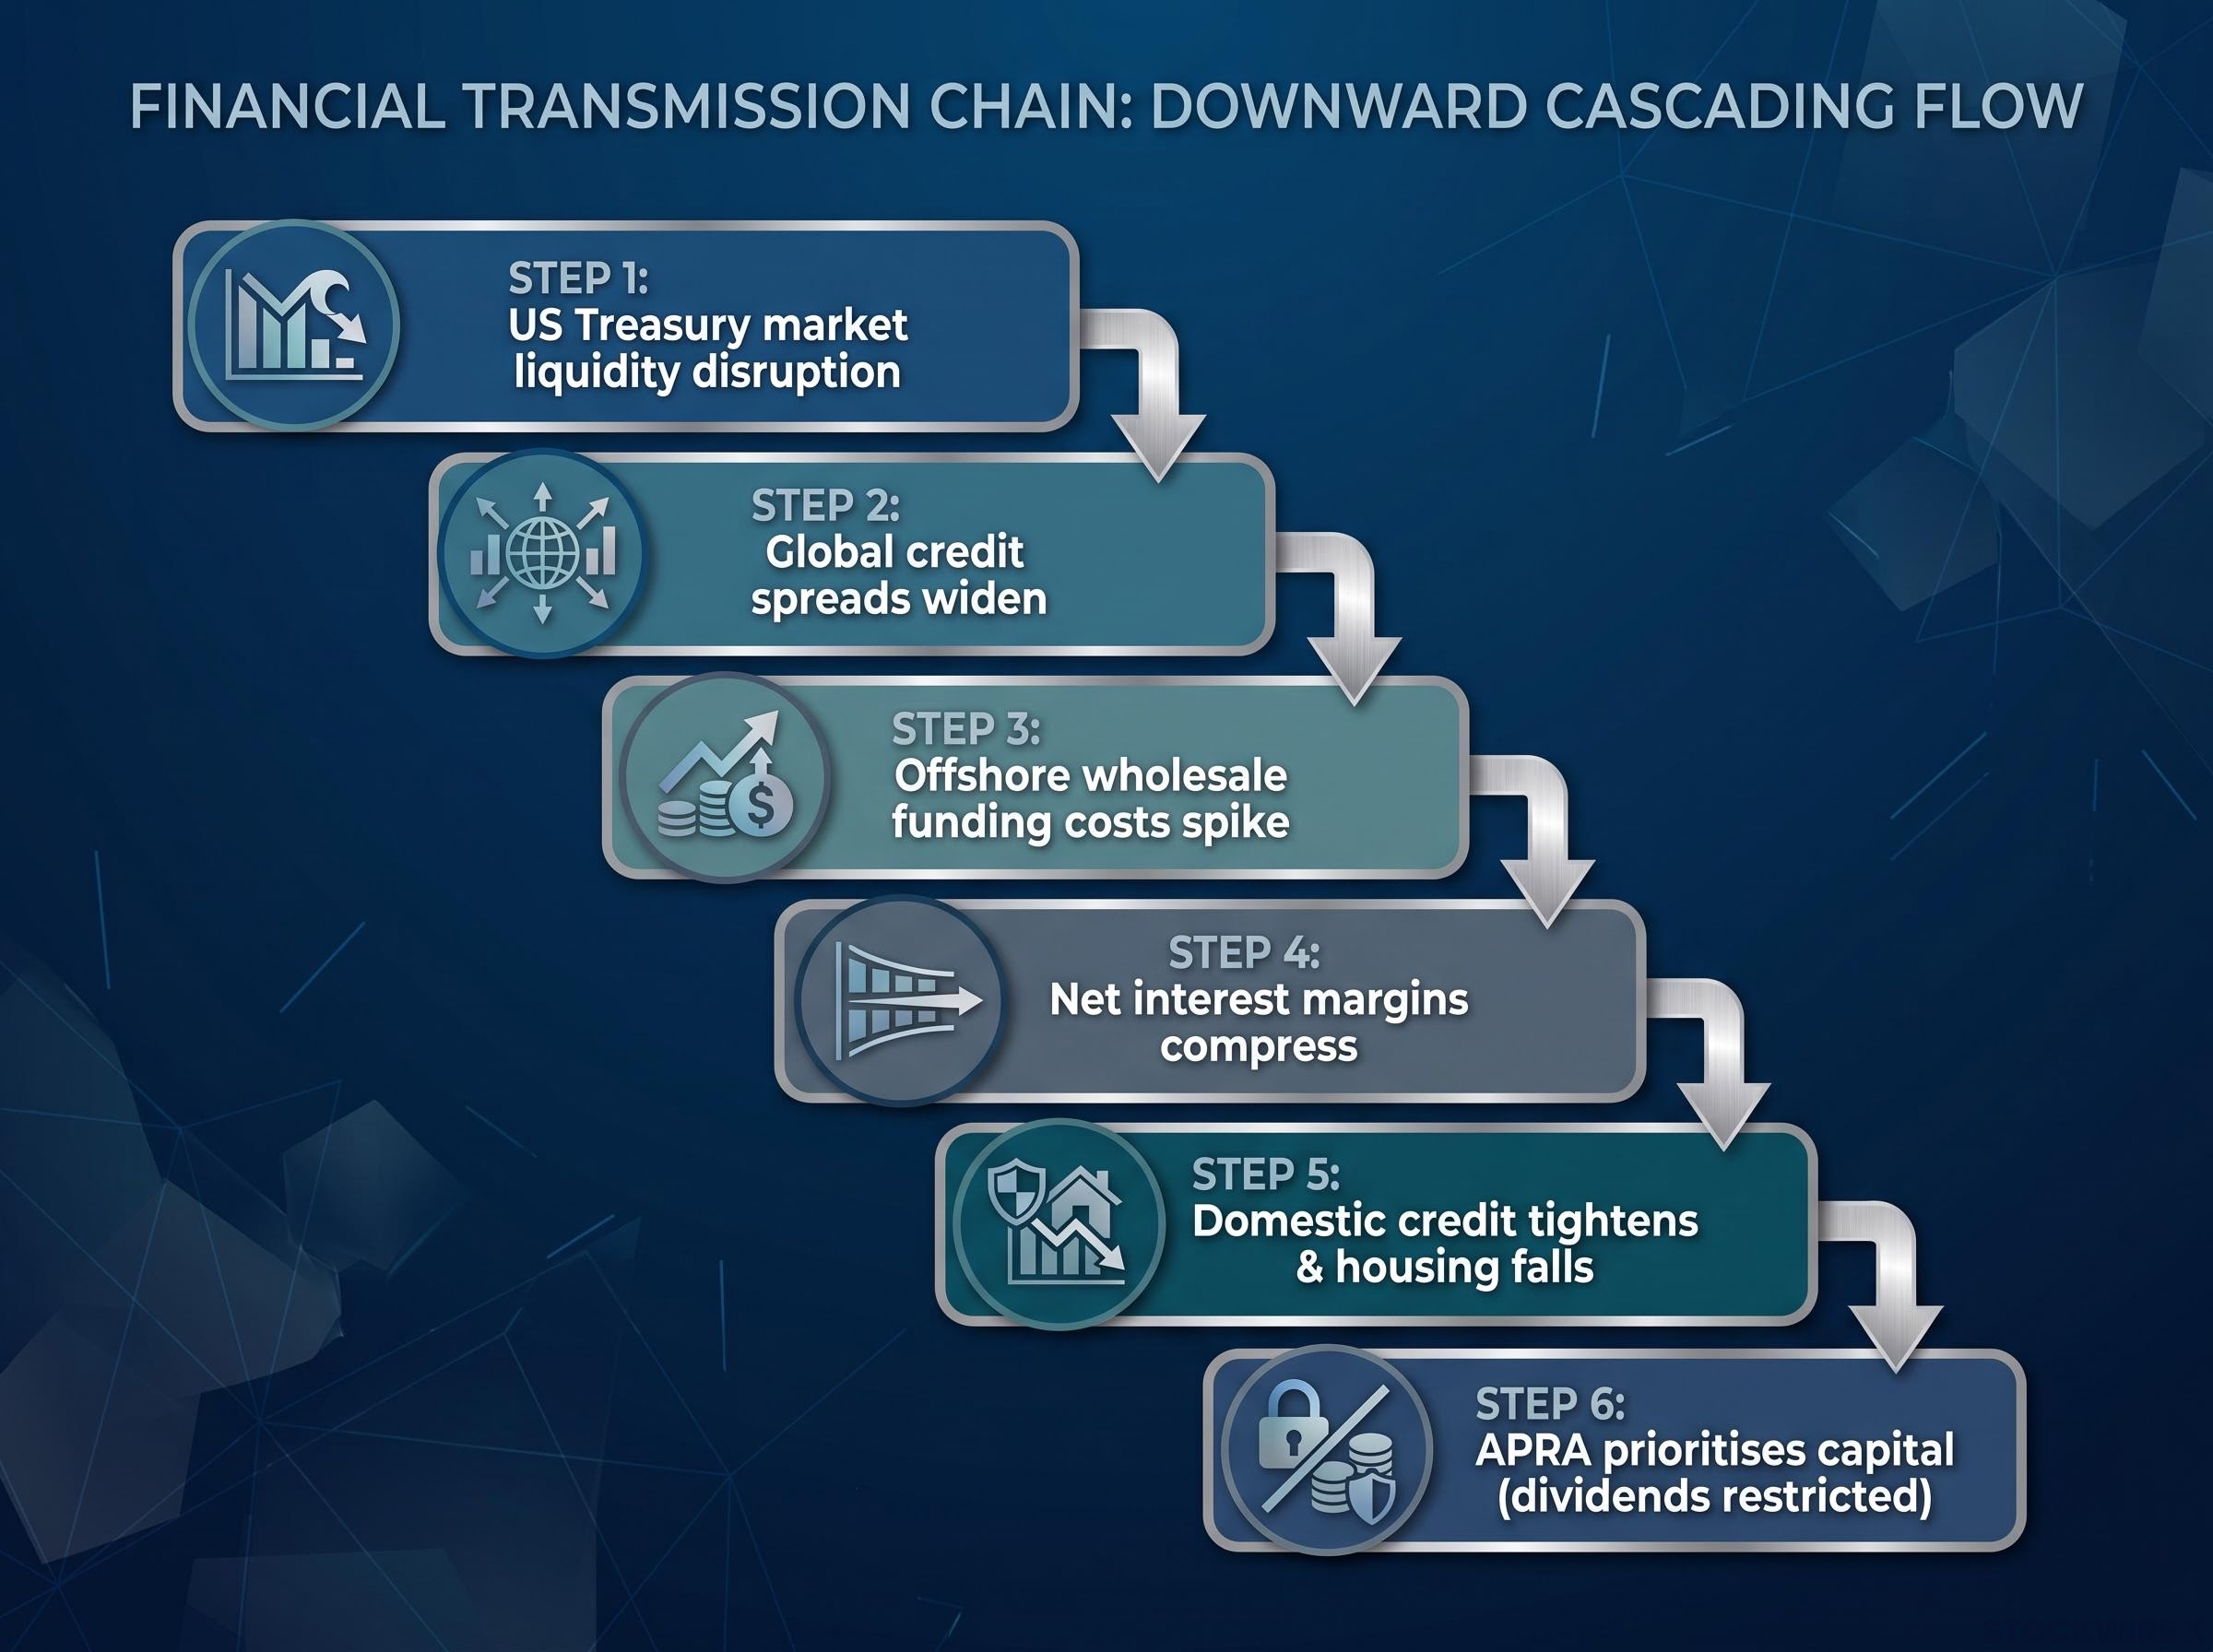
The distance between a US bond market disruption and a dividend cut notification arriving in your inbox is shorter than most Australian investors assume. The transmission chain is sequential and direct:
- US Treasury market experiences a liquidity disruption or disorderly sell-off
- Global credit spreads widen rapidly as risk repricing cascades across fixed-income markets
- Australian banks’ offshore wholesale funding costs spike; refinancing conditions tighten
- Net interest margins compress as banks pay more for funds but face constraints on passing costs to borrowers
- Credit conditions tighten domestically; housing prices fall, reinforcing the earnings squeeze through rising loan impairments
- APRA (the Australian Prudential Regulation Authority) prioritises capital preservation, creating regulatory pressure to reduce or restrict dividends
The structural link that makes this transmission direct rather than indirect is offshore wholesale funding dependence. Major Australian banks supplement domestic deposits with offshore wholesale markets, making them directly exposed to global funding cost movements.
In severe stress, it is consistent with international regulatory practice for APRA to prioritise capital buffers over shareholder payouts. Regulators in multiple jurisdictions acted in exactly this way during the GFC, restricting or encouraging dividend reductions to preserve system stability.
The offshore wholesale funding channel is the specific structural reason why a US Treasury crisis does not stop at Australia’s borders. Geographic distance provides no insulation when your banks borrow in global markets.
Reading the signals: how to tell the difference in real time
You do not need to predict a US bond crisis. You need to monitor a signal set and recognise when the configuration shifts from cyclical to systemic. That is a much more achievable standard than forecasting, and it is how professional risk managers and central banks approach financial stability.
The most dangerous investor behaviour is applying the cyclical response, buying the dip, to a systemic event. The framework below is designed to prevent exactly that mistake.
| Cyclical signal (consider adding exposure) | Systemic signal (consider defensive action) |
|---|---|
| Domestic economic slowdown or mild recession | Rapid widening of global credit spreads |
| Gradual credit quality deterioration | US Treasury market liquidity stress or dysfunction |
| Functioning interbank and wholesale funding markets | Disorderly bond and currency moves across multiple markets |
| Central bank easing bias (RBA cutting or signalling cuts) | Emergency regulatory communications or out-of-cycle statements |
| Bank share prices declining but credit spreads contained | Offshore wholesale funding markets seizing or pricing counterparty risk |
| Normal Treasury market functioning with modest yield moves | AUD/USD and cross-currency basis moving sharply under stress |
The value of this framework is that it replaces prediction with observation. Predictions require getting the timing right. Signals require only that you are watching when the configuration changes. If the left column describes current conditions, the cyclical playbook applies. If the right column starts lighting up, it is time to reassess.
Building a portfolio that can survive a systemic event and benefit from a cyclical one
The adjustments described here make sense regardless of which scenario materialises. They protect against the catastrophic outcome while preserving your ability to benefit from the recoverable one. Preparation precedes prediction.
- Audit your concentration exposure. Assess your actual percentage exposure to Australian banks, including holdings through superannuation funds and index funds. Effective concentration is frequently higher than investors realise when these indirect holdings are counted alongside direct positions.
- Stress-test your income under a 30% dividend cut sustained for several years. This is not a worst-case fantasy. It is consistent with what occurred during the GFC and represents a defensible planning assumption for income-dependent investors. If a 30% cut for three to five years breaks your retirement income plan, you have a concentration problem.
- Maintain a 12-24 month cash or short-duration fixed income buffer. This eliminates the forced-selling mechanism that converts temporary drawdowns into permanent capital loss. The buffer exists specifically so you never have to sell bank shares at trough prices to fund living expenses.
- Establish the signal monitoring habit as an ongoing discipline. The signal table above is not a one-time analysis. It is a framework you apply each quarter, checking whether conditions remain cyclical or whether the systemic indicators are beginning to activate.
Crises can represent reinvestment opportunities at significantly lower prices, but only for investors who have not been forced to sell, are actively monitoring conditions, hold sufficient liquidity, and have stress-tested their income assumptions in advance. Without these preconditions, a systemic event removes the opportunity and leaves only the damage.
Investors who want to go beyond the signal-monitoring framework and build a complete resilience plan will find our comprehensive walkthrough of portfolio crisis preparation covers the four concrete preparation actions, including liquidity buffer sizing, drawdown stress testing, and rules-based rebalancing triggers, that can each be completed within a week.
What this framework actually changes about the way you hold bank shares
The portfolio you hold after reading this analysis may be identical to the one you held before. The difference is not the holdings. It is the decision rules you apply to them and the monitoring discipline you carry forward.
You now have a structured basis for responding correctly to whatever materialises. A cyclical drawdown rewards discipline. A systemic event punishes inaction. The framework determines which response is appropriate at any given moment.
Major systemic events occur roughly once per decade or every two decades. That means the cyclical response will be correct far more often. But the cost of misapplying it to a systemic event is decade-scale, which is why the distinction warrants the effort.
A cyclical drawdown rewards patience. A systemic event punishes it. The framework you carry forward determines which response you apply, and that single distinction is what separates investors who recover from those who do not.
The signals described here are available through public sources: credit spreads, Treasury market liquidity conditions, RBA and APRA communications, currency and cross-currency basis movements. No specialist infrastructure is required. What is required is the habit of checking, and the willingness to act on what the signals tell you rather than defaulting to what worked last time.
This article is for informational purposes only and should not be considered financial advice. Investors should conduct their own research and consult with financial professionals before making investment decisions. Past performance does not guarantee future results.