
ResMed Share Price at 52% Discount: Opportunity or Value Trap?
1 hr ago

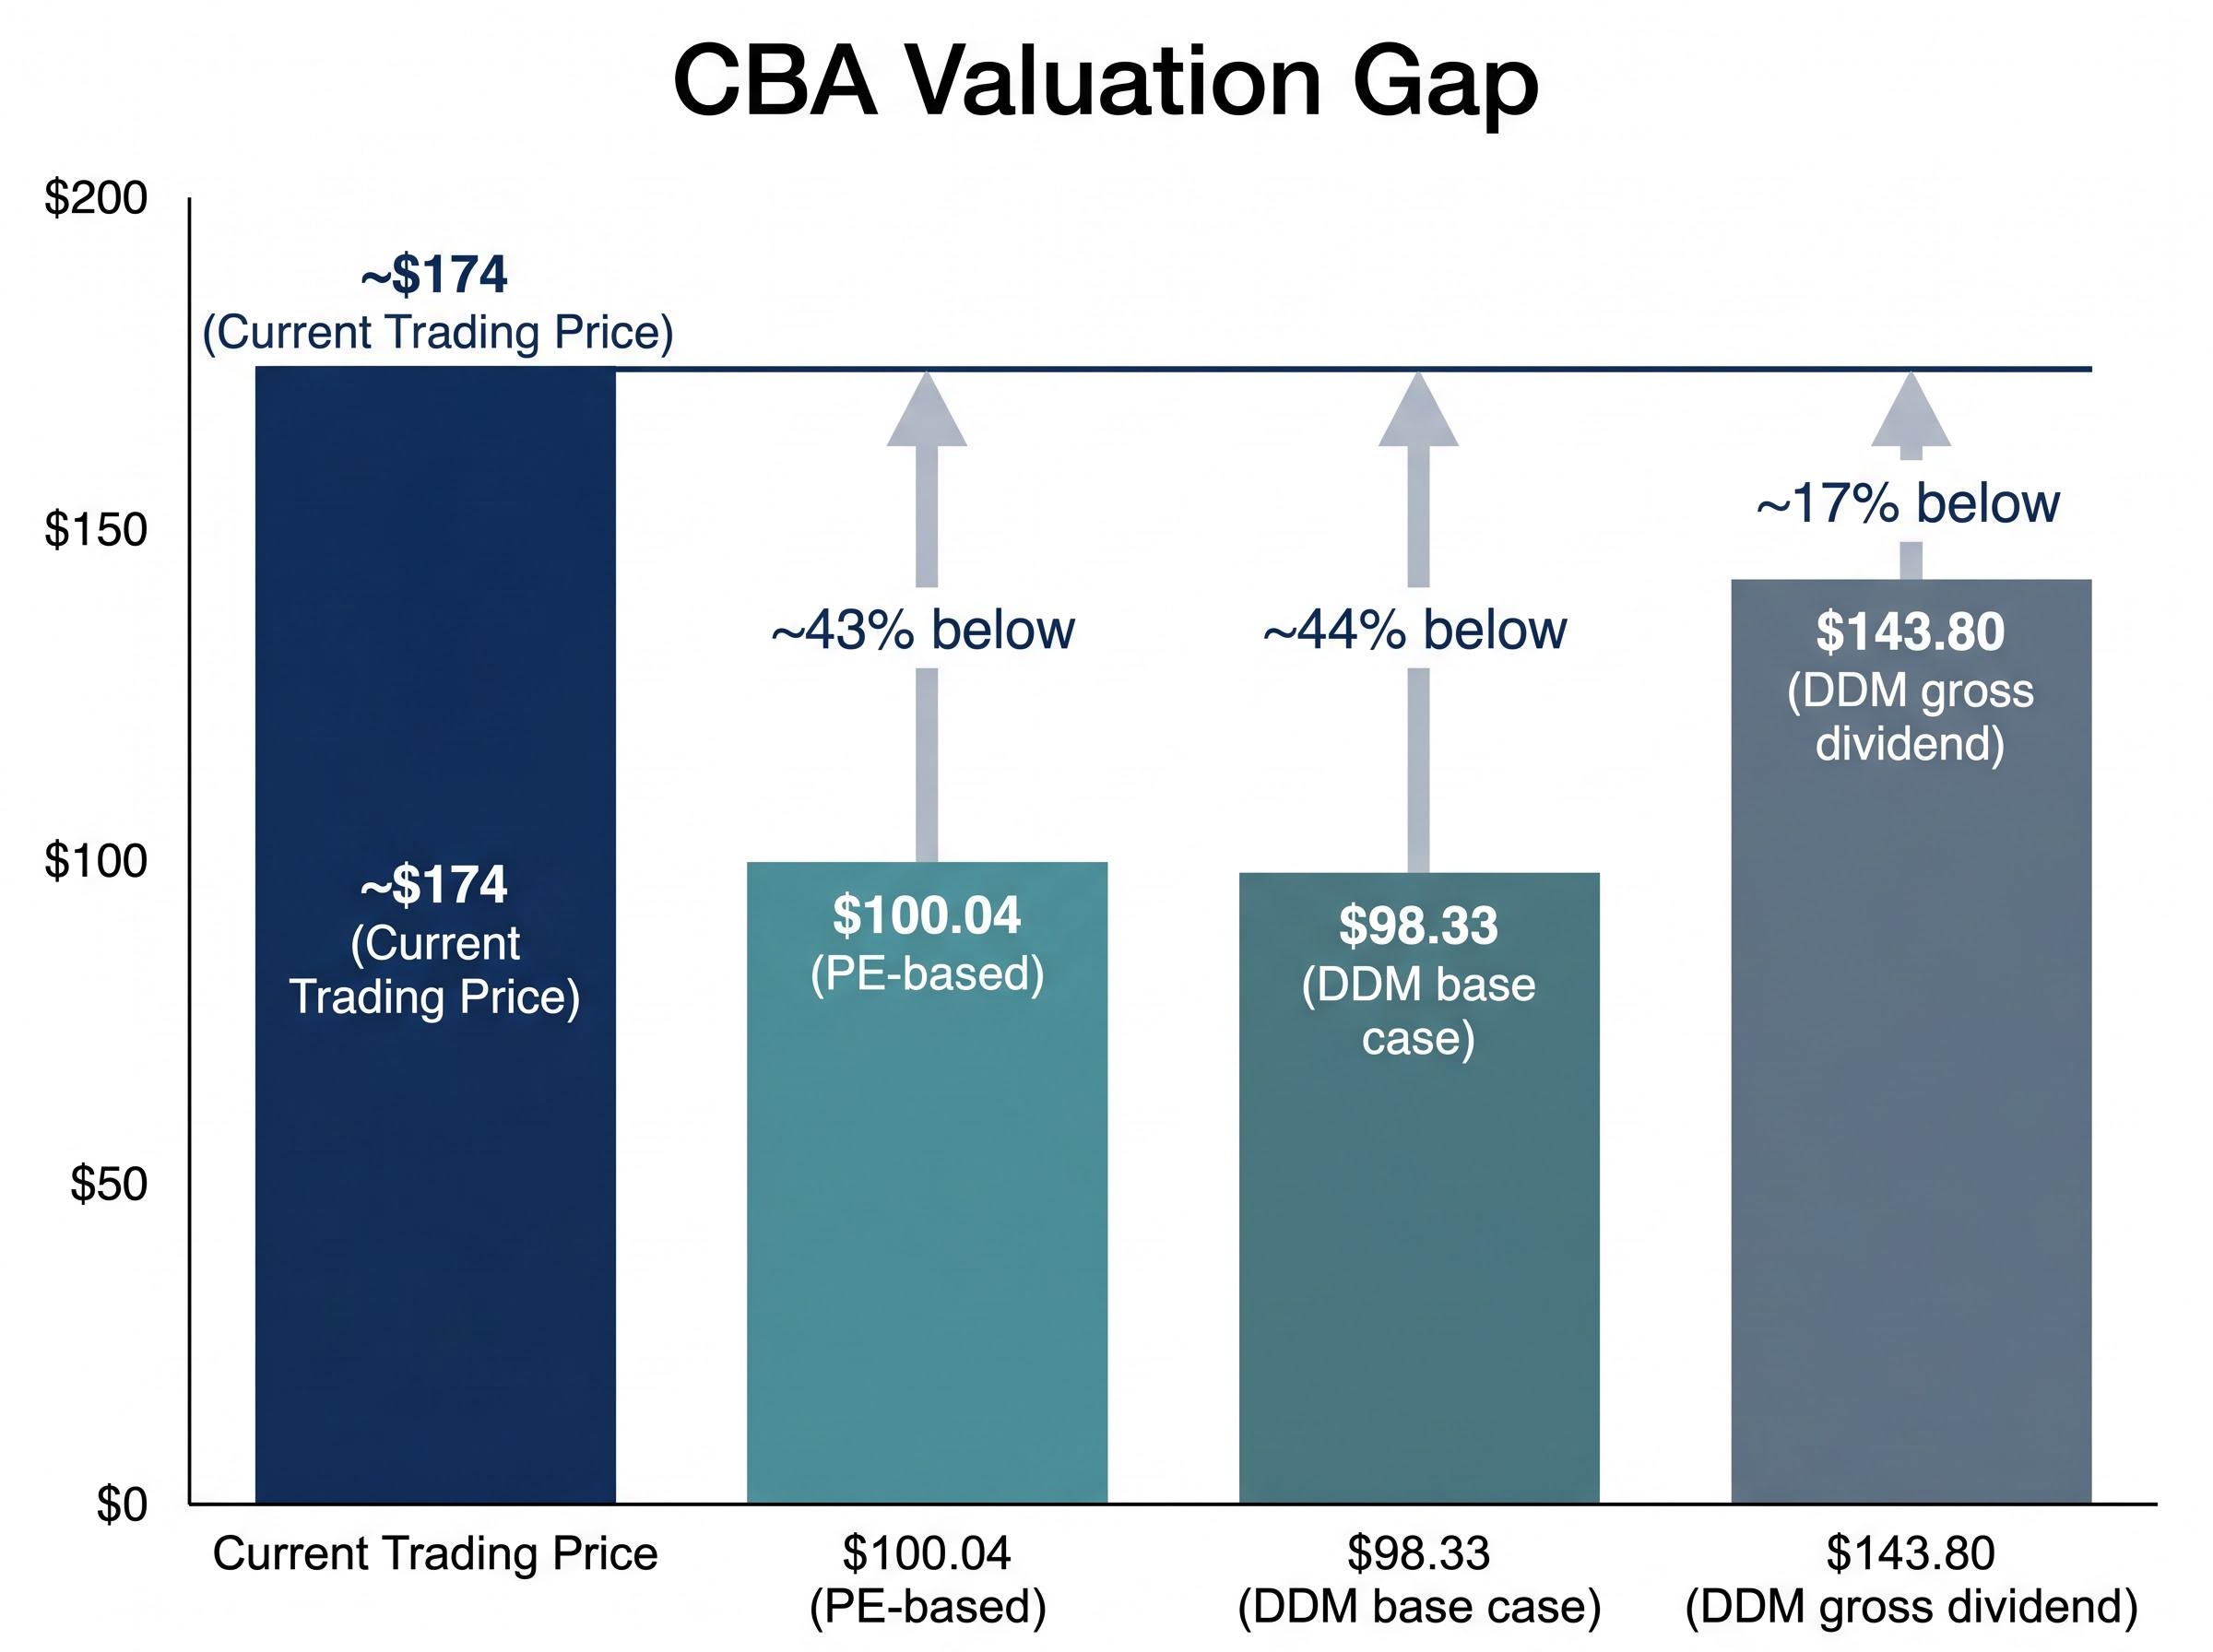
Two professional valuation models, applied carefully and in good faith to Commonwealth Bank of Australia’s (CBA’s) own earnings and dividend data, produce fair value estimates of roughly $98 to $143. The stock is trading at approximately $174. Something is missing from the models.
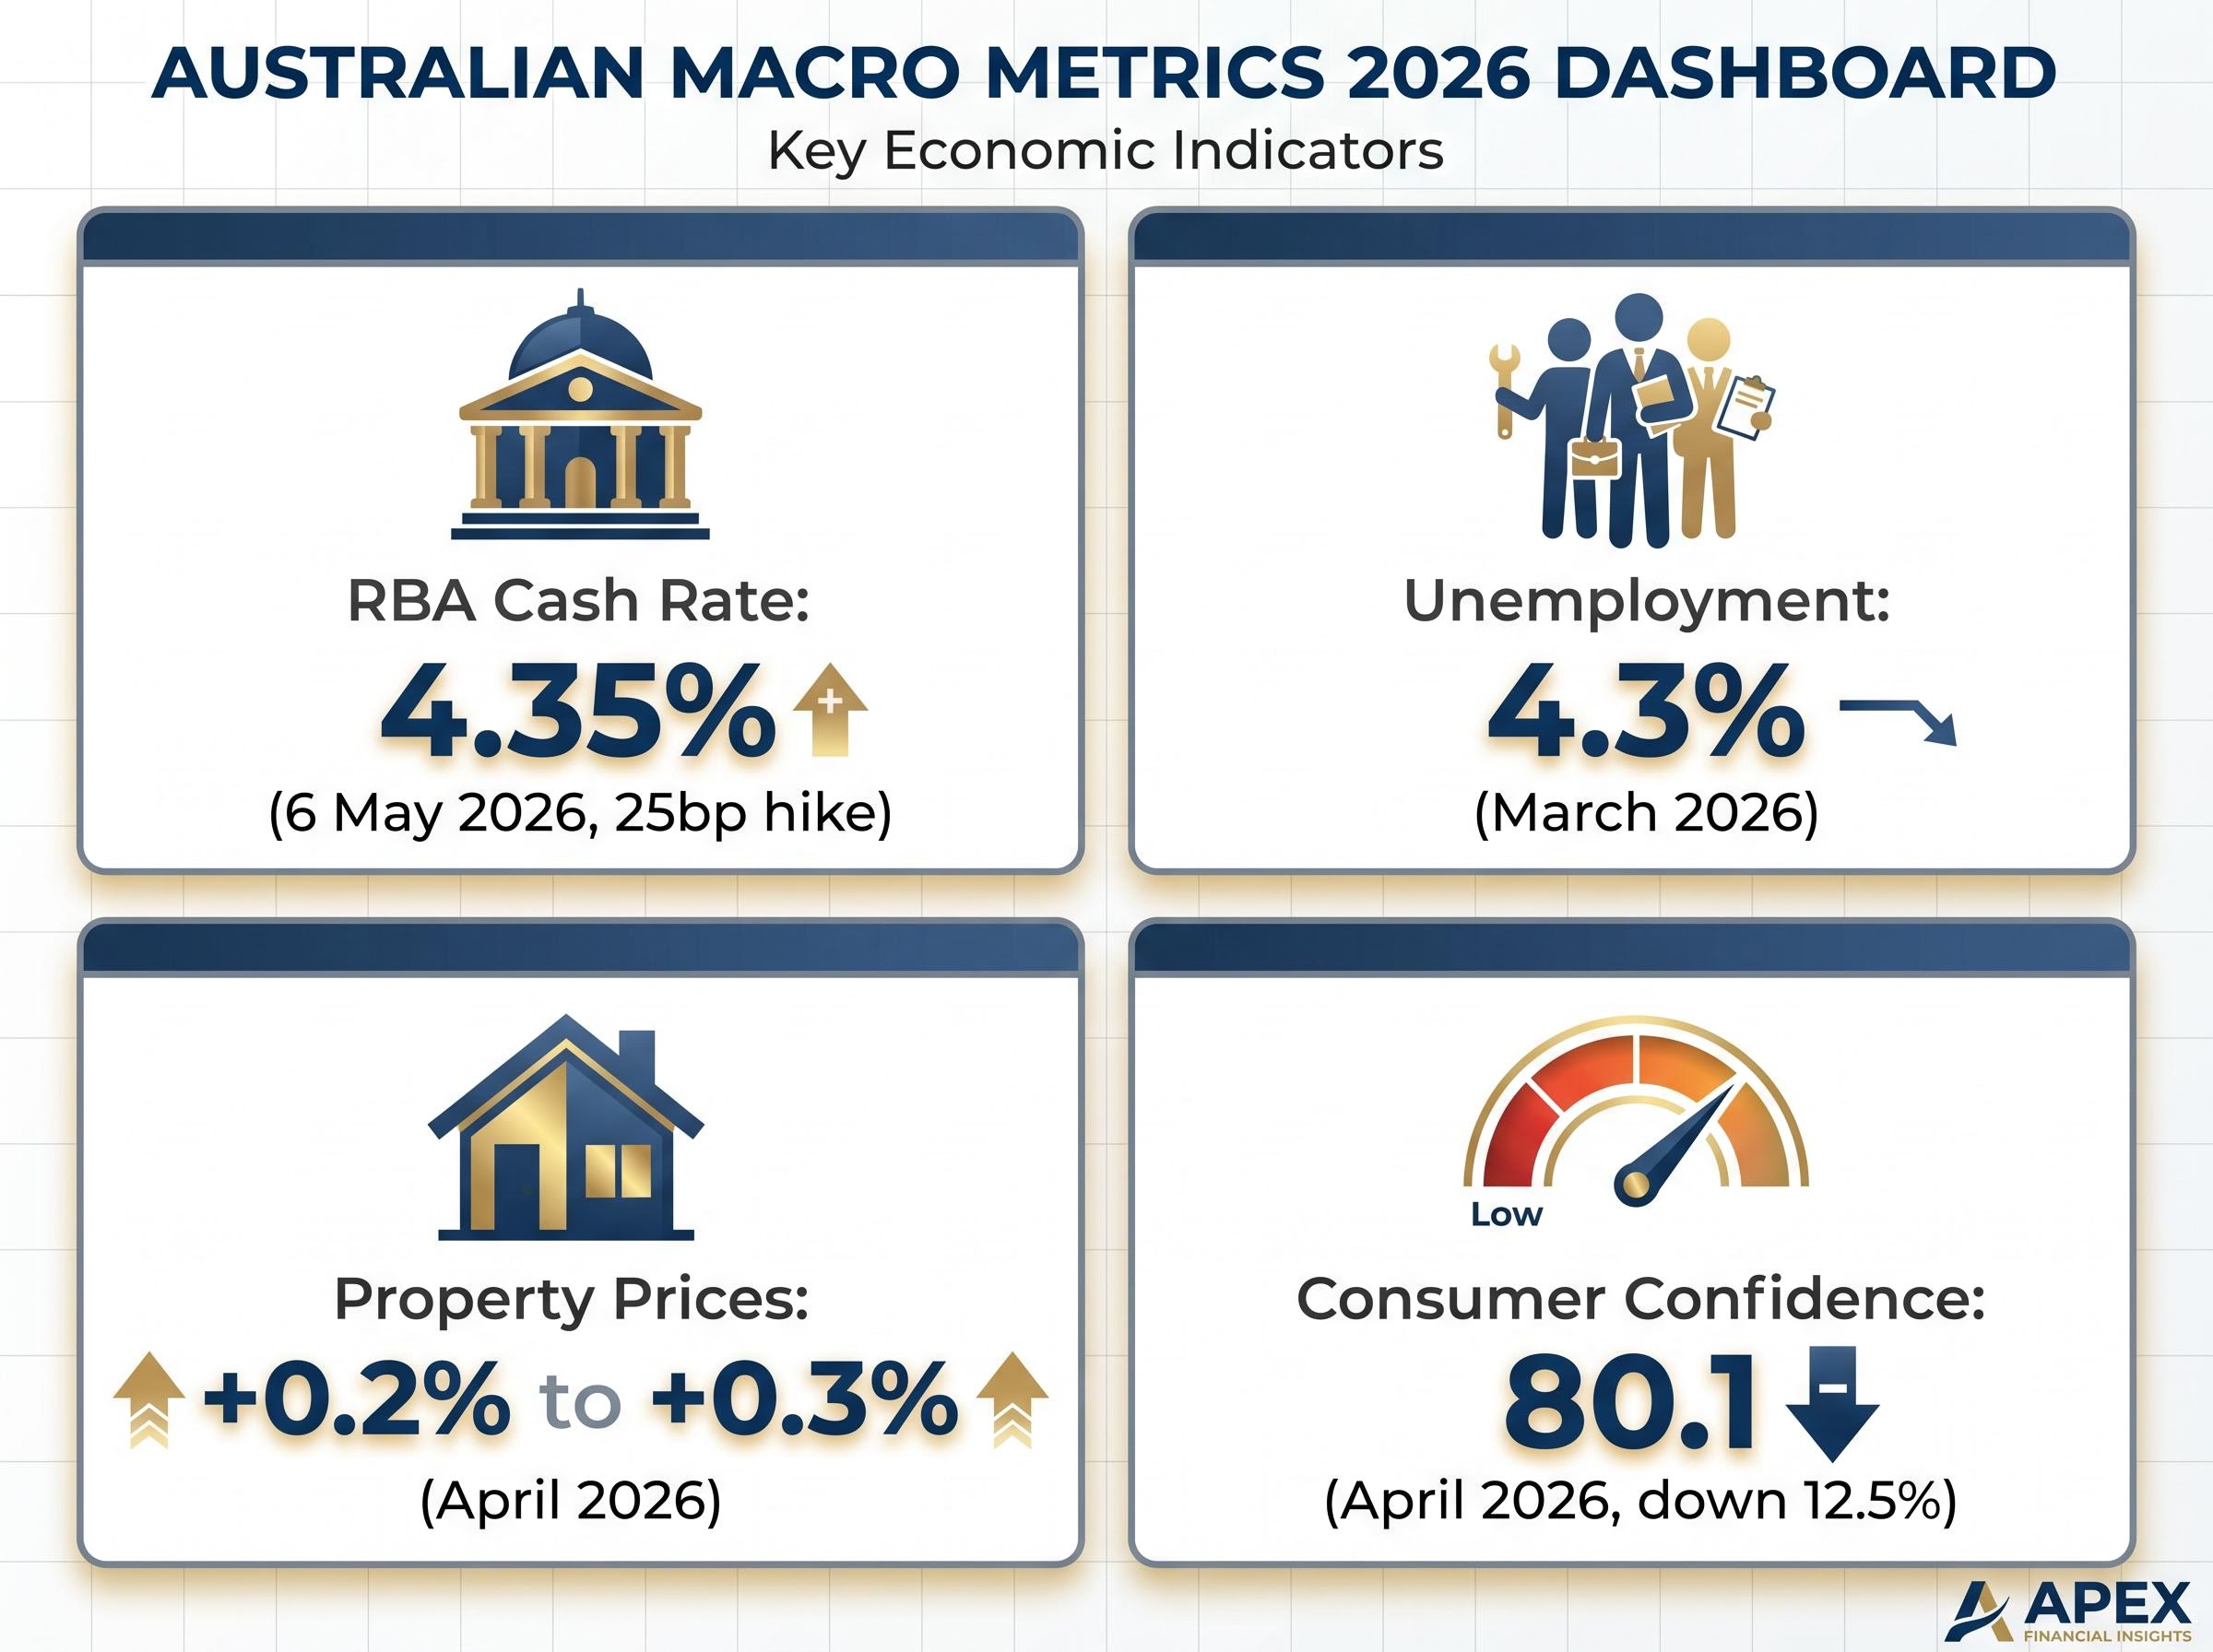
The gap is not new. CBA has traded above textbook fair value for years. But the current macro environment makes it an unusually consequential puzzle. The RBA cash rate sits at 4.35%, consumer confidence has fallen to 80.1, and residential property price momentum is fading. For investors trying to decide whether to buy, hold, or trim a CBA position, understanding why the share price persistently exceeds model outputs is the difference between a confident decision and an uninformed one.
This article explains what professional analysts examine before they open a spreadsheet, why those qualitative factors are doing real work in CBA’s valuation, and how to build a more complete picture of whether the premium is justified.
CBA last traded at approximately $174 to $175.91 in mid-May 2026, placing its market capitalisation at roughly $294 billion. By any standard valuation metric, the stock sits well above where the models say it should.
A simple price-to-earnings approach, applying the Australian banking sector average P/E of 18x to CBA’s FY24 earnings per share of $5.63, produces a fair value of $100.04. A dividend discount model (DDM) using a base-case annual dividend of $4.65 returns $98.33; using a gross dividend inclusive of franking credits ($6.80) stretches the output to $143.80.
| Method | Key Input | Implied Fair Value | Gap to ~$174 |
|---|---|---|---|
| PE-based (sector average) | 18x P/E, $5.63 EPS | $100.04 | ~43% below |
| DDM (base case) | $4.65 dividend | $98.33 | ~44% below |
| DDM (gross dividend) | $6.80 incl. franking | $143.80 | ~17% below |
CBA’s trailing P/E of ~28.3x is more than 55% above the sector average. Its price-to-book ratio of ~3.48 to 3.81x sits well above historical bank norms. Its dividend yield of ~2.76% to 3.11% is modest for a bank of its size.
The DDM is particularly sensitive to input assumptions. Across a range of plausible discount rates and growth rates, the model produces outputs spanning from $52.89 to $238.00, a range so wide it illustrates the limitation of the tool itself.
The sensitivity problem is structural rather than incidental: the DDM applied to ASX income stocks shows that even small shifts in the assumed dividend growth rate produce valuation swings of 30–50%, which is why the model’s output range of $52.89 to $238.00 for CBA is a feature of the methodology, not a failure of the analyst using it.
Every standard model points to a fair value materially below the current price. That gap is the central tension this analysis addresses.
The instinct for many investors is to refine the model inputs. Adjust the discount rate, tweak the growth assumption, run the sensitivity table again. The problem is that more precision in the spreadsheet does not close the gap, because the gap exists for reasons the spreadsheet cannot capture.
P/E and DDM models handle historical earnings, dividend distributions, and investor-required return with reasonable accuracy. They compress a company’s financial track record into a single number. For stable, predictable businesses, that number is a useful anchor.
Bank earnings are unusually sensitive to variables that sit entirely outside financial statements. These include:
The research underlying this analysis recommends over 100 hours of qualitative work before a valuation model is even built. That benchmark signals how much analytical weight professional analysts place outside the spreadsheet. The 10-point gap between CBA’s trailing P/E of 28.3x and the sector average of 18x is not a modelling error. It is the market’s implicit price for qualitative factors that models do not capture.
P/E ratios in ASX bank analysis carry a specific structural flaw that compounds in the current environment: NIM expansion from the 2022–2023 rate-hike cycle has largely played out, meaning investors who anchor to recent earnings-per-share figures when applying a sector-average multiple may be extrapolating a margin tailwind that no longer exists.
The bull case for CBA’s valuation premium rests on a set of specific, identifiable competitive advantages. Understanding what those advantages are, and what an investor needs to believe for them to justify the current price, is not optional.
CBA holds a market-leading retail banking position, and the centrepiece of that position is its deposit franchise. A strong deposit base provides stable, lower-cost funding compared to wholesale market borrowing. When wholesale funding costs rise or become volatile, banks with weaker deposit franchises face margin pressure more acutely. CBA’s deposit quality reduces its reliance on those wholesale markets and provides a structural margin advantage that does not show up cleanly in a single financial ratio.
The broader premium argument extends beyond deposits. Investors who pay 28.3x trailing earnings for CBA, while peers NAB, ANZ, and Westpac trade at lower multiples, are implicitly pricing in a package of qualitative factors:
CBA’s price-to-book ratio of ~3.48 to 3.81x further reflects this premium. The differential between CBA and its major bank peers is the market’s valuation of these intangible strengths, and the investor’s job is to decide whether those strengths are durable enough to sustain it.
The bear case for CBA is not about the quality of the business. It is about the price. At a trailing P/E of 28.3x, the stock leaves almost no margin of safety if any of the following scenarios materialise.
At a trailing P/E of 28.3x, CBA’s share price embeds a quality premium that leaves no room for the credit cycle to turn. The risk is not that CBA is a bad bank; the risk is that the price assumes nothing goes wrong.
Three downside scenarios, ordered by near-term probability given current macro data, deserve close attention:
Each of these risks is grounded in data that already exists. The bear case is where qualitative analysis earns its value, because this is where the models provide no guidance.
The analyst consensus on CBA downside is unusually unified for a stock of this scale: 14 covering analysts hold sell ratings with an average 12-month price target of approximately $125.88, implying around 28% downside from late April 2026 levels, a degree of bearish alignment that is itself a qualitative signal about how institutional investors are pricing the premium.
Four macro variables are most directly relevant to CBA’s near-term earnings trajectory. Each one is a question the analyst is trying to answer, not simply a number to observe.
| Variable | Current Reading | Source | Implication for CBA |
|---|---|---|---|
| RBA cash rate | 4.35% (25bp hike, 6 May 2026) | Reserve Bank of Australia | Supports variable-rate NIM but increases borrower stress and arrears risk |
| Unemployment | 4.3% (March 2026) | ABS | Contained for now; any deterioration would pressure credit quality directly |
| Property prices | +0.2% to +0.3% (April 2026) | Cotality/CoreLogic | Fading momentum reduces collateral support for the mortgage book |
| Consumer confidence | 80.1 (April 2026, down 12.5%) | Westpac-Melbourne Institute | Pessimists outnumber optimists; signals demand fragility and potential arrears pressure |
The cash rate environment creates a dual effect that professional analysts track closely. A 4.35% rate supports CBA’s net interest margin on variable-rate lending, but the same rate increases the debt-servicing burden on borrowers. The longer rates stay elevated, the more the second effect compounds.
The RBA monetary policy decision of 6 May 2026 raised the cash rate target by 25 basis points to 4.35%, with the Board’s accompanying statement citing persistent inflation as the primary rationale, reinforcing the view that rates are likely to remain elevated long enough to compound borrower stress across variable-rate mortgage books.
Unemployment at 4.3% remains contained, but the direction matters more than the level. If the labour market softens in the second half of 2026, credit losses could rise faster than current provisioning anticipates.
Sector-wide provisioning forecasts for the Big Four add further weight to this risk: total provisions across the four major banks are forecast to rise from approximately $2.4 billion in FY25 to approximately $5.5 billion by FY27, a trajectory that would pressure earnings across all four institutions even before any individual bank-specific catalyst materialises.
Consumer confidence at 80.1 is a majority-pessimist reading. According to the Westpac-Melbourne Institute Index of Consumer Sentiment, readings below 100 indicate pessimists outnumber optimists. At 80.1, sentiment is significantly depressed, and this metric has historically served as a leading indicator of demand deterioration.
Property price growth of +0.2% to +0.3% in a single month may appear stable, but the trajectory is what matters. Momentum has eased sharply from earlier in the cycle, and for a bank with CBA’s mortgage book concentration, softening collateral values are a variable that models do not price dynamically.
The argument running through this analysis converges on a practical point: a valuation model is a starting point, and the work that distinguishes a confident investment decision from a hopeful one happens afterward.
A structured research sequence for evaluating CBA could follow these steps:
The APRA quarterly ADI statistics for the December 2025 quarter provide the most authoritative public dataset for tracking credit quality, capital ratios, and residential mortgage lending trends across Australia’s major banks, giving analysts a system-wide baseline against which CBA’s individual performance can be benchmarked.
The 100-hour qualitative research benchmark cited earlier is a calibration point, not a requirement for retail investors. But the principle it reflects applies universally: the more time spent understanding the qualitative drivers, the more confident the investment decision.
CBA’s model-based fair value range of $98 to $143 sits 20% to 75% below a market price of approximately $174, depending on the methodology. That gap is not an error to be corrected. It is a signal that qualitative factors, franchise quality, deposit strength, credit resilience, and perceived earnings durability, are doing real work in the market’s valuation of this stock.
The investor’s task is not to dismiss the premium or accept it at face value. It is to decide whether those qualitative factors are durable enough to sustain through the current macro cycle.
A premium that cannot be explained by a model is not irrational. It is an invitation to do more qualitative work.
In an environment of 4.35% rates, softening property prices, and consumer confidence at 80.1, the qualitative case for CBA’s premium will face a live test in the coming reporting periods. That is precisely the kind of moment where a structured analytical framework, rather than a single valuation multiple, earns its value.
This article is for informational purposes only and should not be considered financial advice. Investors should conduct their own research and consult with financial professionals before making investment decisions. Past performance does not guarantee future results. Financial projections are subject to market conditions and various risk factors.
Two professional valuation models applied to CBA's own earnings and dividend data produce fair value estimates of roughly $98 to $143, compared to a market price of approximately $174, implying the stock trades at a significant premium to model-based fair value.
CBA trades at a trailing P/E of approximately 28.3x, compared to the sector average of 18x, because the market prices in qualitative advantages including a strong deposit franchise, historically lower credit losses, consistent return on equity, and perceived earnings resilience that standard valuation models cannot capture.
Applying a DDM to CBA's base-case annual dividend of $4.65 produces a fair value of $98.33, while using the gross dividend inclusive of franking credits of $6.80 stretches the output to $143.80, though the model is highly sensitive to discount rate and growth rate assumptions, producing a range as wide as $52.89 to $238.00.
The three key risks are net interest margin compression from mortgage competition, a credit cycle turn driven by the RBA cash rate sitting at 4.35% increasing borrower stress, and a valuation de-rating if earnings growth disappoints and the stock's elevated P/E becomes difficult to defend.
Investors should assess CBA's deposit franchise strength, competitive dynamics in mortgage pricing, credit quality indicators via APRA data, management forward guidance, and whether macro conditions including consumer confidence at 80.1 and softening property prices are likely to erode the qualitative premium the market currently prices in.


