How the US Government Became Intel’s Investor and Deal Broker
6 mins ago
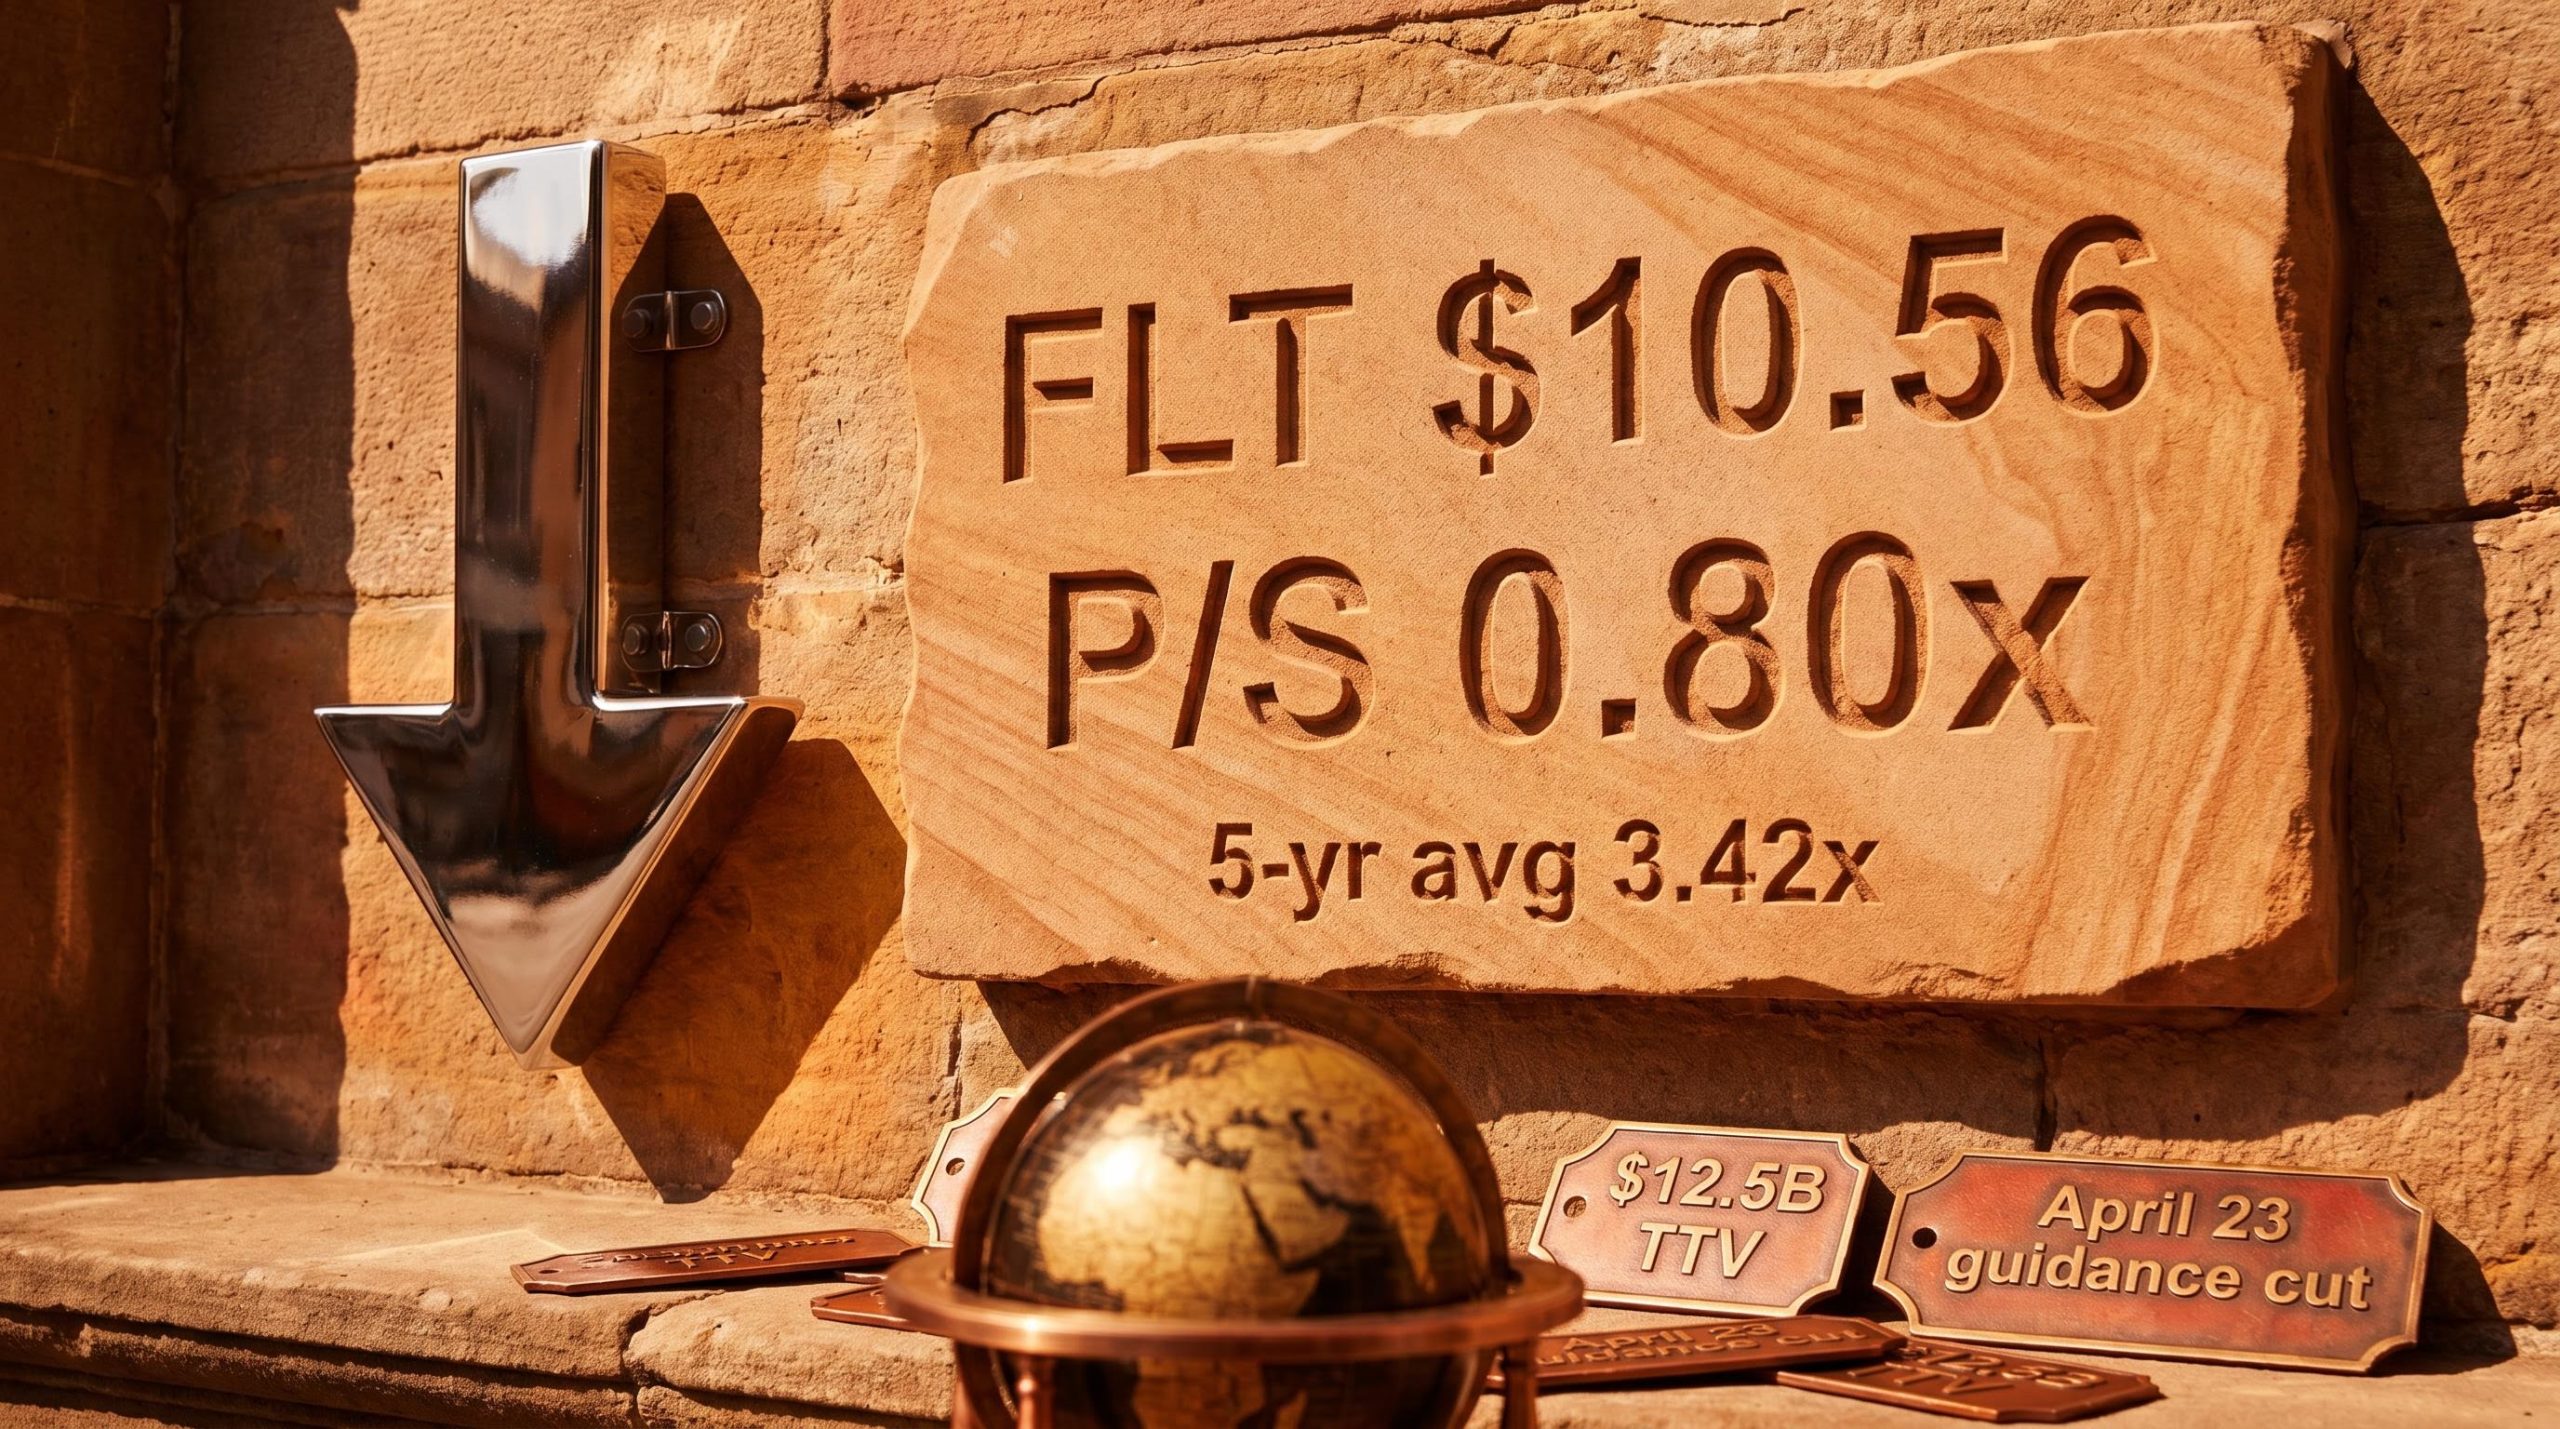
Flight Centre shares are trading at a price-to-sales multiple of 0.80x against a five-year historical average of 3.42x. That is a gap that demands an explanation, not an assumption. The company has spent the past three years executing one of the more credible recoveries on the ASX, growing revenue at a three-year compound annual growth rate (CAGR) of approximately 89.8% and returning to profitability after a net loss of $433 million. Yet the stock is down approximately 10% since the start of 2026, accelerated by an April 23 guidance cut tied to US tariff uncertainty.
The question is whether the market is correctly repricing a business with new structural risks, or over-rotating on a single macro catalyst. What follows is an examination of FLT’s business model, financial performance, capital structure, and current valuation against the 2026 sell-off, giving investors a grounded basis for forming their own view.
The sharpest single catalyst arrived on April 23, 2026, when Flight Centre disclosed that it would not reaffirm its original FY26 underlying profit before tax (UPBT) guidance, a range that had been set at $315-350 million just weeks earlier. US tariff uncertainty was cited as the primary driver. The stock, already under pressure, accelerated its decline.
April 23 guidance cut: Flight Centre’s original FY26 UPBT guidance of $315-$350 million was not reaffirmed, with US tariff uncertainty cited as the primary factor.
That cut, however, landed on a sector that was already derated. The decline has two distinct layers:
The ASX continuous disclosure obligations under Listing Rule 3.1 require listed companies to immediately disclose any information a reasonable person would expect to have a material effect on price, which is the regulatory framework that compelled Flight Centre’s April 23 guidance revision once US tariff uncertainty created a material earnings gap relative to prior guidance.
As of May 11, 2026, FLT trades at $10.56, down approximately 10% year-to-date from levels around $11-12 in late 2025. An interim fully franked dividend of $0.12 per share (ex-date March 25, 2026) provided no sustained price floor.
Separating the sector sentiment from the company-specific earnings revision is where the analytical work begins.
The 1H FY26 results, which confirmed TTV of $12.5 billion, UPBT of $124.6-125 million, and a 9% dividend increase alongside reaffirmed guidance, form the operational baseline from which the April guidance cut represents a meaningful departure.
Flight Centre is not a travel agency in the way most retail investors picture one. The business operates across more than 80 countries under multiple brand identities, spanning leisure retail storefronts, corporate travel management, premium leisure, meetings and events, and a growing payments technology arm.
The major business segments:
FCM Meetings and Events expansion into the UK market advanced in March 2026 with the acquisition of Fresh Approach, a 65-person brand experience agency with £18 million in forecast turnover, bringing previously outsourced creative and production services in-house and opening cross-sell opportunities across FLT’s 2,200 UK corporate accounts.
This structure distinguishes FLT from pure-play online travel agencies (OTAs). Where an OTA earns commission on volume, FLT retains physical consultation points and a corporate division that produces contracted, recurring revenue. The World360 Rewards loyalty programme adds a retention layer, particularly with younger travellers.
FCM, the corporate travel management division, is the higher-margin, more resilient segment. Total transaction value (TTV) per employee is up approximately 20% since 1H FY24, a productivity signal that reflects AI-enabled workflow automation rather than simple headcount growth.
Corporate travel demand held firm across multiple geographies through 1H FY26. US SME TTV rose 13%. Asia returned to profitability. EMEA expanded. That geographic diversification provides a buffer against softness in any single market, a feature that matters more in a tariff-disrupted environment.
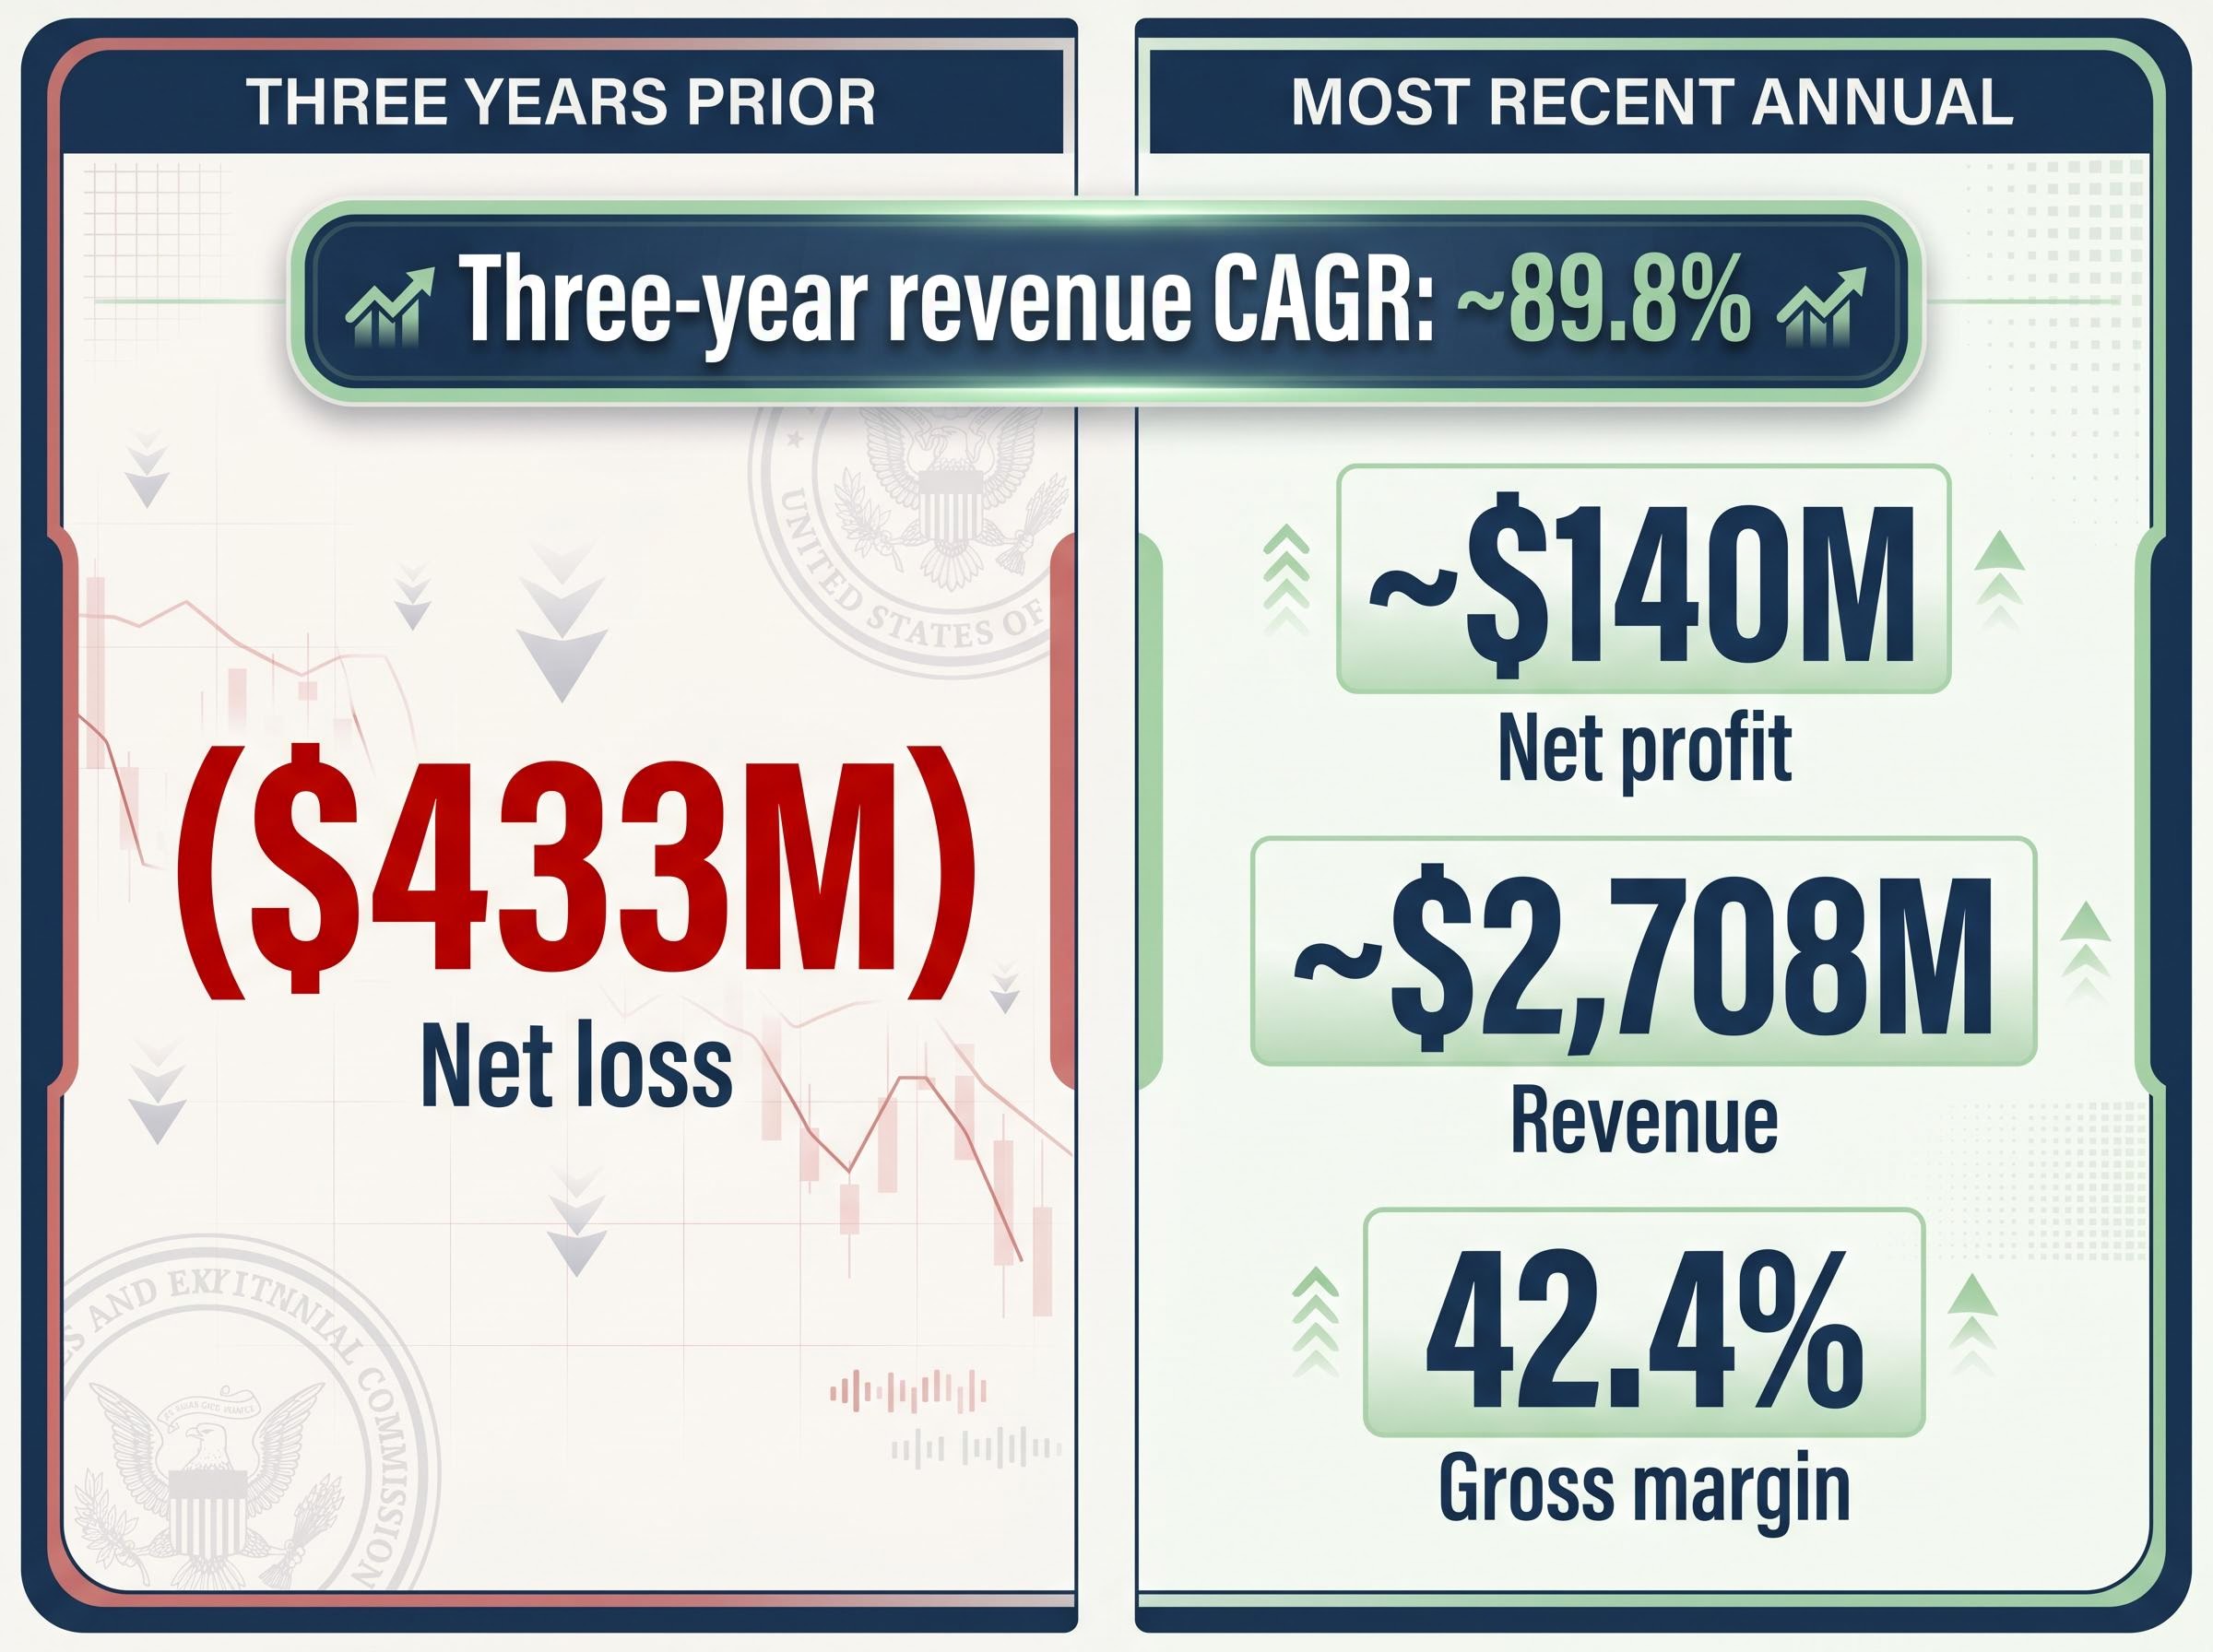
Three years ago, Flight Centre reported a net loss of approximately $433 million. The most recent annual figures show revenue of approximately $2,708 million, net profit of approximately $140 million, and a gross margin of 42.4%. The three-year revenue CAGR of approximately 89.8% reflects a business rebuilding volume from a COVID floor; that rate of growth is expected to decelerate.
The more instructive data sits in the 1H FY26 results. UPBT came in at $124.6-125 million, up approximately 4% year-on-year. TTV reached $12.5 billion, up 7%. The leverage signal is the ratio between the two: UPBT grew approximately 20% on only 6% TTV growth when measured against the efficiency gains management has been reporting.
Global COO Melissa Elf: “Profit growth exceeds TTV… working smarter, not harder.”
That characterisation points to scale efficiencies driven by the Melon platform, Float payments, and AI-enabled workflow automation, not simply volume recovery.
The most recent nine-month trading update shows TTV reaching $19.5 billion (up 7.6%) and UPBT of $226.4 million (up 9.7%), with the corporate division delivering 23% profit growth on only 4% TTV growth, a leverage ratio that reinforces the operating efficiency thesis outlined in the 1H results.
| Metric | Three years prior | Most recent annual | 1H FY26 (half-year) |
|---|---|---|---|
| Net profit / (loss) | ($433M) | ~$140M | N/A (UPBT: $124.6-125M) |
| Revenue | COVID-impaired | ~$2,708M | Partial period |
| Gross margin | Compressed | 42.4% | Stable |
| TTV | Severely reduced | Record levels | $12.5B (+7% YoY) |
For a stock that has sold off 10%, these financials are the counterweight. The underlying numbers show a business with improving margins and operating leverage. The sell-off case rests almost entirely on the forward guidance cut rather than on evidence of structural deterioration.
The balance sheet carries real weight for a cyclical business operating in a higher-rate environment, but the numbers suggest calibrated leverage rather than reckless expansion.
The $0.12 interim dividend, fully franked and paid April 16, 2026, carries specific after-tax value for Australian resident investors. Sustainability, however, is contingent on FY26 full-year earnings, which remain uncertain following the guidance cut.
The $85 million in capex toward AI and platform development represents a strategic bet on margin expansion, not a defensive spending pattern. Investors should weigh that allocation against near-term free cash flow, particularly given the unconfirmed revised UPBT range. No share buybacks or equity raises have been announced as of May 2026.
The price-to-sales (P/S) ratio, which measures a company’s share price relative to its revenue per share, is currently sitting at 0.80x for FLT. The five-year historical average is 3.42x. That gap is the analytical centrepiece of this story.
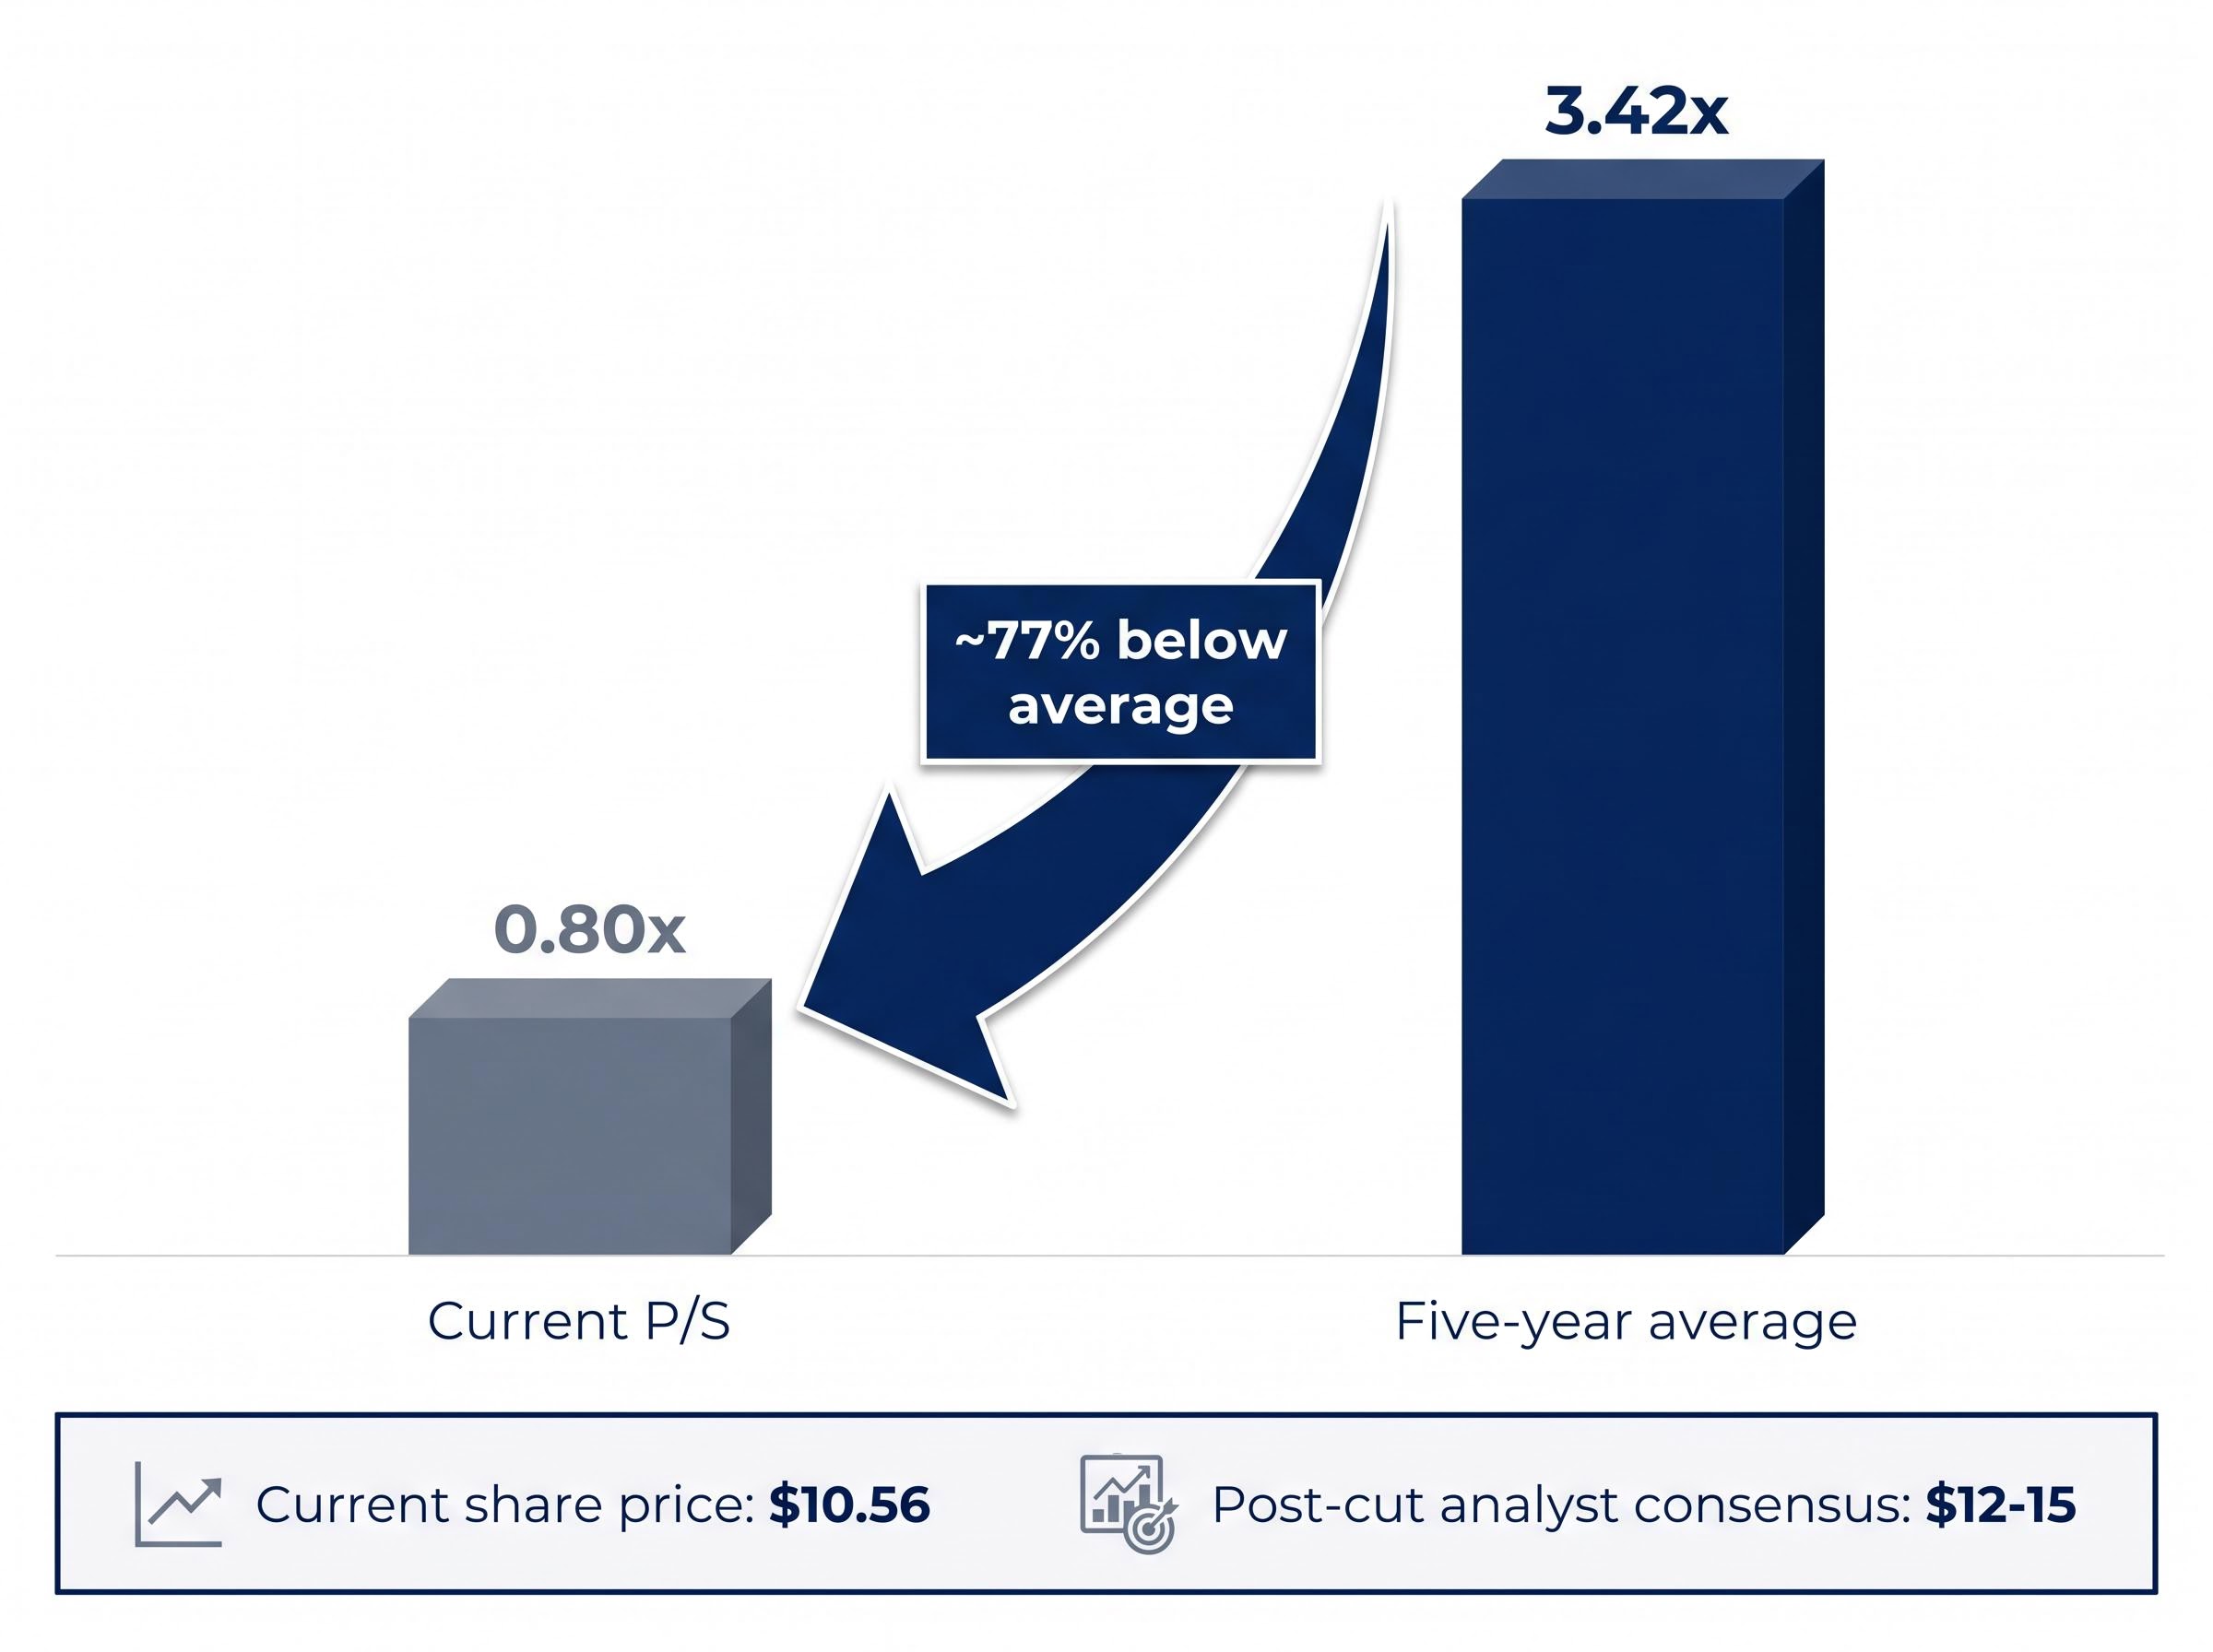
The valuation question: FLT’s current P/S of 0.80x sits at less than a quarter of its five-year average of 3.42x. Either the market is pricing in sustained structural impairment, or the stock is materially undervalued relative to its own history.
| Metric | Current | Five-year average | Implied gap |
|---|---|---|---|
| Price-to-sales ratio | 0.80x | 3.42x | ~77% below average |
| Share price | $10.56 | N/A | N/A |
| Revenue base | ~$2,708M | Varies | N/A |
Post-guidance cut analyst price targets sit in the range of approximately $12-15, implying upside from the current $10.56. Those targets, however, embed revised earnings assumptions that reflect the April cut. Pre-cut broker targets cited at much higher levels are not consistent with current conditions and should be disregarded.
The P/S ratio is a directional indicator, not a definitive valuation call. Discounted cash flow (DCF) and dividend discount models (DDM) are the more rigorous tools for testing whether the gap is justified. A low multiple is a starting point for analysis, not a conclusion.
The operational case, efficiency gains, margin expansion, and a robust corporate pipeline, is intact at the 1H FY26 level. The guidance cut introduces genuine forward uncertainty that a P/S analysis alone cannot resolve.
The five variables that will determine whether the current price reflects opportunity or fair value:
The legal landscape around US tariff authority shifted materially in early May 2026, with two federal courts striking down the broadest statutory bases for executive tariff power within three months; that judicial trajectory matters for any investor trying to size the probability that the guidance-cut catalyst persists into the second half.
The primary source for any revised earnings guidance is FLT’s ASX filings, available at fctgl.com/investors. Investors should monitor this directly for H2 FY26 trading updates and any confirmation of the revised UPBT range. RBA economic outlooks and IMF 2026 forecasts for travel demand provide the macro framing.
Both the bull and bear arguments have genuine supporting evidence. The question is which set of assumptions proves correct over the coming quarters.
| Bull case | Bear case |
|---|---|
| P/S at 0.80x vs. five-year average of 3.42x | Guidance cut introduces real forward earnings uncertainty |
| Operating leverage: UPBT +20% on 6% TTV growth | Debt-to-equity at 84.1% in a rate-sensitive environment |
| Corporate travel pipeline robust across US, EMEA, Asia | OTA competition applying ongoing yield pressure |
| AI-driven margin expansion thesis intact | Revised FY26 UPBT range remains unconfirmed |
| Post-cut analyst consensus of $12-15 above current price | Historical P/S average may not be a reliable anchor if the model has structurally changed |
Investors assessing FLT at these levels should apply DCF or DDM analysis and review current ASX filings before acting. The operational recovery is supported by data. The forward earnings path is not.
The recovery is real. Revenue rebuilt from a COVID floor at a three-year CAGR of approximately 89.8%, margins improved, and the 1H FY26 efficiency data showed a business generating more profit per dollar of transaction value. The P/S ratio at 0.80x against a five-year average of 3.42x is a genuine anomaly worth investigating.
What the data cannot yet resolve is the forward earnings trajectory. The April 23 guidance cut introduced uncertainty that the valuation signal alone does not answer. Investors considering FLT at $10.56 should review ASX filings directly at fctgl.com/investors, consult RBA and IMF outlooks for macro context, and apply DCF or DDM modelling as the appropriate next step.
This article is for informational purposes only and should not be considered financial advice. Investors should conduct their own research and consult with financial professionals before making investment decisions. Past performance does not guarantee future results. Financial projections are subject to market conditions and various risk factors.
A price-to-sales ratio measures a company's share price relative to its revenue per share, giving investors a sense of how much the market is paying for each dollar of revenue. For Flight Centre, the current P/S of 0.80x sits roughly 77% below its five-year historical average of 3.42x, flagging a significant valuation gap that investors are examining closely.
On April 23, 2026, Flight Centre announced it would not reaffirm its original FY26 underlying profit before tax guidance range of $315-$350 million, citing US tariff uncertainty as the primary driver. This disclosure was required under ASX continuous disclosure obligations once the tariff situation created a material earnings gap relative to prior guidance.
Flight Centre's 1H FY26 results showed total transaction value of $12.5 billion (up 7% year-on-year) and underlying profit before tax of $124.6-$125 million (up approximately 4%), with the nine-month update extending those figures to $19.5 billion TTV and $226.4 million UPBT. The corporate division delivered 23% profit growth on only 4% TTV growth, indicating meaningful operating leverage.
The five key variables are: confirmation of the revised FY26 UPBT range, developments in US tariff policy, RBA interest rate decisions affecting consumer spending and FLT's $283 million net debt, AUD/USD movements affecting inbound demand, and whether H2 FY26 TTV momentum holds across the US, EMEA, and Asia segments.
Flight Centre operates across more than 80 countries through segments including FCM corporate travel management, premium leisure brands Scott Dunn and Iglu, a meetings and events division, and a payments and technology arm encompassing the Float payments platform and Melon omni-channel system. This structure provides contracted recurring revenue from corporate clients alongside the traditional retail leisure business.