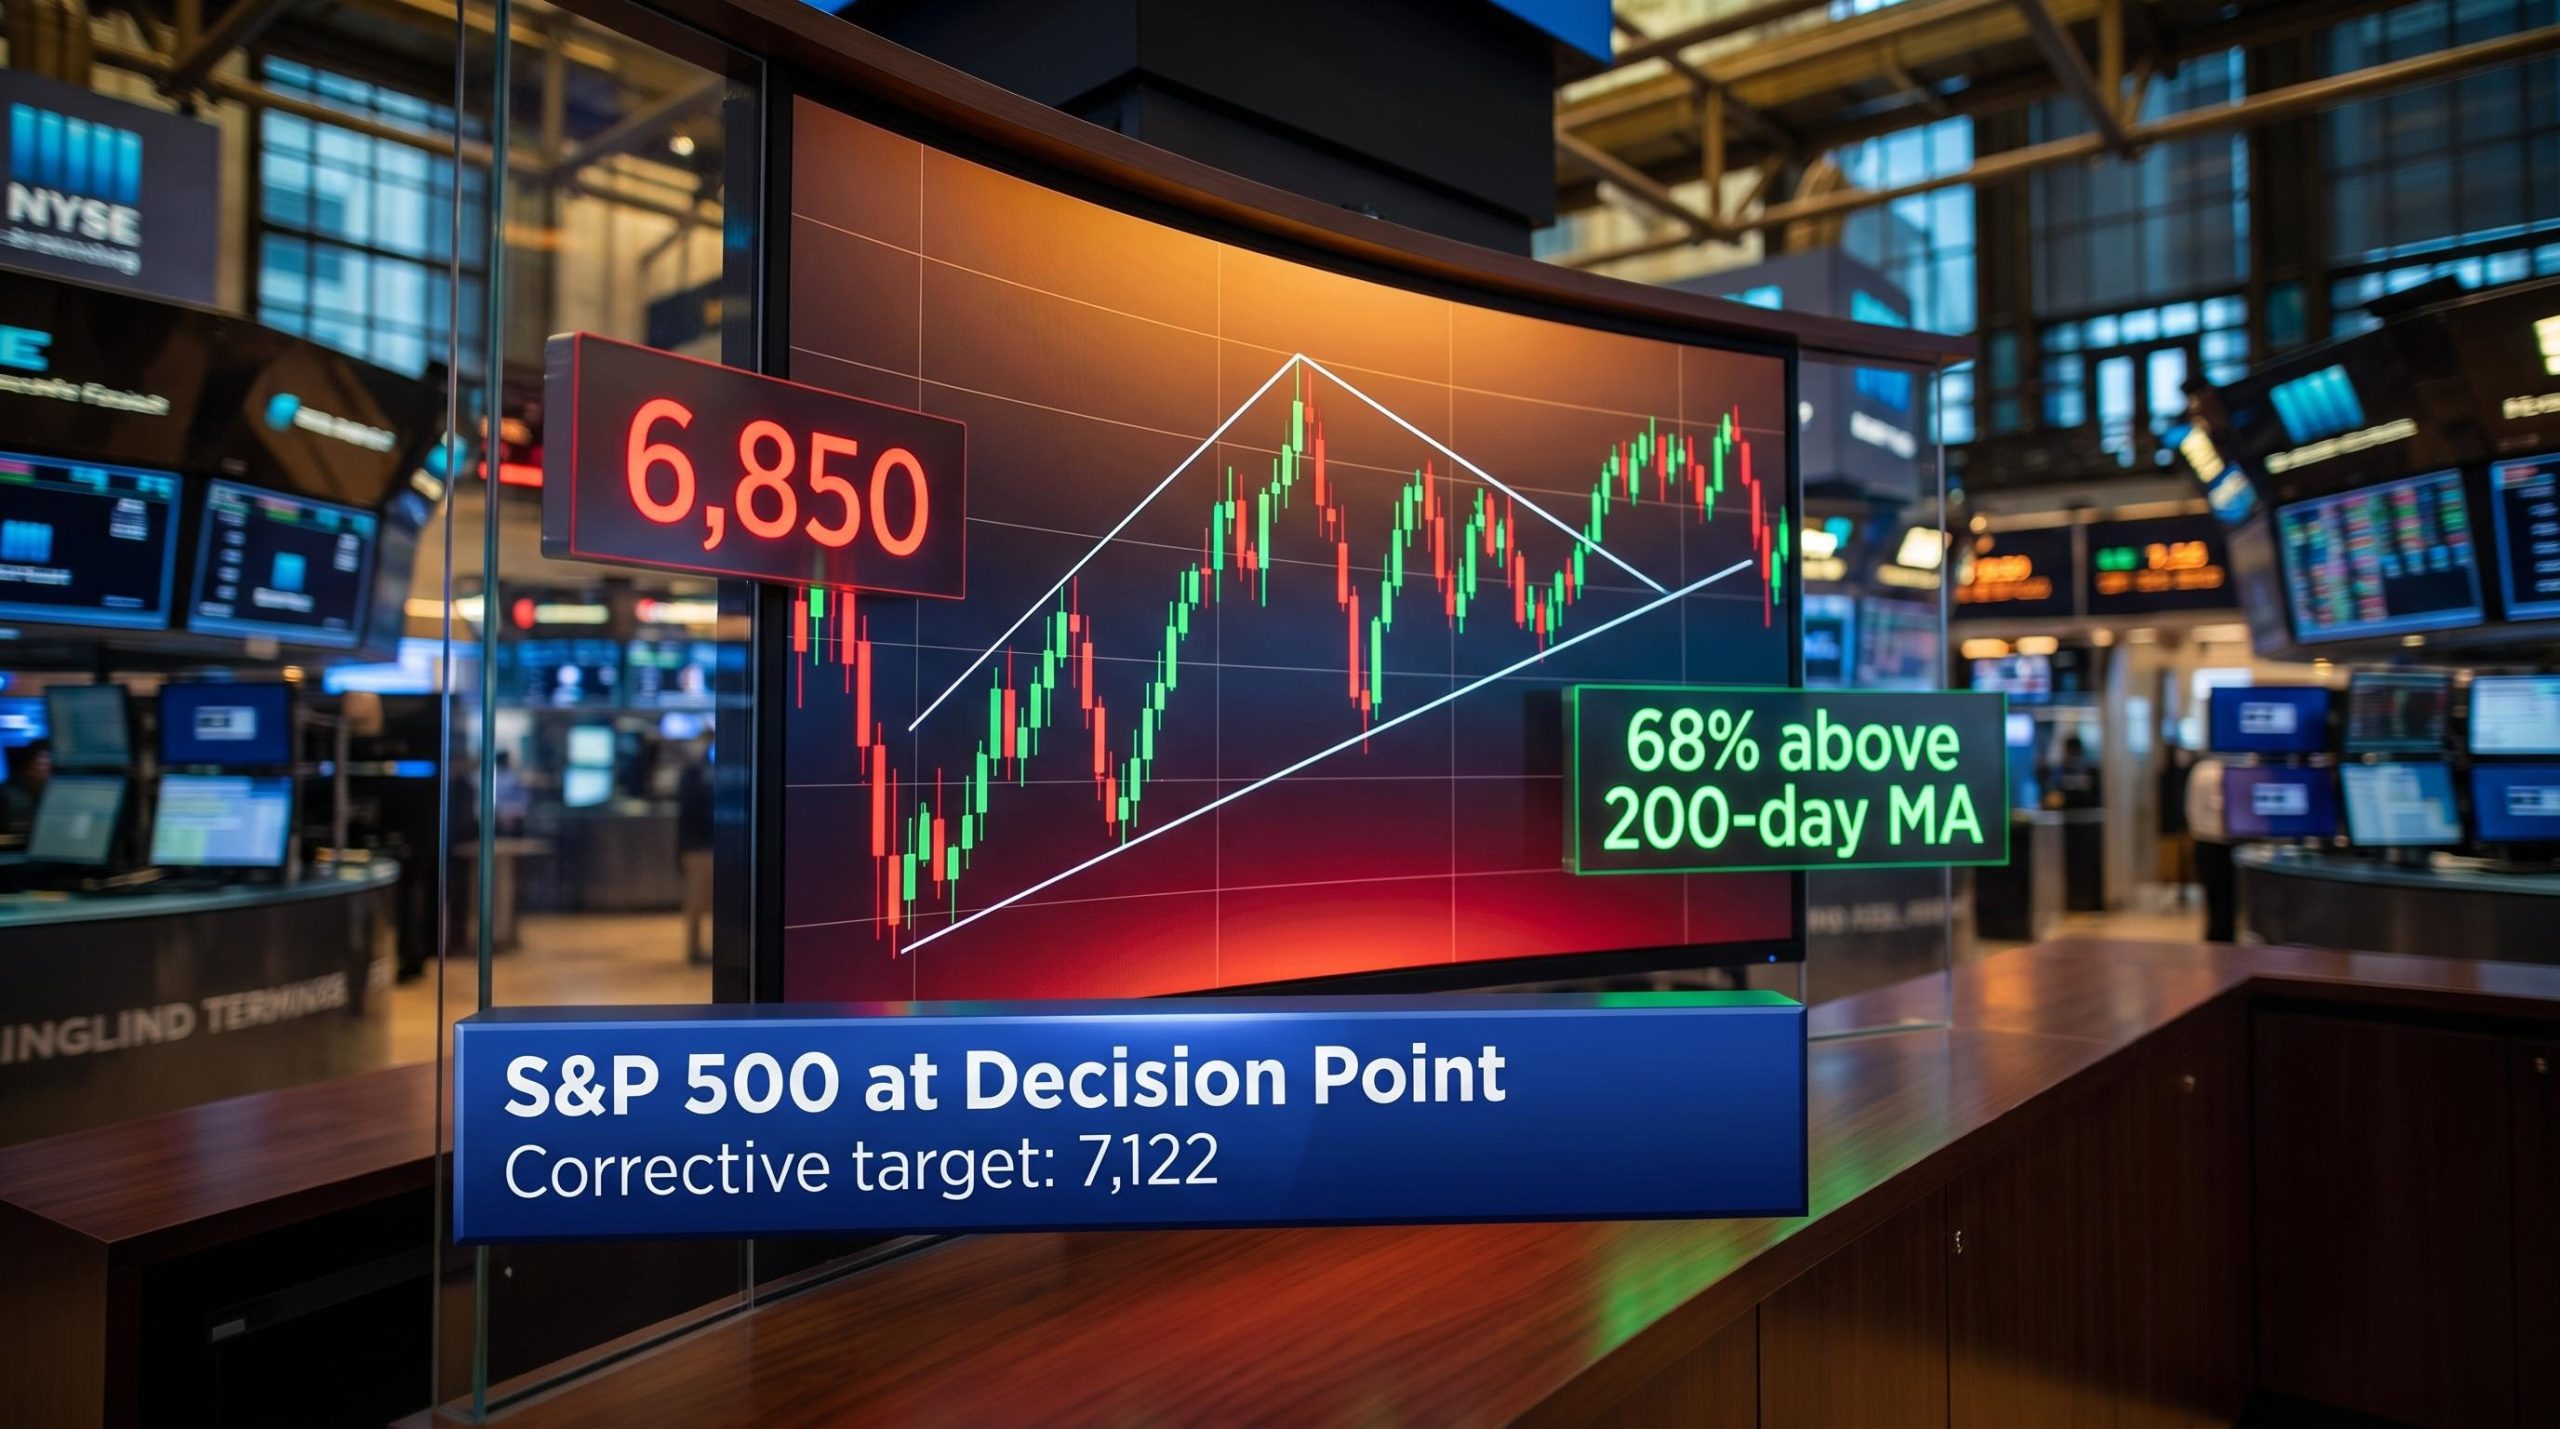
Bank of America technical strategist Paul Ciana has flagged the S&P 500 as sitting at a decision point, with a corrective scenario targeting 6,850 on one side, a healthy continuation pattern on the other, and July price action as the factor that settles it.
The call, reported on 8 July 2026 via Investing.com, follows a 27 May hedge recommendation that proved its worth when the index shed around 5% across the opening weeks of June. That recommendation is now both vindicated and unresolved: the corrective risk has not fully cleared, but internal market health data is making a competing case for resumed upward movement. The index is range-bound, and the range is about to break.
Here is what BofA sees, what each scenario requires to activate, and what to monitor in real time as July unfolds. By the end, you will know exactly which signals confirm the bear case, which confirm the bull case, and what each outcome means for your equity positioning.
BofA’s call in plain terms: cautious, not panicked
This is not a crash prediction. Ciana is presenting a two-scenario decision map: one path leads to a corrective leg lower, the other to a resumed uptrend, and the chart will tell you which one wins. The distinction matters because the investor response to each is fundamentally different.
BofA’s conditional framework fits within a broader late-cycle equity outlook that multiple major asset managers were articulating as early as mid-May 2026, when firms including Morgan Stanley and Bank of America were simultaneously maintaining constructive stances on equities while warning that a 10-20% drawdown would not be surprising given index concentration and valuation levels.
The framework has already proven its value once. On 27 May 2026, Ciana recommended that investors holding long positions either tighten trailing stops or add put protection:
Ciana’s 27 May recommendation: tighten trailing stops or add put protection on existing long positions ahead of expected volatility.
That call was specific, timely, and accurate. The S&P 500 pulled back approximately 5% during the first half of June, rewarding investors who acted on it. The fact that the prior recommendation delivered a concrete, measurable outcome raises the stakes for how seriously you should treat the current conditional outlook: corrective risk still live, the bull case not eliminated, and July as the resolution window.
When big ASX news breaks, our subscribers know first
What the chart is actually saying: two patterns, one conflict
Two technically valid interpretations are competing over the same stretch of price action, and neither is obviously wrong. That ambiguity is itself the most important signal.
An uptrend running through April and May gave way to a period of range-bound price action as the calendar turned to late May. Since then, two readings of the sideways action have emerged.
The first is a diamond top, a formation where price first widens into large swings and then narrows, with trendlines diverging then converging into a diamond shape. In technical analysis, this is classified as a bearish reversal pattern: a rejection of new highs that warns of a potential trend change. It is only confirmed when price breaks below the lower boundary on a convincing close with increased volume. Until that happens, the pattern remains a warning, not a verdict.
The second is a triangle continuation, where the same consolidation is read as more orderly sideways movement, a pause before the prior uptrend resumes. Triangles tend to resolve in the direction of the prior trend, which in this case is upward, confirmed by a sustained breakout above resistance.
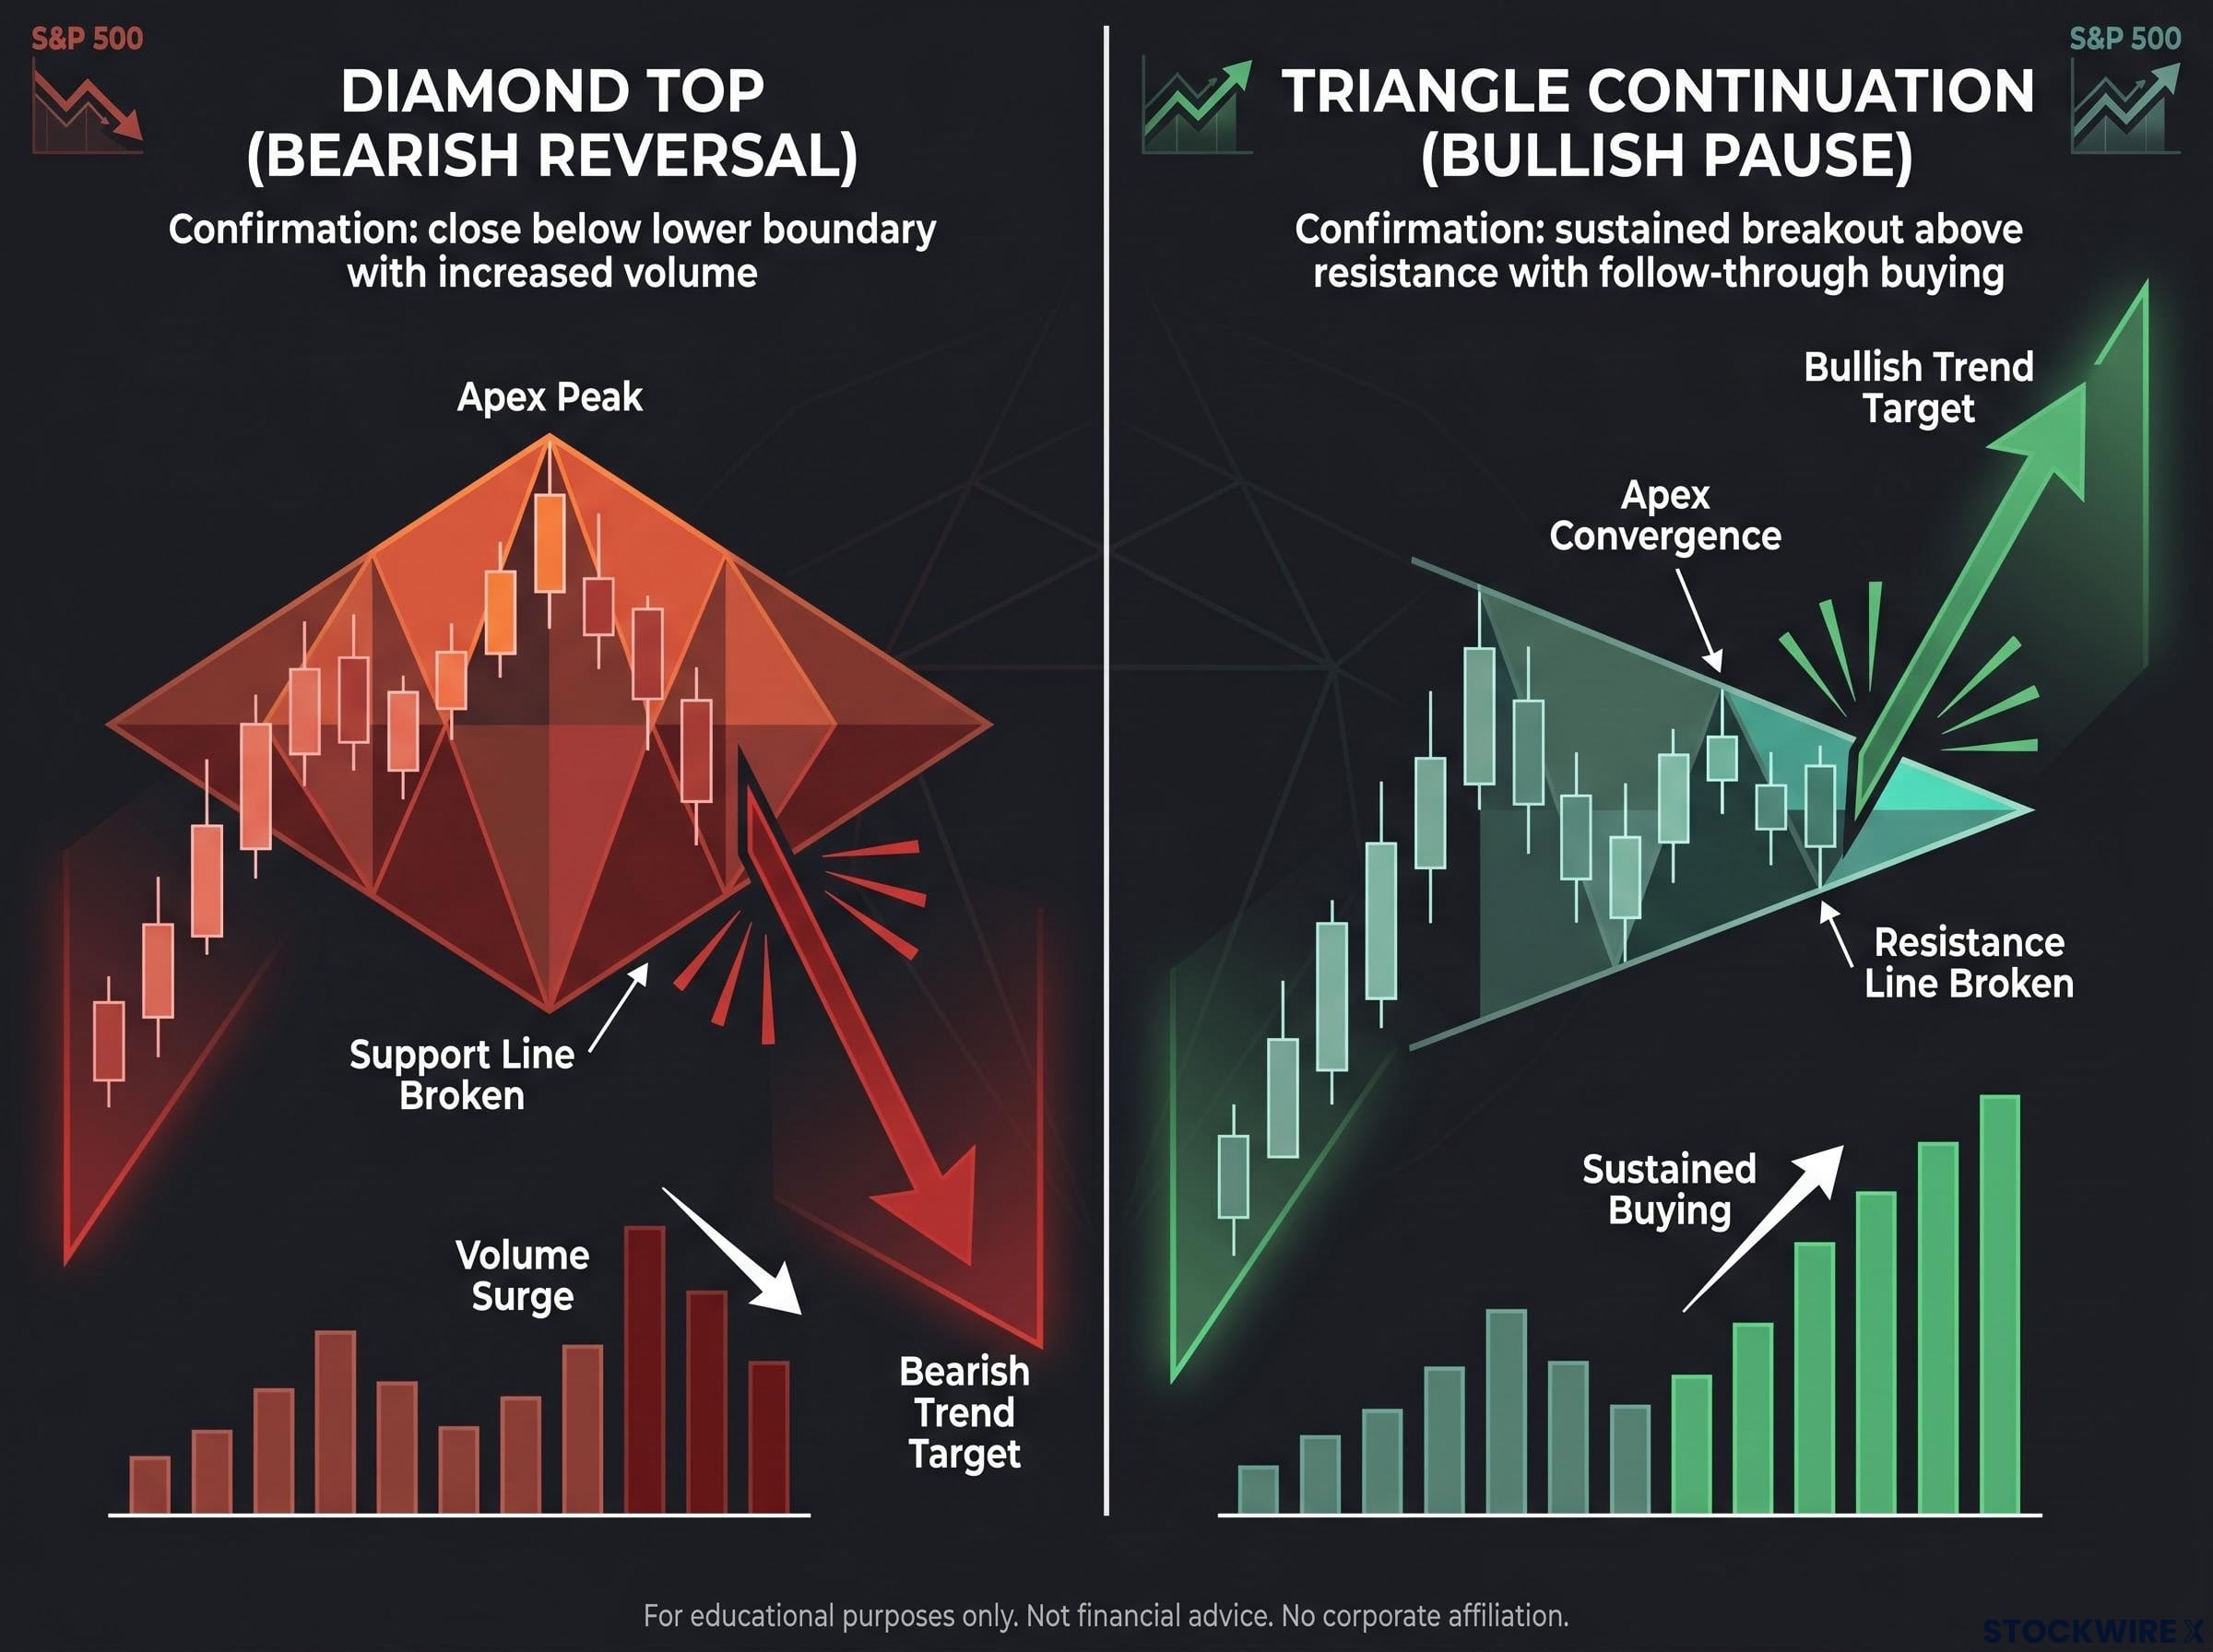
| Pattern | What it signals | Confirmation trigger |
|---|---|---|
| Diamond top | Bearish reversal; potential trend change after April-May rally | Convincing close below lower boundary with increased volume |
| Triangle continuation | Bullish pause; prior uptrend resumes | Sustained breakout above resistance with follow-through buying |
Two experienced analysts can look at the same chart and reach opposite conclusions. That is not a failure of analysis; it is a signal that the range itself is the most important piece of information right now, and breaking it is what tells you which story is true.
Reading the internal signals: what breadth data is telling a different story
The bear case has its chart pattern. The bull case has something arguably harder to dismiss: evidence that the rally is broad, healthy, and structurally sound beneath the surface.
The Advance-Decline Line, which tracks the cumulative difference between the number of stocks advancing and declining each day, has reached a new high. That means more stocks are participating in the uptrend than falling away from it. This is the opposite of what you see before major market tops, which tend to be characterised by narrow leadership where a handful of mega-cap names drag the index higher while the majority of stocks are already rolling over.
- Advance-Decline Line: at a new high, indicating the rally is broad rather than concentrated in a small group of large-cap names
- 200-day moving average participation: approximately 68% of S&P 500 constituent stocks are trading above their 200-day moving averages, a sign of widespread uptrend participation across the index
Roughly 68% of S&P 500 stocks are trading above their 200-day moving averages, a level of participation typically inconsistent with the narrow, late-stage leadership that precedes major market tops.
This breadth strength is the primary reason BofA treats the bull case as credible rather than dismissing it. For you as an investor scanning index-level prices, these internal metrics are the signal beneath the signal. If the Advance-Decline Line starts rolling over while the index holds, that divergence is an early warning that deserves more attention than the headline number alone.
The current picture, with the Advance-Decline Line at a new high and 68% of S&P 500 stocks in uptrends, stands in notable contrast to the narrow breadth readings recorded in early May 2026, when fewer than 22% of index constituents were outperforming on a 30-day basis and historical precedent pointed to an 80% probability of a 5-15% drawdown within 60 days.
The ABC wave count and what a C-wave down actually means
The corrective bear case has a specific shape, and understanding that shape gives you concrete reference levels rather than vague anxiety about “downside risk.”
In Elliott Wave analysis, corrections often unfold in three distinct phases rather than a single drop. These are labelled A, B, and C:
- Wave A (June 2026 decline): The initial selloff, the roughly 5% pullback in the first half of June, represents the first leg down.
- Wave B (current bounce): The recovery phase currently underway. This bounce does not mean the correction is over; in the ABC framework, it is a counter-trend move within a larger corrective sequence.
- Wave C (potential July leg lower): If the pattern completes, a final leg down would target approximately 7,122 on the S&P 500, with a deeper scenario extending into the 6,850-6,968 range.
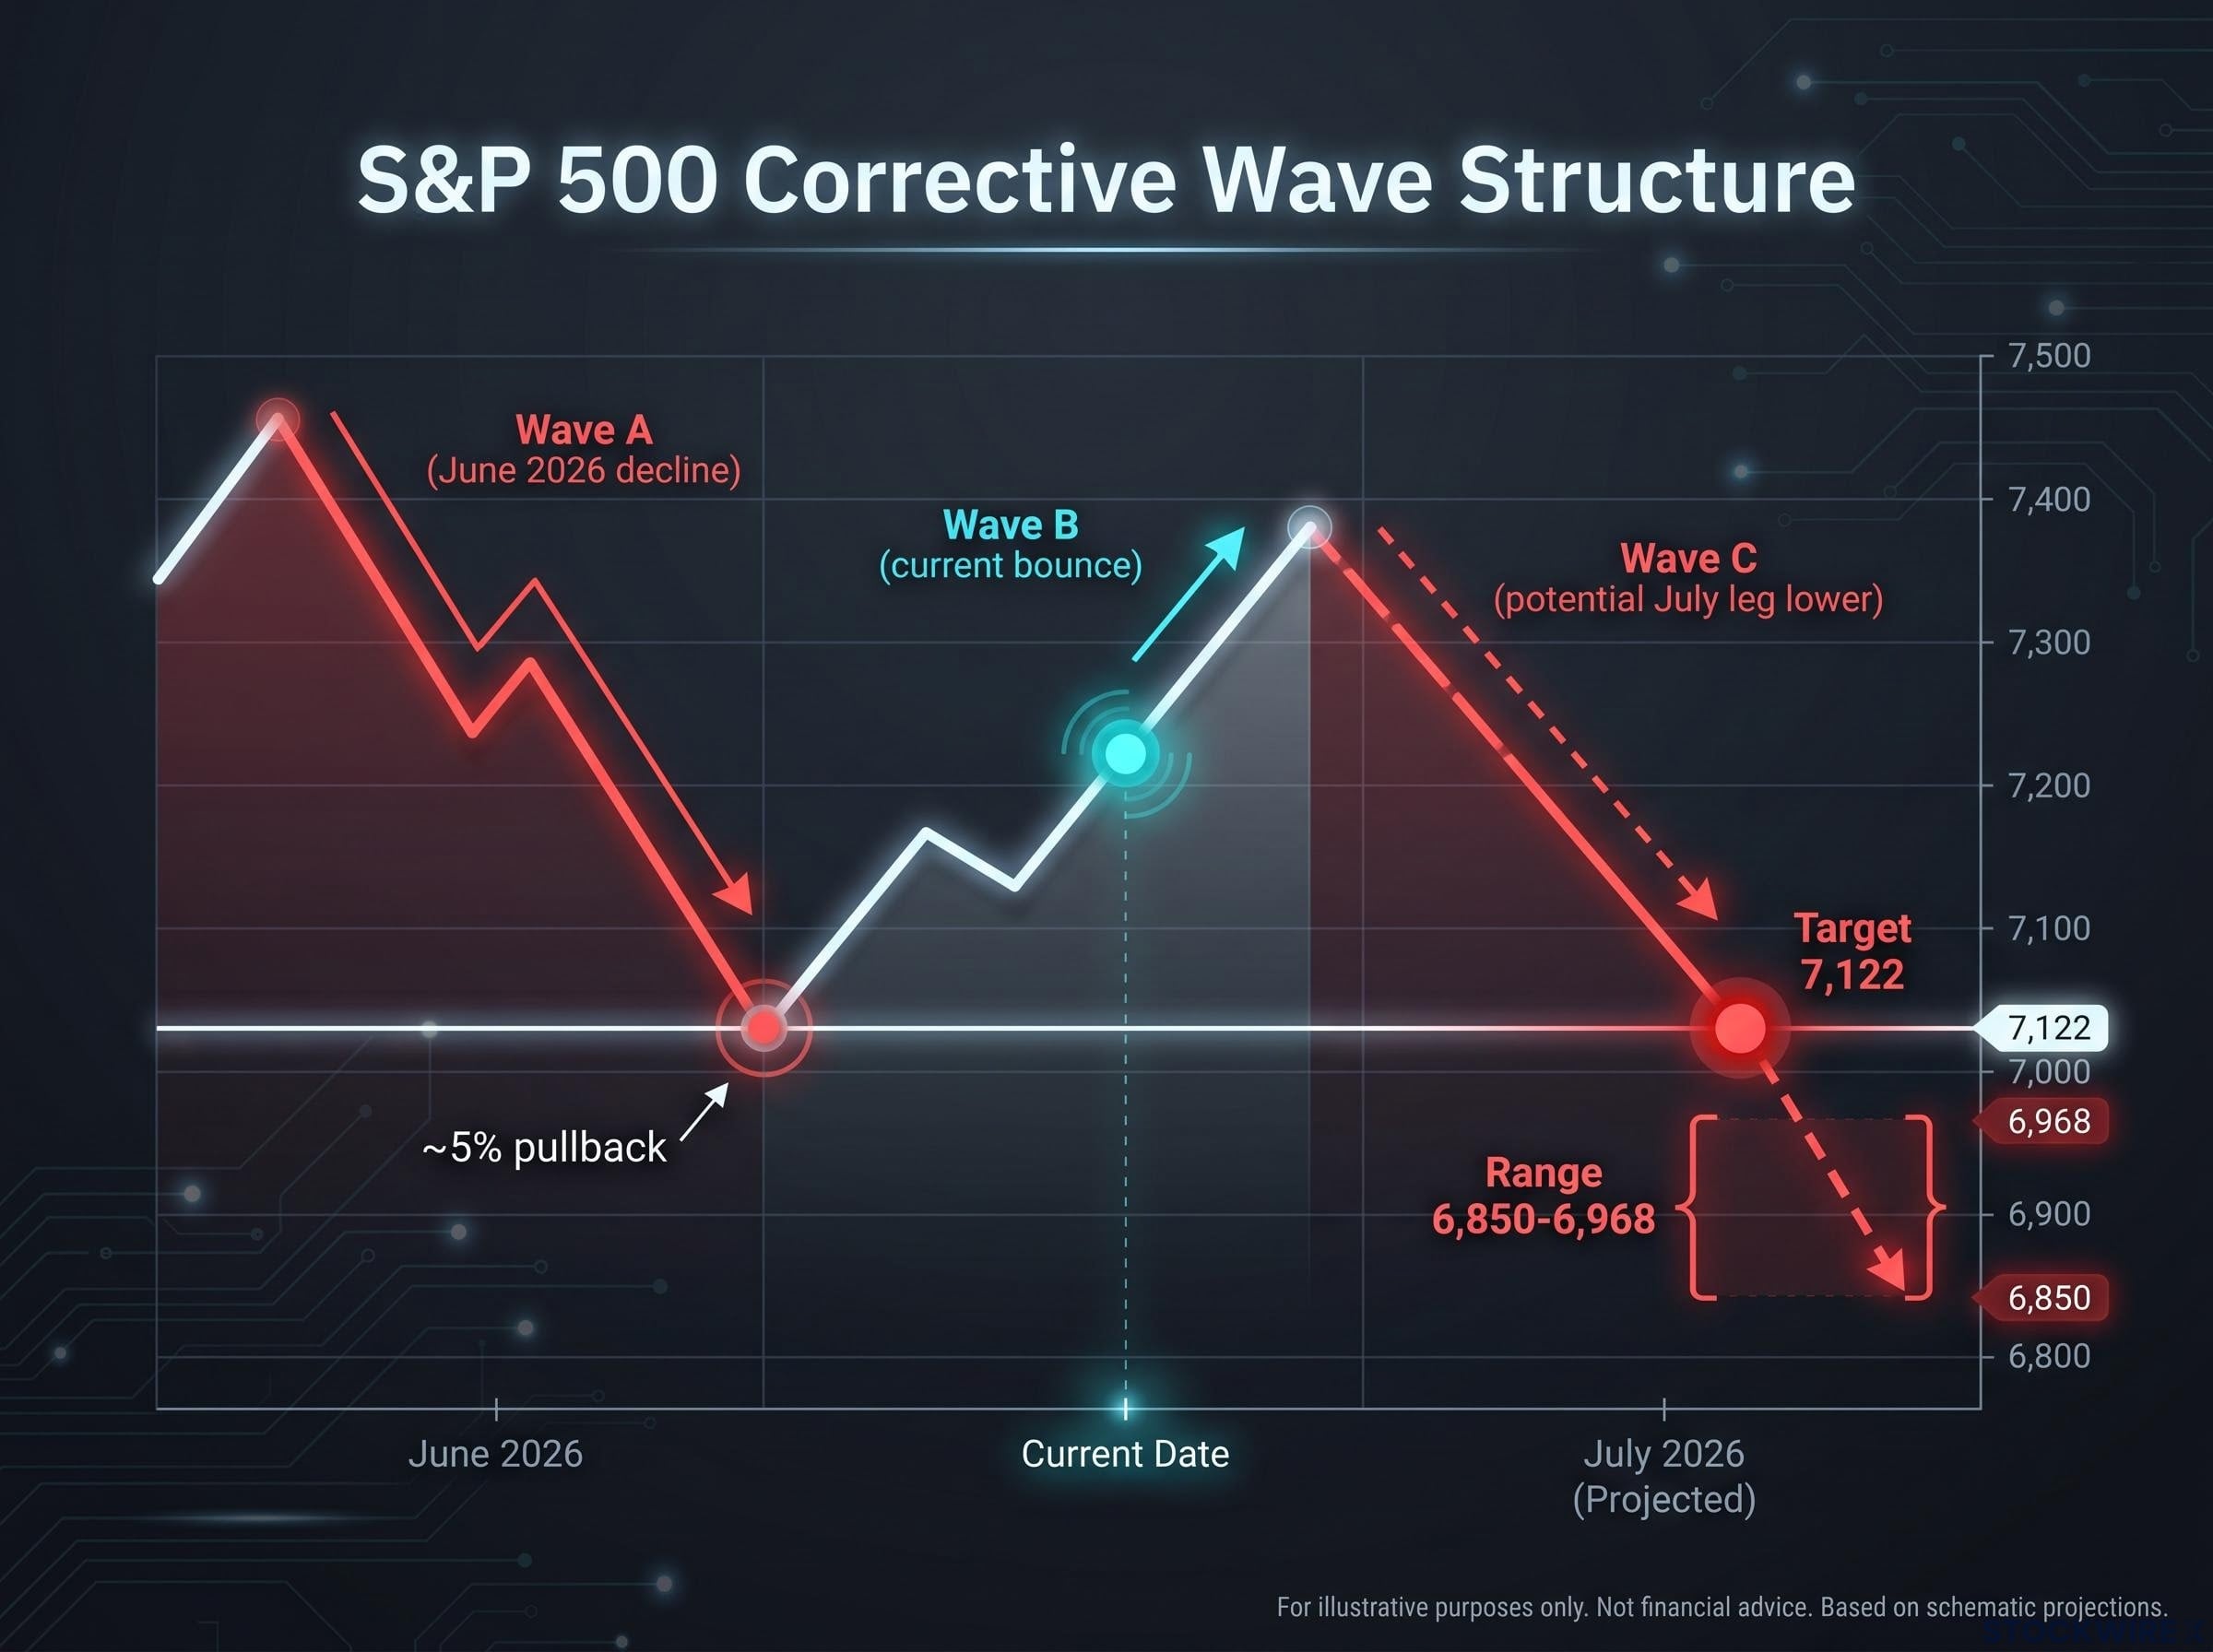
BofA’s corrective targets under the bearish wave count: approximately 7,122, then the 6,850-6,968 range on the S&P 500.
These are not predictions that the index will reach 6,850. They are the reference levels that activate if price breaks the range lower, giving you a concrete framework for pre-defining your response rather than reacting on the fly. If you know what you would do at 7,122 or 6,968 before those levels arrive, you are less likely to make an emotionally reactive decision under pressure.
Why Q3 2026 raises the bar for bulls
There is a seasonal headwind reinforcing the cautious posture. Historically, the third quarter of the second year in the Presidential Cycle has tended to deliver below-average returns for US equities. That does not guarantee weakness, but it raises the confirmation bar: before adding unhedged long exposure, requiring strong, sustained evidence of upside rather than accepting an ambiguous breakout at face value is a reasonable response.
Presidential Cycle seasonality has historically concentrated underperformance in Q3 of the second year, which maps directly onto the current window; the same institutional strategists who document the pattern consistently note that the Q4 recovery tends to be sharp precisely because capital that de-risked during the weak seasonal window re-enters once the political uncertainty clears.
What to watch in July: the signals that decide which scenario wins
The analysis is done. Now you need a monitoring framework. These are the specific, observable signals that tell you which scenario is activating, framed as conditional triggers rather than predictions.
| Scenario | Price signal | Breadth signal | Volatility signal |
|---|---|---|---|
| Bear (correction) | Decisive break below range, particularly through 7,122, on strong volume | Fewer stocks above 200-day MA; Advance-Decline Line rolling over | VIX and realised volatility expanding as selling pressure broadens |
| Bull (continuation) | Sustained close above resistance with follow-through buying | Advance-Decline Line making new highs; 200-day MA participation holding or rising | Pullbacks remaining orderly and shallow above key support |
The conditional structure is the insight here. This is not about predicting July’s direction in advance. It is about pre-assigning meaning to the signals so you can act on confirmation rather than opinion. If price breaks lower and breadth weakens simultaneously, the corrective path is active. If price breaks higher with breadth holding strong, the continuation path is active. Watching for both, rather than betting on one, is how this framework is designed to be used.
What the range break will actually settle
A bearish chart pattern with genuine technical credibility is facing off against internal market health that is difficult to dismiss. The Advance-Decline Line at a new high and 68% of stocks in uptrends do not align with the narrow, deteriorating breadth that typically precedes sustained corrections. But the diamond top formation and the ABC wave count are not noise either; they are specific, structured warnings with defined corrective targets at 7,122 and the 6,850-6,968 range.
Only a sustained directional break, backed by volume and confirmed by breadth, resolves the conflict. The appropriate posture while the range holds is to pre-define your response to both outcomes now, while the decision is calm, rather than reacting under pressure when July delivers its verdict.
For investors wanting to translate the pre-define-your-response framework into specific position-level mechanics, our dedicated guide to portfolio risk management covers beta-weighted sizing and volatility targeting, showing how to calculate your actual market exposure rather than relying on dollar allocation alone.
The question is not whether the S&P 500 will correct or continue. The question is whether you have a plan for both before the range breaks.
This article is for informational purposes only and should not be considered financial advice. Investors should conduct their own research and consult with financial professionals before making investment decisions. These statements regarding corrective targets and scenario outcomes are speculative and subject to change based on market developments and company performance.