Whether AI qualifies as an investment bubble is not an abstract question for anyone holding Nvidia, Microsoft, or a standard S&P 500 index fund at current weightings. If the bubble case is right, the most popular equity exposures in the world are mispriced, and the correction will be severe. If it is wrong, selling now locks in the opportunity cost of a generational infrastructure cycle. The stakes are binary, even if the evidence is not.
Phillip Securities Research published a structured case in 2026 arguing, with specific revenue and valuation data, that the AI investment cycle does not meet the criteria for a speculative bubble. That is not a consensus view. Peer-reviewed academic research has detected speculative dynamics in individual AI-linked names over multi-year windows. Both sides have evidence worth examining.
Here is what the data actually tells you, and what it leaves unsettled, so you can form your own position rather than defaulting to either optimism or scepticism.
What actually defines a bubble, and why the label matters here
The word “bubble” gets attached to any asset that rises fast enough to make observers nervous. That imprecision is not harmless. Misdiagnosing a high-growth cycle as a bubble leads to premature exits; misdiagnosing a bubble as a growth cycle leads to concentrated losses. The distinction shapes whether your risk is systemic or positional, and those require completely different responses.
A genuine financial bubble typically requires three structural features:
- Prices detached from any plausible economic reality: valuations that cannot be justified under any reasonable set of assumptions about future cash flows.
- Investment driven by momentum rather than monetisable demand: capital flowing in because prices are rising, not because the underlying products or services are generating real revenue.
- Speculative excess spreading broadly across the financial system: loose credit standards, rising leverage, and valuation indiscipline spilling beyond the original sector into adjacent asset classes.
All three need to be present for the systemic version of a bubble. If only one or two appear, you may have overpriced pockets or frothy individual names, but the strategic response is position management, not a wholesale exit. That distinction matters for everything that follows.
When big ASX news breaks, our subscribers know first
The revenue foundation that separates AI from the dot-com era
The strongest single piece of evidence against the bubble thesis is the revenue line. During the dot-com era, flagship internet companies carried extreme valuations on minimal or nonexistent revenue, sustained by monetisation narratives that never materialised. The current AI cycle looks different at the most basic level of economic output.
Combined revenue for Anthropic and OpenAI is estimated at US$85 billion in 2026, with projections reaching US$300 billion by 2030 under S-curve growth modelling, according to Phillip Securities Research.
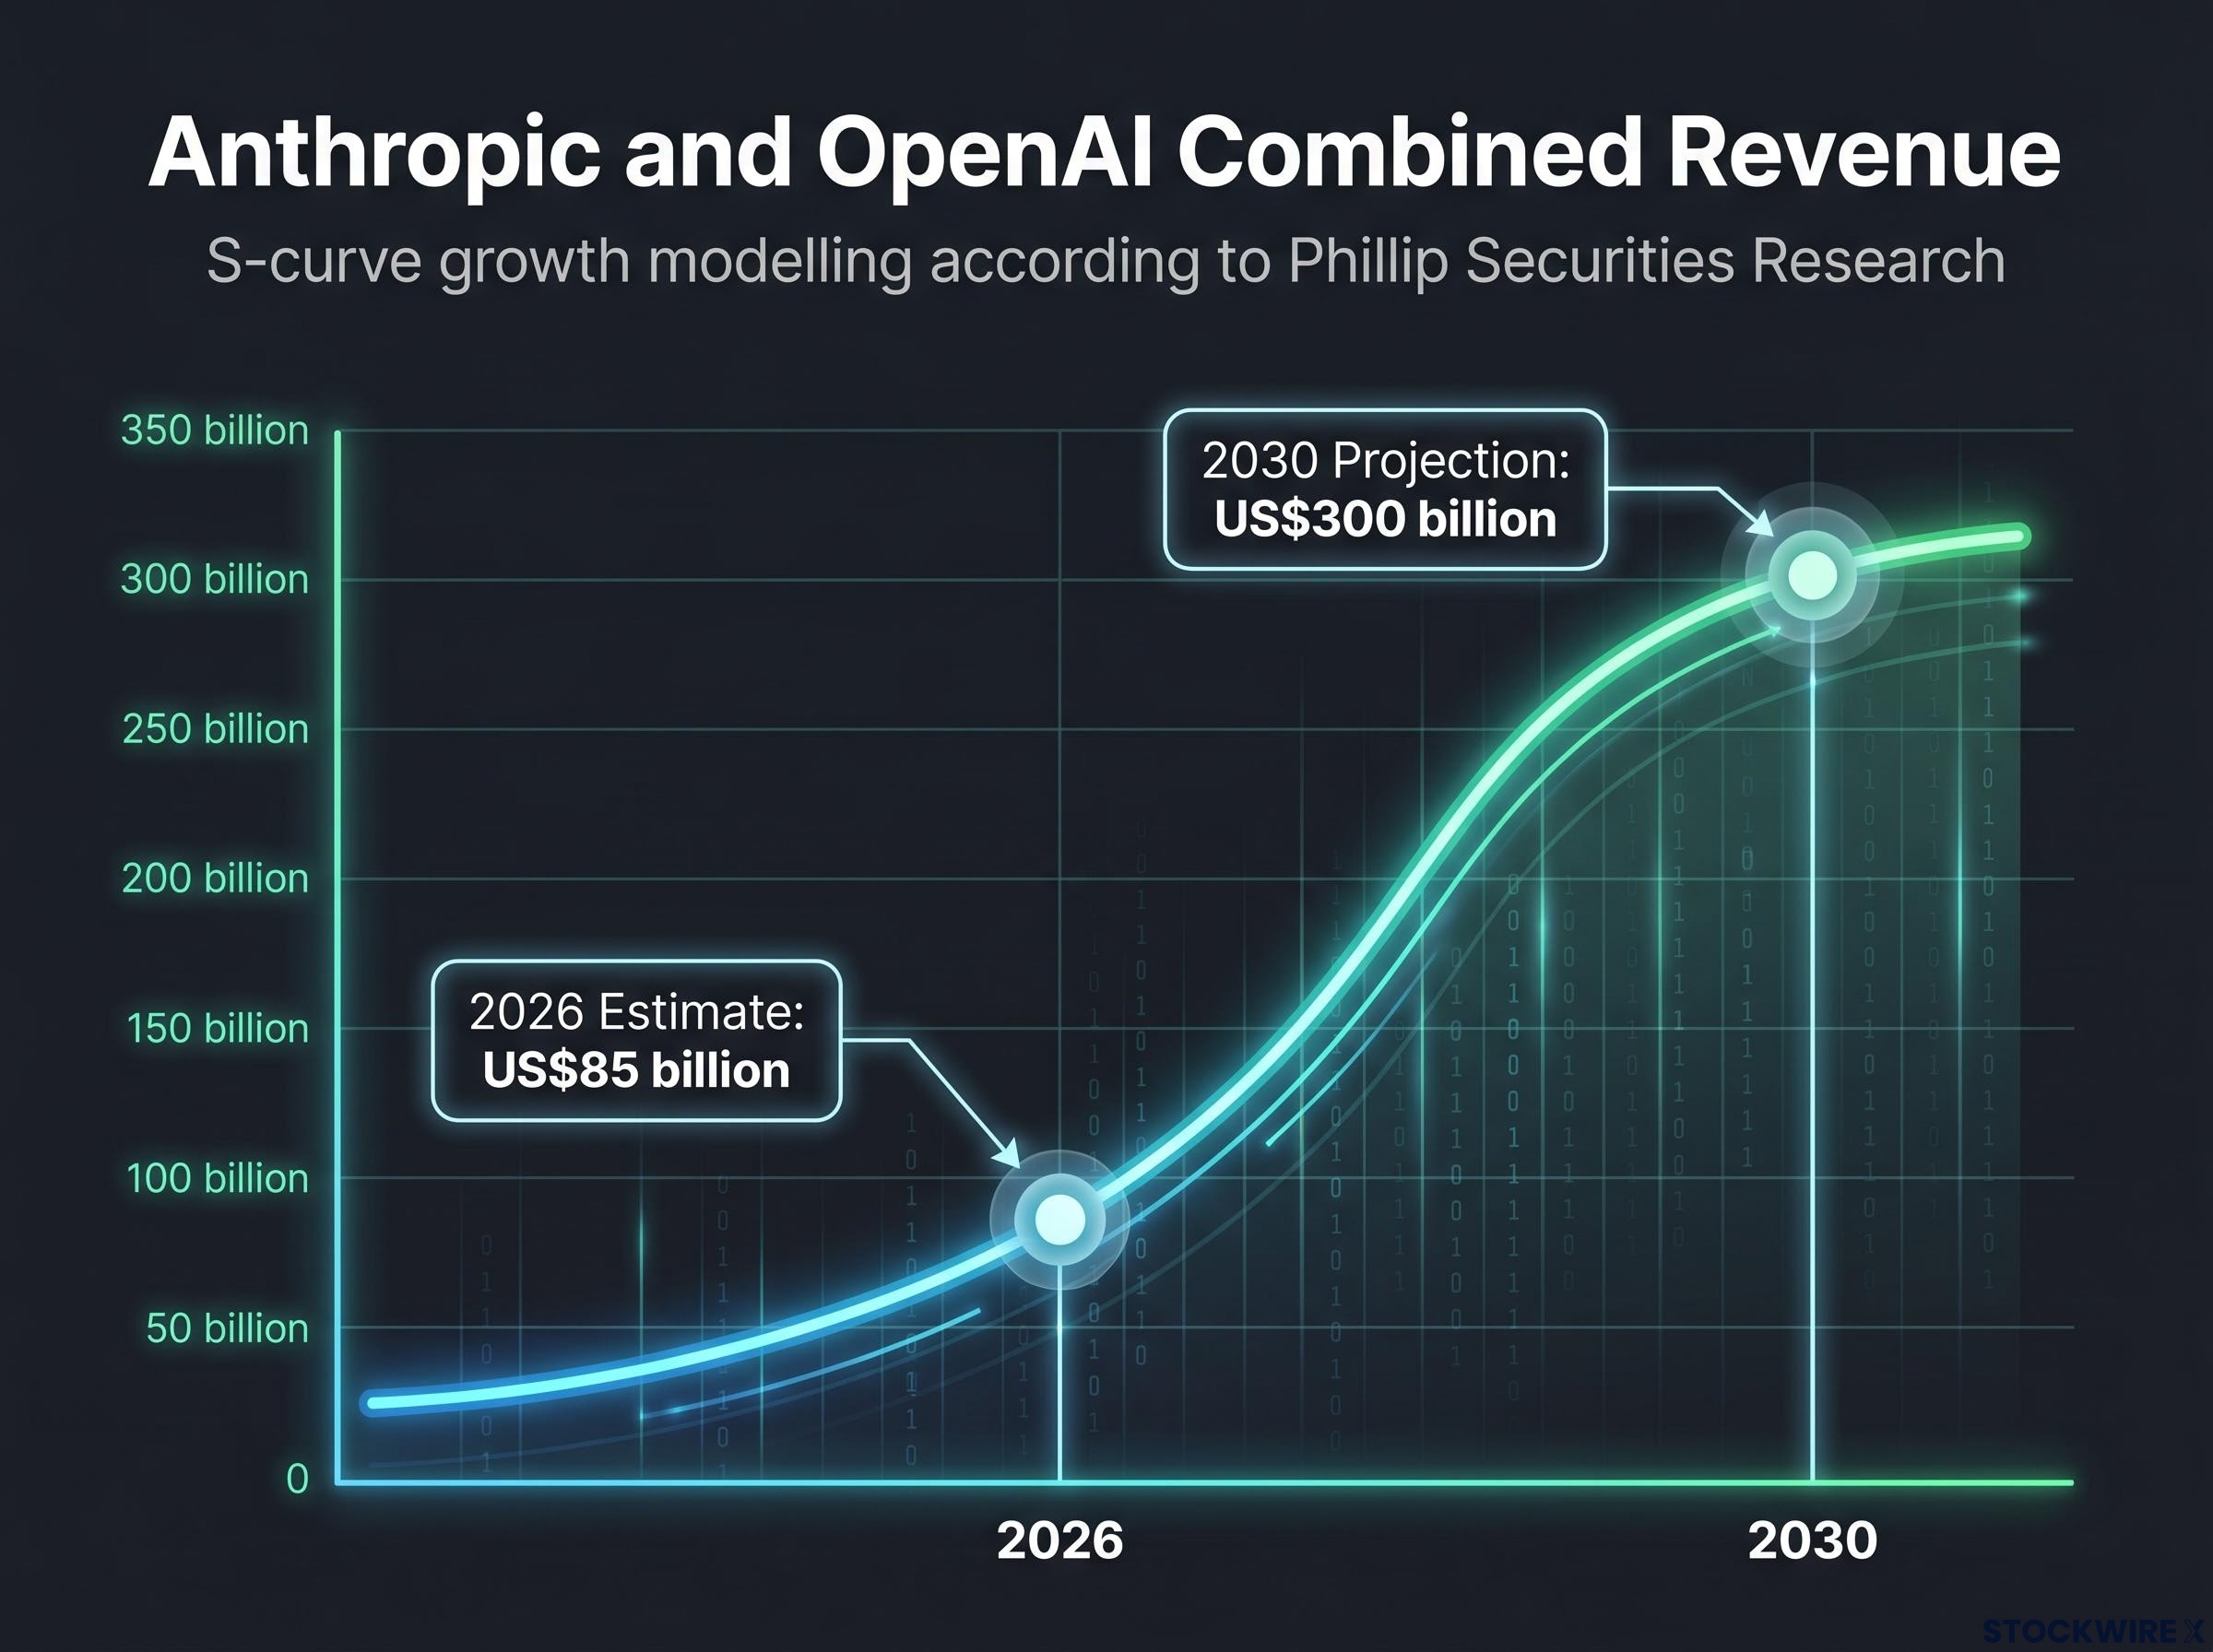
That is not a speculative page-view equivalent. It is real, monetisable output at a scale that few technology categories have reached this early in their adoption curve.
The supporting evidence reinforces the pattern:
- Peer-reviewed research from Babina et al. (Journal of Financial Economics, 2024) finds that AI-investing firms show higher growth in sales, employment, and market valuations, driven by product innovation rather than financial engineering.
- Capital expenditure by hyperscalers on AI and data centre infrastructure is forecast to grow by 73% across 2026, followed by a further 22% in 2027, according to Phillip Securities Research.
Phillip Securities’ S-curve adoption model frames this capex as demand-responsive rather than speculative. The distinction matters for you as an investor: if capital expenditure is chasing observable customer demand and revenue data, the cycle has a self-correcting mechanism. If it is running ahead of demand on faith alone, it does not. The revenue numbers suggest the former.
How today’s valuations compare to the last time everyone said this was different
Valuation is where the bubble debate generates the most heat and the least precision. The most useful exercise is a direct comparison with the asset that occupied the same structural position in the last cycle that ended badly.
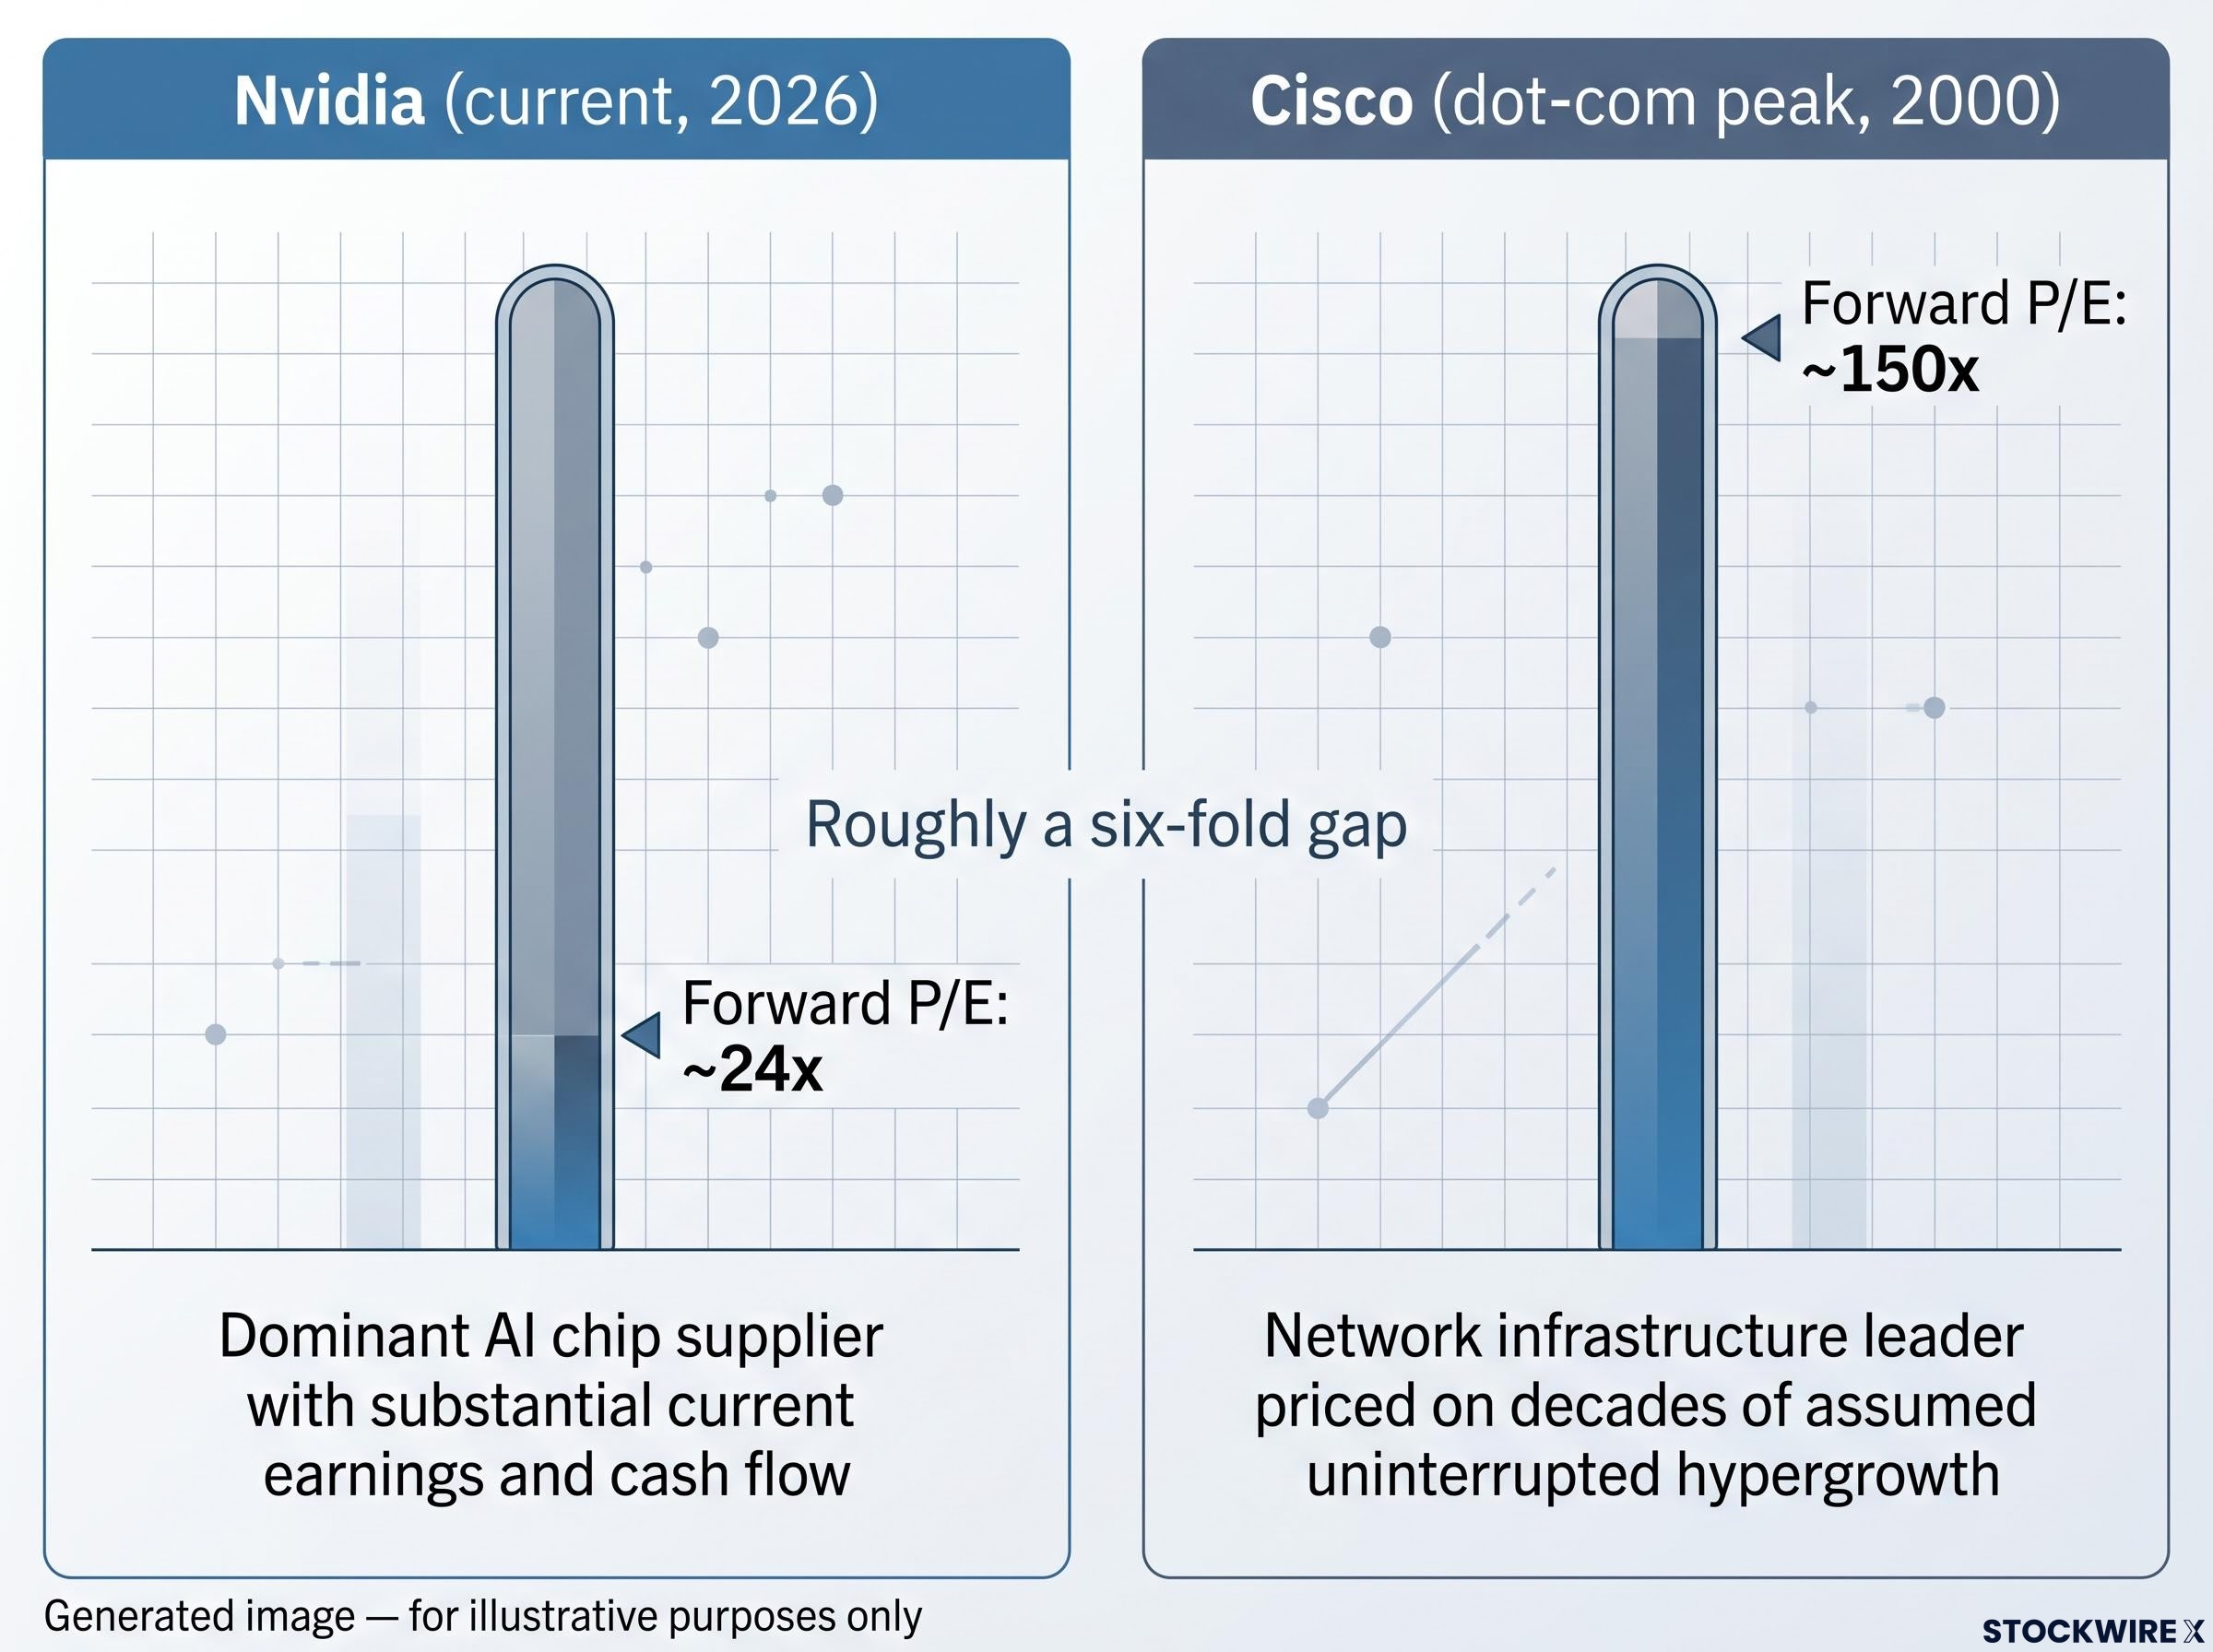
| Company | Forward P/E | Revenue base context |
|---|---|---|
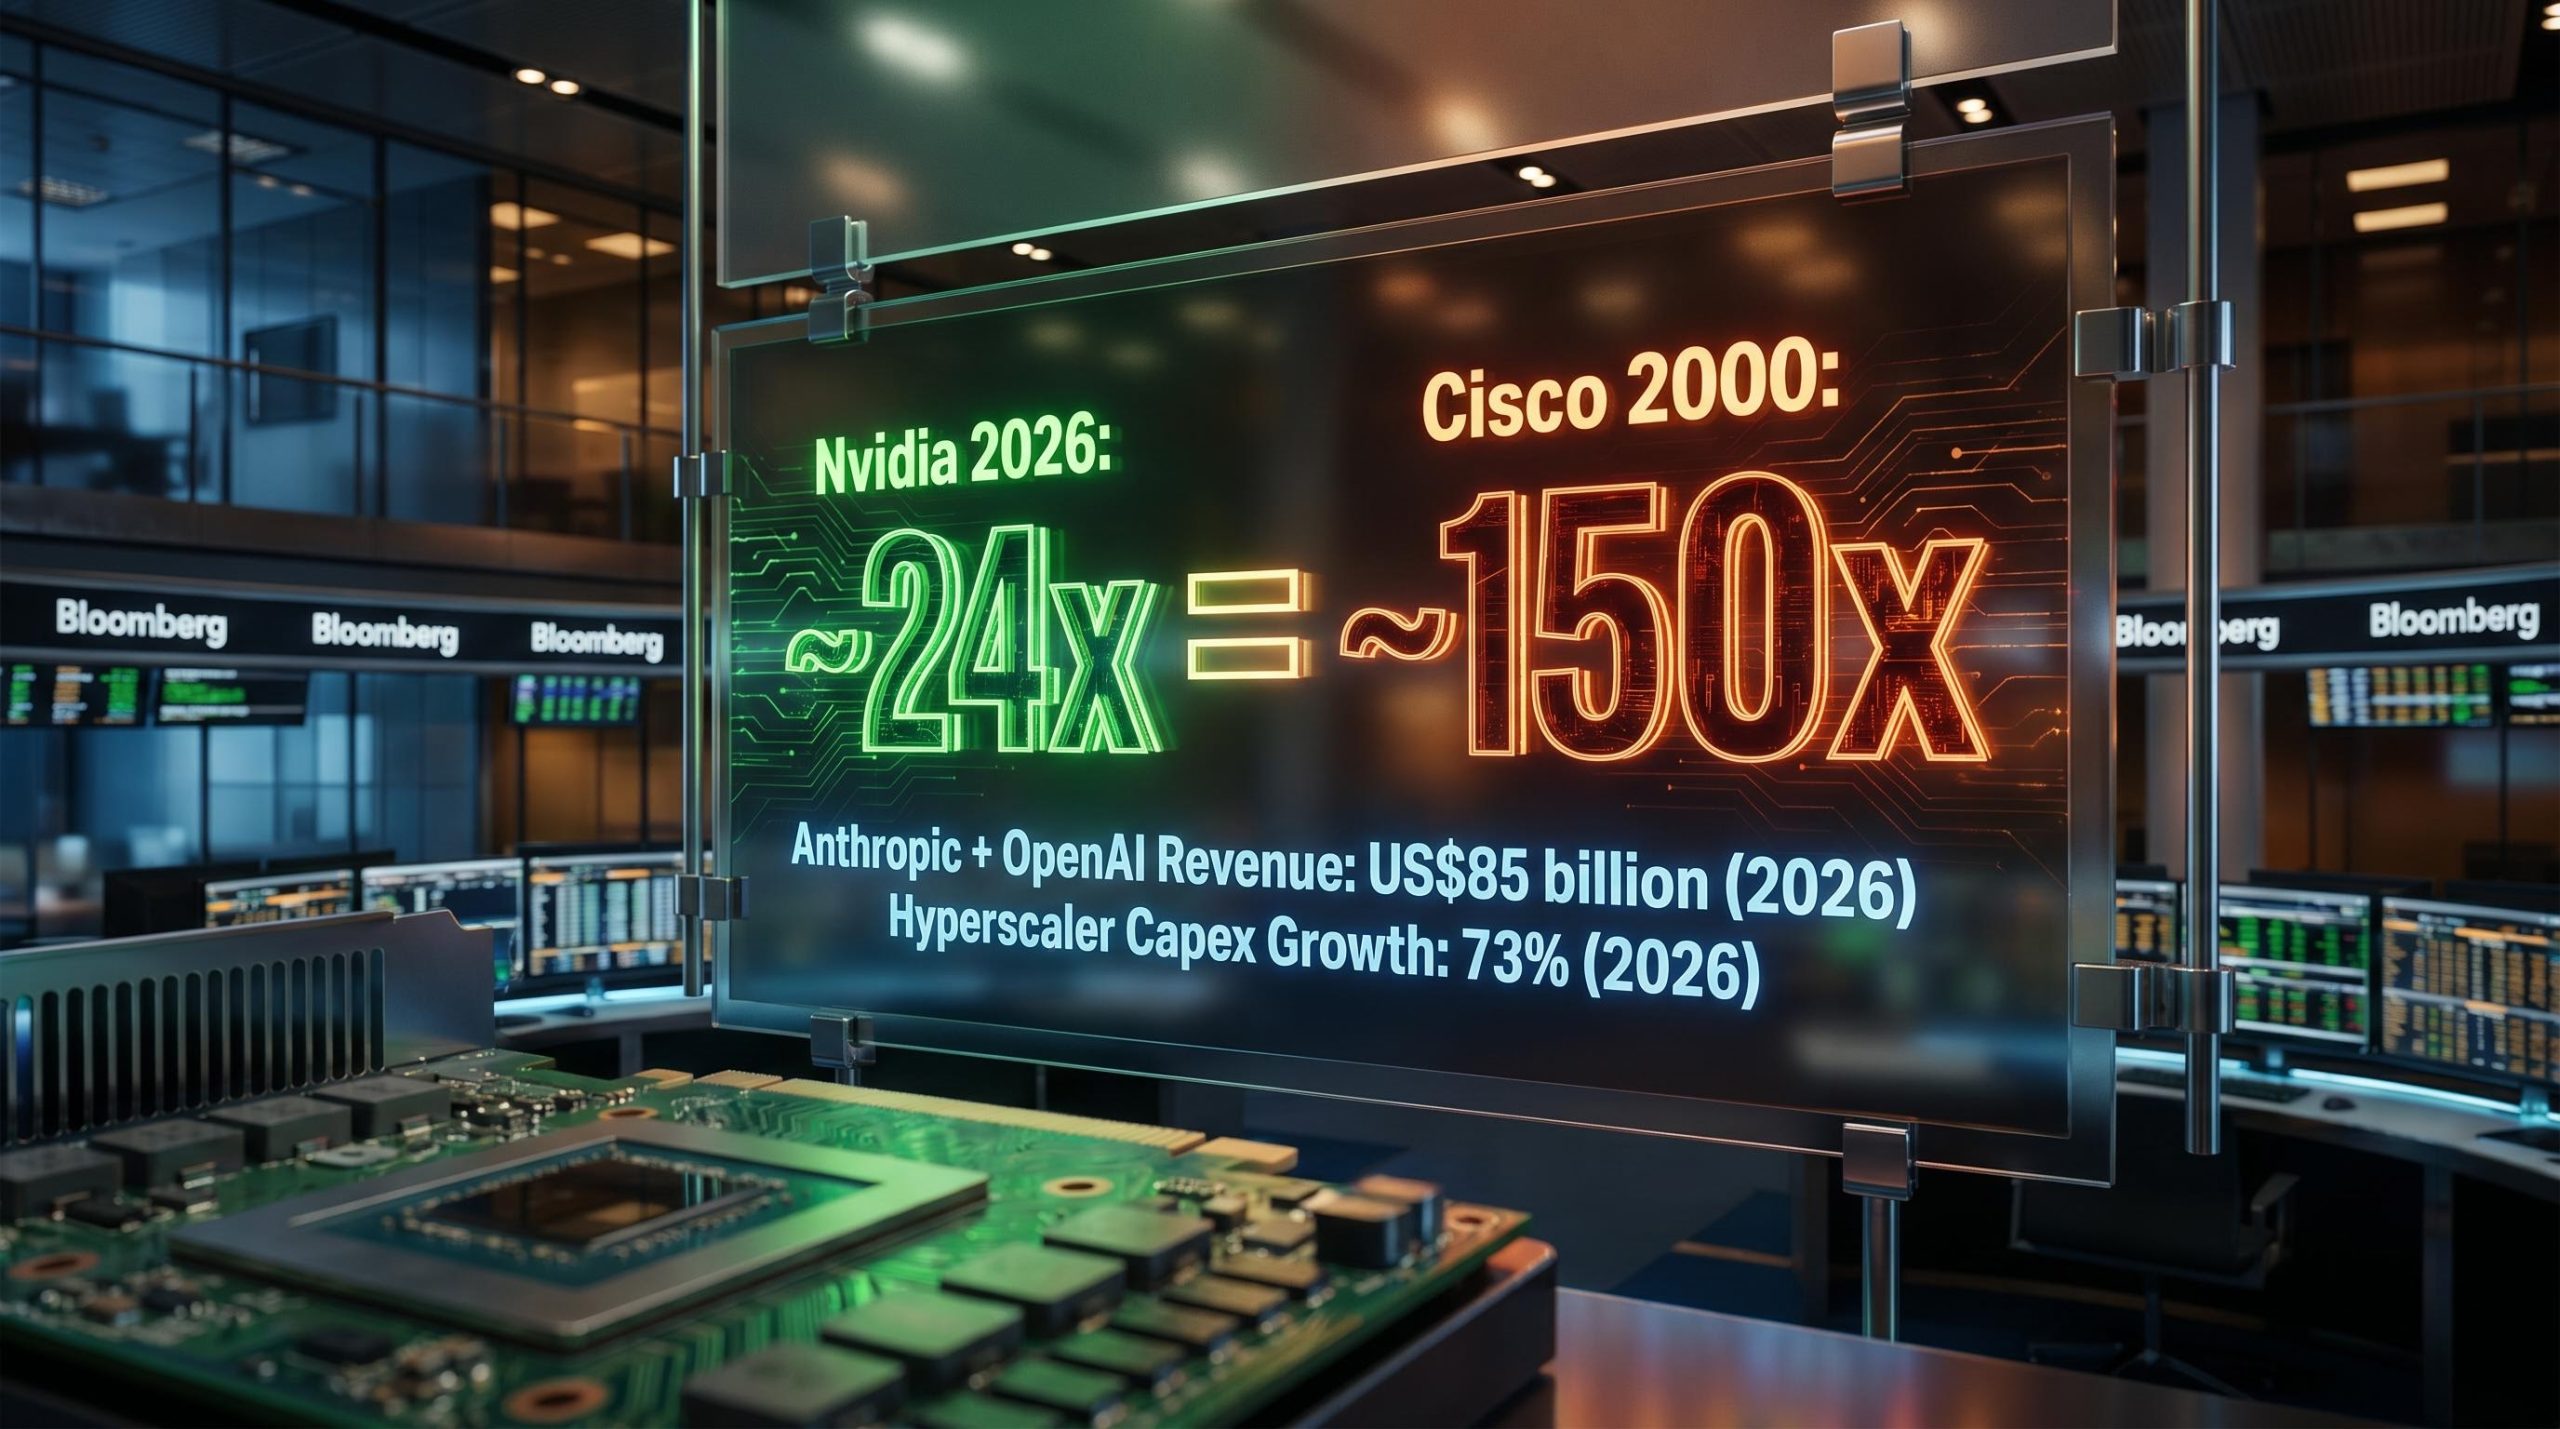
| Nvidia (current, 2026) | ~24x | Dominant AI chip supplier with substantial current earnings and cash flow |
| Cisco (dot-com peak, 2000) | ~150x | Network infrastructure leader priced on decades of assumed uninterrupted hypergrowth |
That is roughly a six-fold gap between where the most prominent AI infrastructure stock sits today and where the most prominent dot-com infrastructure stock sat at the moment of maximum overvaluation. For downside scenario planning, this tells you the starting point for a potential correction is structurally different from 2000.
What independent analysts see in the valuation picture
The Phillip Securities comparison does not stand alone. Morningstar’s assessment is that the AI rally is increasingly supported by earnings and infrastructure investment rather than hype, though concentration risk in semiconductors and memory remains a concern. T. Rowe Price describes valuations as rich but not outright bubble-territory, maintaining a neutral growth-value balance as a risk management posture.
None of this means valuations are cheap. They are elevated relative to historical averages. The point is that “elevated” and “bubble-level” describe different magnitudes of risk, and the current data sit closer to the former.
Where the speculative dynamics actually live in today’s AI market
The macro case for AI as a grounded cycle is strong. The micro evidence is more complicated, and ignoring it would undermine the analysis.
An econometric bubble-detection study by Basele, Phillips, and Shi (Journal of Time Series Analysis, 2025; Cowles Foundation DP 2430) applied rigorous statistical tests to the Magnificent Seven stocks across the period January 2017 to January 2025. The findings are specific:
- Speculative bubbles were detected in all seven Magnificent Seven stocks during the sample period.
- Nvidia and Microsoft exhibited the longest speculative periods (2017-2021).
- Nvidia and Tesla showed the fastest rates of explosive price behaviour.
- Speculative dynamics persisted from December 2022 to January 2025 in six of the seven stocks, excluding Apple.
This is peer-reviewed econometric evidence, not a contrarian opinion. The speculative periods identified are both long and recent.
AI-related issuers now account for approximately US$1.2 trillion of debt, roughly 14% of the USD investment-grade universe, according to Wellington Management.
The distinction that matters is between local, stock-level speculative dynamics and systemic, cross-asset speculative excess. The academic findings tell you that even if the macro AI story is fundamentally sound, specific positions in AI-concentrated stocks may have been, and may still be, trading through periods of speculative excess. That means position sizing and entry timing remain active risk management questions, even for long-term bulls.
The infrastructure buildout in context: data centres, semiconductors, and the capex cycle
The AI cycle has moved beyond software narratives into physical asset creation, and that shift changes the risk profile in ways that matter for how you think about duration and reversal.
| Metric | Current data point | Source |
|---|---|---|
| Semiconductor billings growth YTD | 86% | Phillip Securities Research |
| Annualised semiconductor billings | ~US$1 trillion | Phillip Securities Research |
| Wafer-fab capex growth (YoY) | 40% | Phillip Securities Research |
| Wafer-fab capex forecast | US$175 billion | Phillip Securities Research |
| Hyperscaler capex growth (2026) | 73% | Phillip Securities Research |
| Hyperscaler capex growth (2027) | 22% | Phillip Securities Research |
Wellington Management characterises this as an “extraordinary wave of investment” in hyperscale data centres, semiconductor plants, and power grids, driven by surging demand for AI compute. The historical parallels are railway and telecom fibre buildouts: massive capital deployed into long-lived real assets that created durable economic capacity, even when individual cycles occasionally overshot.
What the physical asset base means for correction risk
The shift from software promises to physical semiconductor fabs and data centres changes the shape of a potential overshoot. If the AI cycle does eventually exceed demand, the correction mechanism looks more like a capacity overhang in long-lived real assets than a sudden collapse in paper valuations. That is a slower, more manageable kind of risk for investors who are monitoring the right signals, but it also means overcapacity can persist for years before fully correcting. Duration risk, not crash risk, is the more relevant concern in an infrastructure-led cycle.
Four metrics that will tell you if the story is changing
The current evidence does not show a systemic bubble. But the conditions that distinguish a productive infrastructure cycle from a speculative one can shift. Knowing exactly what to watch puts you in a position to act before consensus catches up.
- Revenue and margins at AI leaders. Monitor whether Anthropic, OpenAI, and AI-heavy hyperscalers continue delivering revenue growth consistent with S-curve expectations. A negative signal: demand plateauing or severe margin compression appearing across multiple AI-native firms simultaneously.
- Semiconductor and infrastructure indicators. Track semiconductor billings, data-centre utilisation rates, and wafer-fab capex. A negative signal: a sharp, sustained deceleration suggesting overbuilding or inventory-driven investment rather than demand-driven deployment.
- Valuation versus earnings growth. Compare price-to-earnings (P/E) and price-to-sales multiples of AI-exposed equities against their actual earnings and cash-flow growth. P/E is the ratio of a company’s share price to its earnings per share, measuring how much investors pay per dollar of profit. A negative signal: rapid multiple expansion without commensurate fundamental progress.
- Broader market and credit conditions. Observe credit spreads (the gap between corporate bond yields and government bond yields, measuring perceived risk), leverage trends, retail participation, and risk behaviour across sectors beyond AI. A negative signal: speculative excess spreading from AI into unrelated asset classes, the hallmark of a systemic bubble forming.
The current verdict, and what it does not settle
On the weight of current evidence, the AI investment cycle looks more like a major infrastructure and productivity buildout than a systemic bubble. Revenue is real and scaling. Valuations are elevated but sit roughly six-fold below the dot-com comparison point. Physical capital is being deployed into long-lived assets, not paper instruments.
That assessment comes with genuine caveats. Peer-reviewed research has detected speculative dynamics in individual AI-concentrated stocks over recent multi-year windows. Those findings are not contrarian noise; they are econometric evidence that position-level risk remains real even within a fundamentally sound macro story. Whether the S-curve revenue projections will be fully realised, whether real-asset capex will eventually produce a capacity glut, and whether concentration in a handful of names creates index-level risk that differs structurally from prior cycles are questions the current data cannot settle.
The framework and metrics above are the live instruments for tracking whether this assessment needs to change. The data give you a grounded starting point, not a guarantee.
This article is for informational purposes only and should not be considered financial advice. Investors should conduct their own research and consult with financial professionals before making investment decisions. Past performance does not guarantee future results. Financial projections are subject to market conditions and various risk factors.
—