
Record Fund Manager Equity Surge Triggers BofA’s Sell Warning
12 mins ago

Sixty-two per cent of professional fund managers now expect the 30-year U.S. Treasury yield to breach 6% before retreating to 4%. That single data point from Bank of America’s May 2026 Global Fund Manager Survey deserves more attention than the record equity-allocation headlines it accompanied.
The same survey that captured the largest single-month surge in equity allocations ever recorded also quietly surfaced three risk signals sitting in direct tension with the bullish consensus. Inflation has reclaimed its position as the top institutional tail risk. Long-end yield expectations are skewed sharply higher. And 73% of managers have named semiconductor longs the most crowded trade in the market. These findings arrive as the Federal Reserve holds rates in restrictive territory and explicitly acknowledges re-elevated inflation in its 29 April FOMC statement.
What follows separates the risk narrative from the sentiment narrative, examining what the survey’s May 2026 data actually signals for investors managing downside exposure across rates, equities, and sector positioning.
The jump was not gradual. In a single month, the share of fund managers citing inflation as the top tail risk surged from 26% in April to 40% in May 2026, a 14-percentage-point acceleration that displaced geopolitical conflict from the top of the hierarchy.
The April-to-May shift in tail risk rankings:
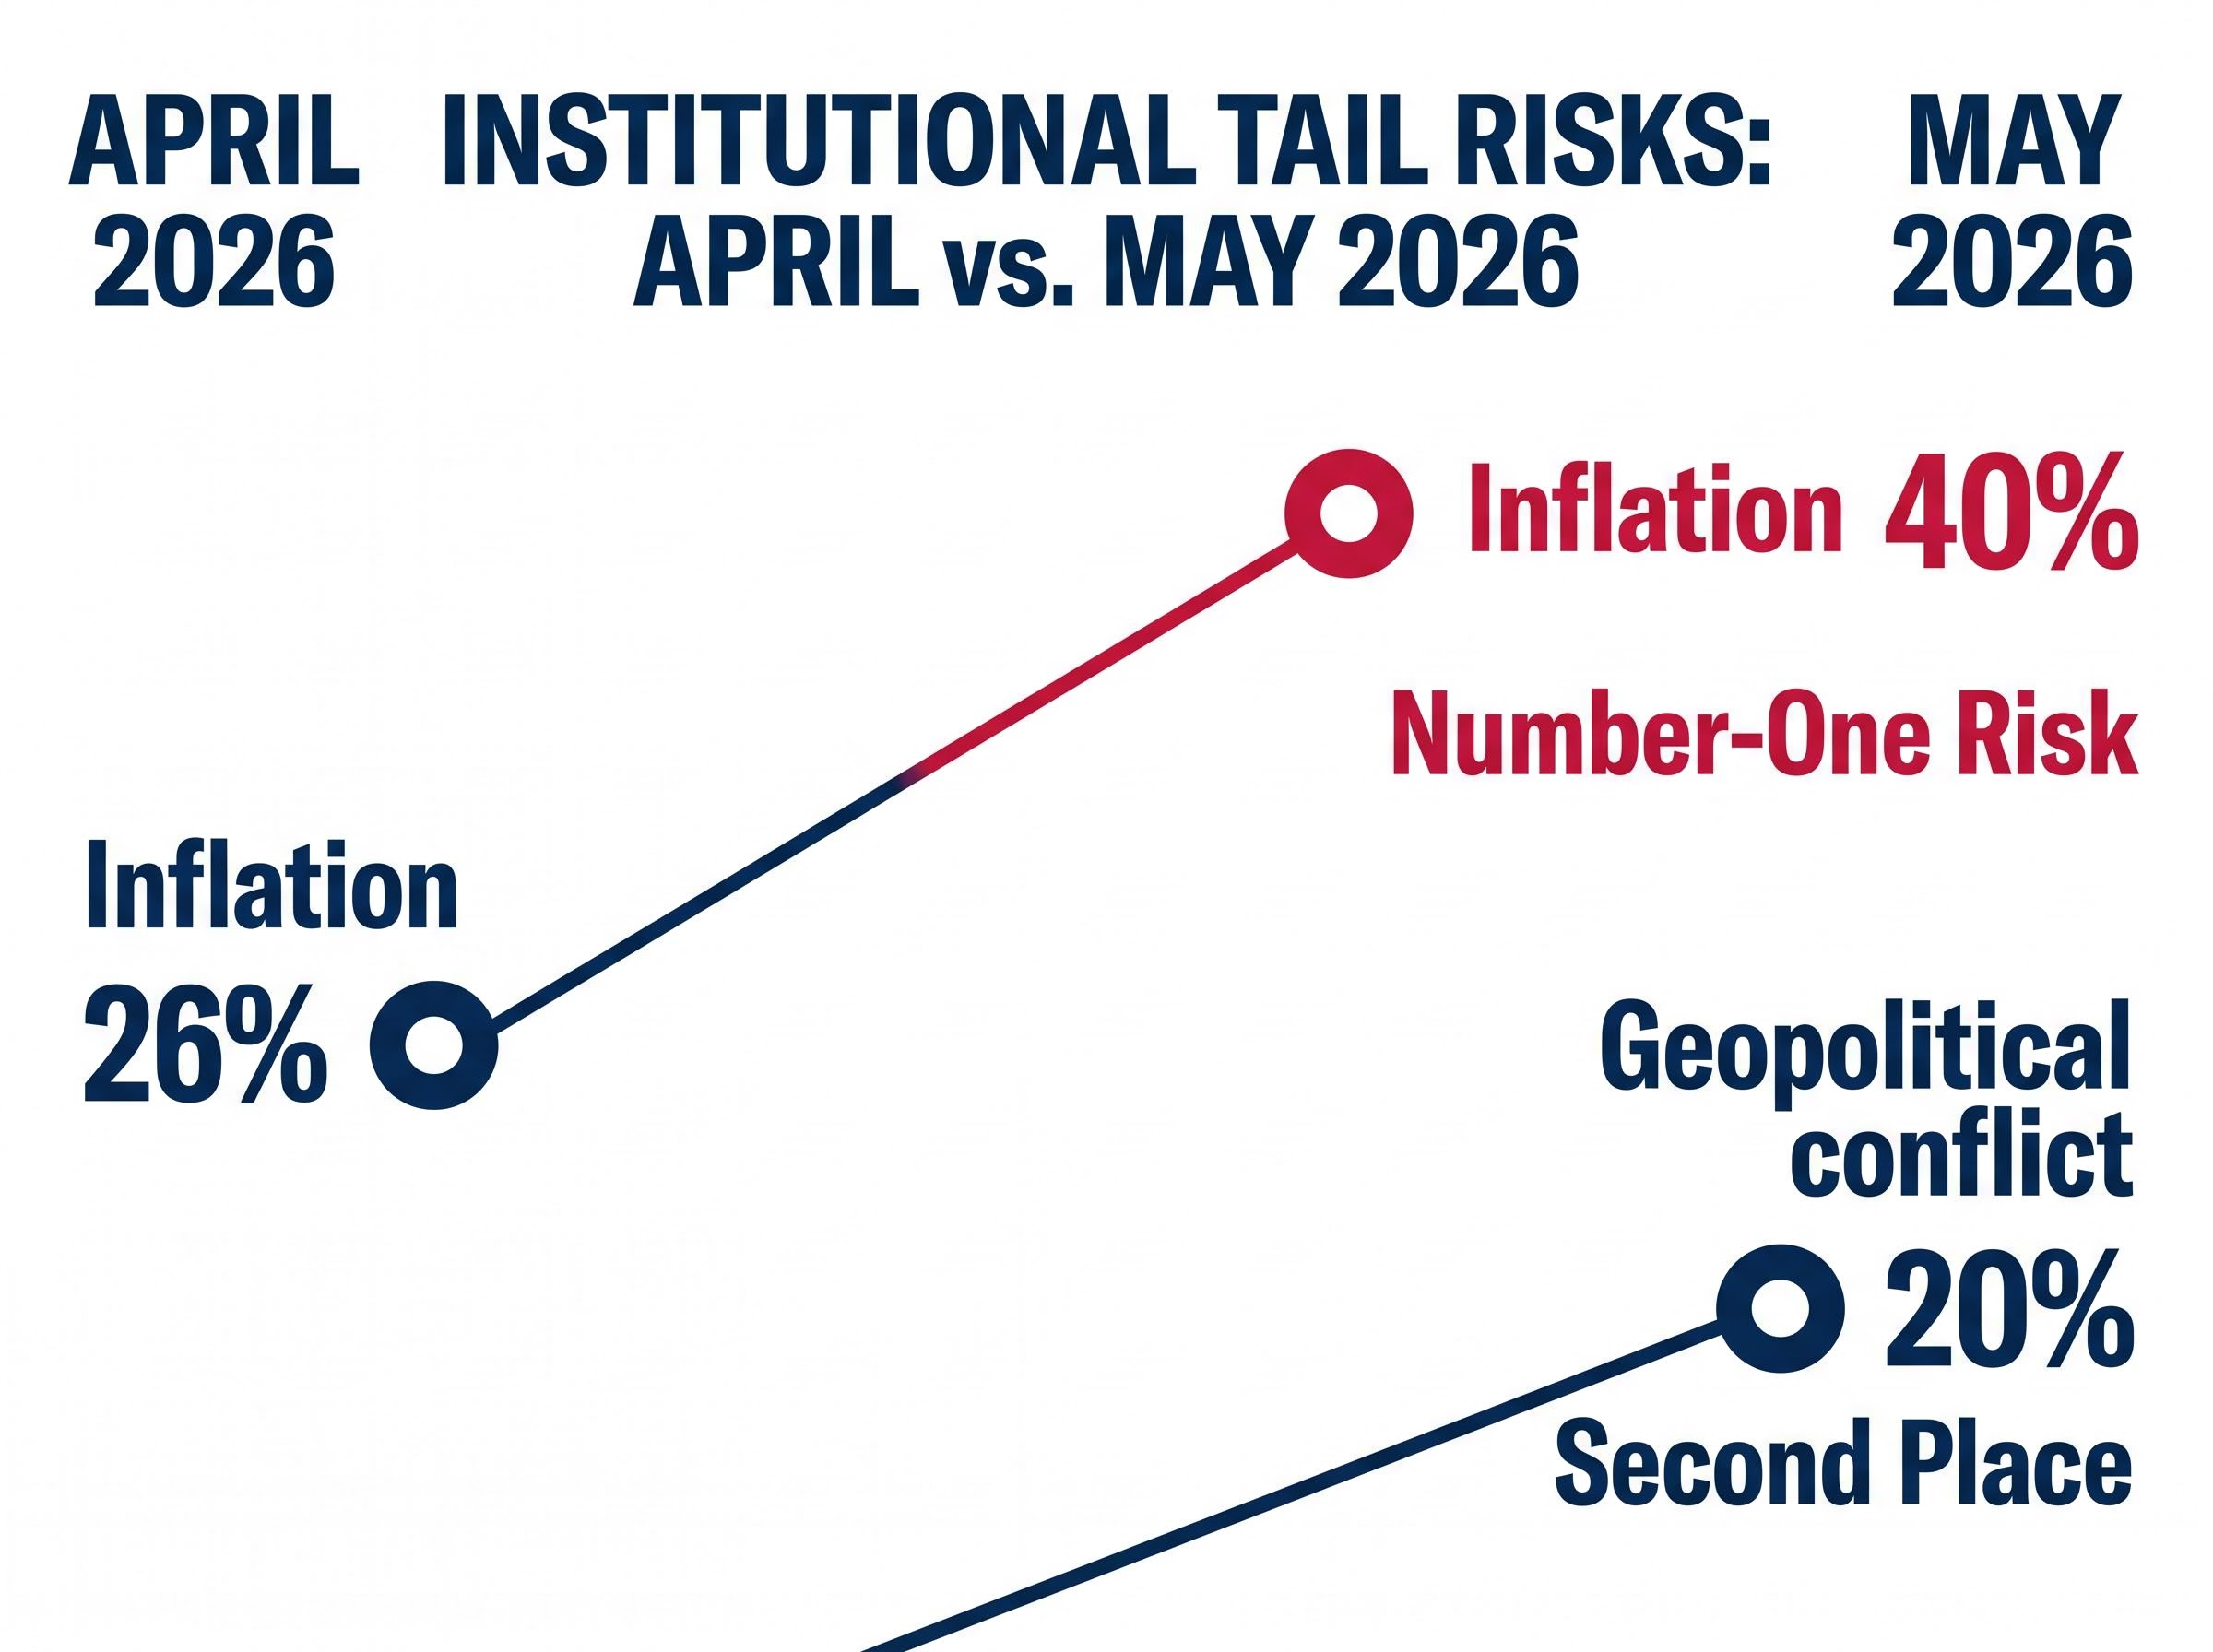
When inflation overtakes war as the primary institutional fear, it signals a structural shift in how managers are reading the macro environment. This is not a hypothetical concern; the Federal Reserve confirmed it three weeks ago.
The oil price transmission into yields and equities has already moved through several stages in 2026: Brent crude above $111 per barrel following the Strait of Hormuz disruption drove the CPI reading to 3.8%, which in turn reset inflation expectations and pushed 30-year yields above 5% for the first time since 2007. That completed transmission chain is the mechanism sitting behind the survey’s inflation and yield risk readings.
The FOMC’s 29 April 2026 statement confirmed that inflation remains elevated partly due to rising global energy prices and Middle East developments, providing the direct policy backdrop against which institutional managers have repriced their inflation risk expectations so sharply.
“Inflation is elevated, in part reflecting the recent increase in global energy prices.” The FOMC’s 29 April 2026 statement added: “Developments in the Middle East are contributing to a high level of uncertainty about the economic outlook.”
The Fed held the federal funds rate at 3.5% to 3.75%, maintaining restrictive policy with no near-term cut signal. Inflation returning to the top of the institutional fear hierarchy matters because it directly affects rate expectations, discount rates, and the viability of the bullish equity consensus. If inflation is the dominant risk, the Fed’s path toward easing narrows, and the assumptions underpinning the equity rally become more fragile.
Most investors track Federal Reserve communications to gauge rate risk. That instinct is correct for the short end of the yield curve, where the Fed sets the federal funds rate. The long end operates differently, and the distinction is where the current risk lies.
Three forces determine where the 30-year Treasury yield trades, and none of them is the federal funds rate:
All three drivers are currently pointing in the same direction: upward. The Fed can cut the funds rate and long-end yields can still rise if inflation expectations, term premium, and supply dynamics overwhelm the short-end signal. That decoupling is what makes long-end exposure a separate analytical problem from Fed policy tracking.
The 30-year U.S. Treasury yield sits at approximately 4.9% to 5.0% as of mid-May 2026, according to U.S. Treasury daily yield curve data. Base-case projections from major banks (Goldman Sachs, JPMorgan, Morgan Stanley) cluster the 30-year in the 4% to 5.5% range over the next 12 months, conditional on gradual disinflation and an orderly Federal Reserve path.
The U.S. Treasury daily yield curve data places the 30-year yield at approximately 4.9% to 5.0% as of mid-May 2026, which is the baseline level from which the 100-to-110 basis point move implied by the 6% scenario must be assessed.
That range is the baseline from which the survey’s 6% scenario must be evaluated.
The gap between where yields sit today and where 62% of fund managers expect them to go is approximately 100 to 110 basis points. From roughly 5% to 6% is not a marginal repricing; by any historical standard, it is a material shift in the risk-free rate.
BofA strategist Michael Hartnett had already flagged the 5% threshold as a market deterioration trigger before the May survey was published, warning that a breach would push 30-year mortgage rates above 8%, raise corporate borrowing costs, and compound a federal deficit already running at approximately 7.2% of GDP. The 6% scenario now in the institutional consensus represents a further 100 basis points beyond that initial warning level.
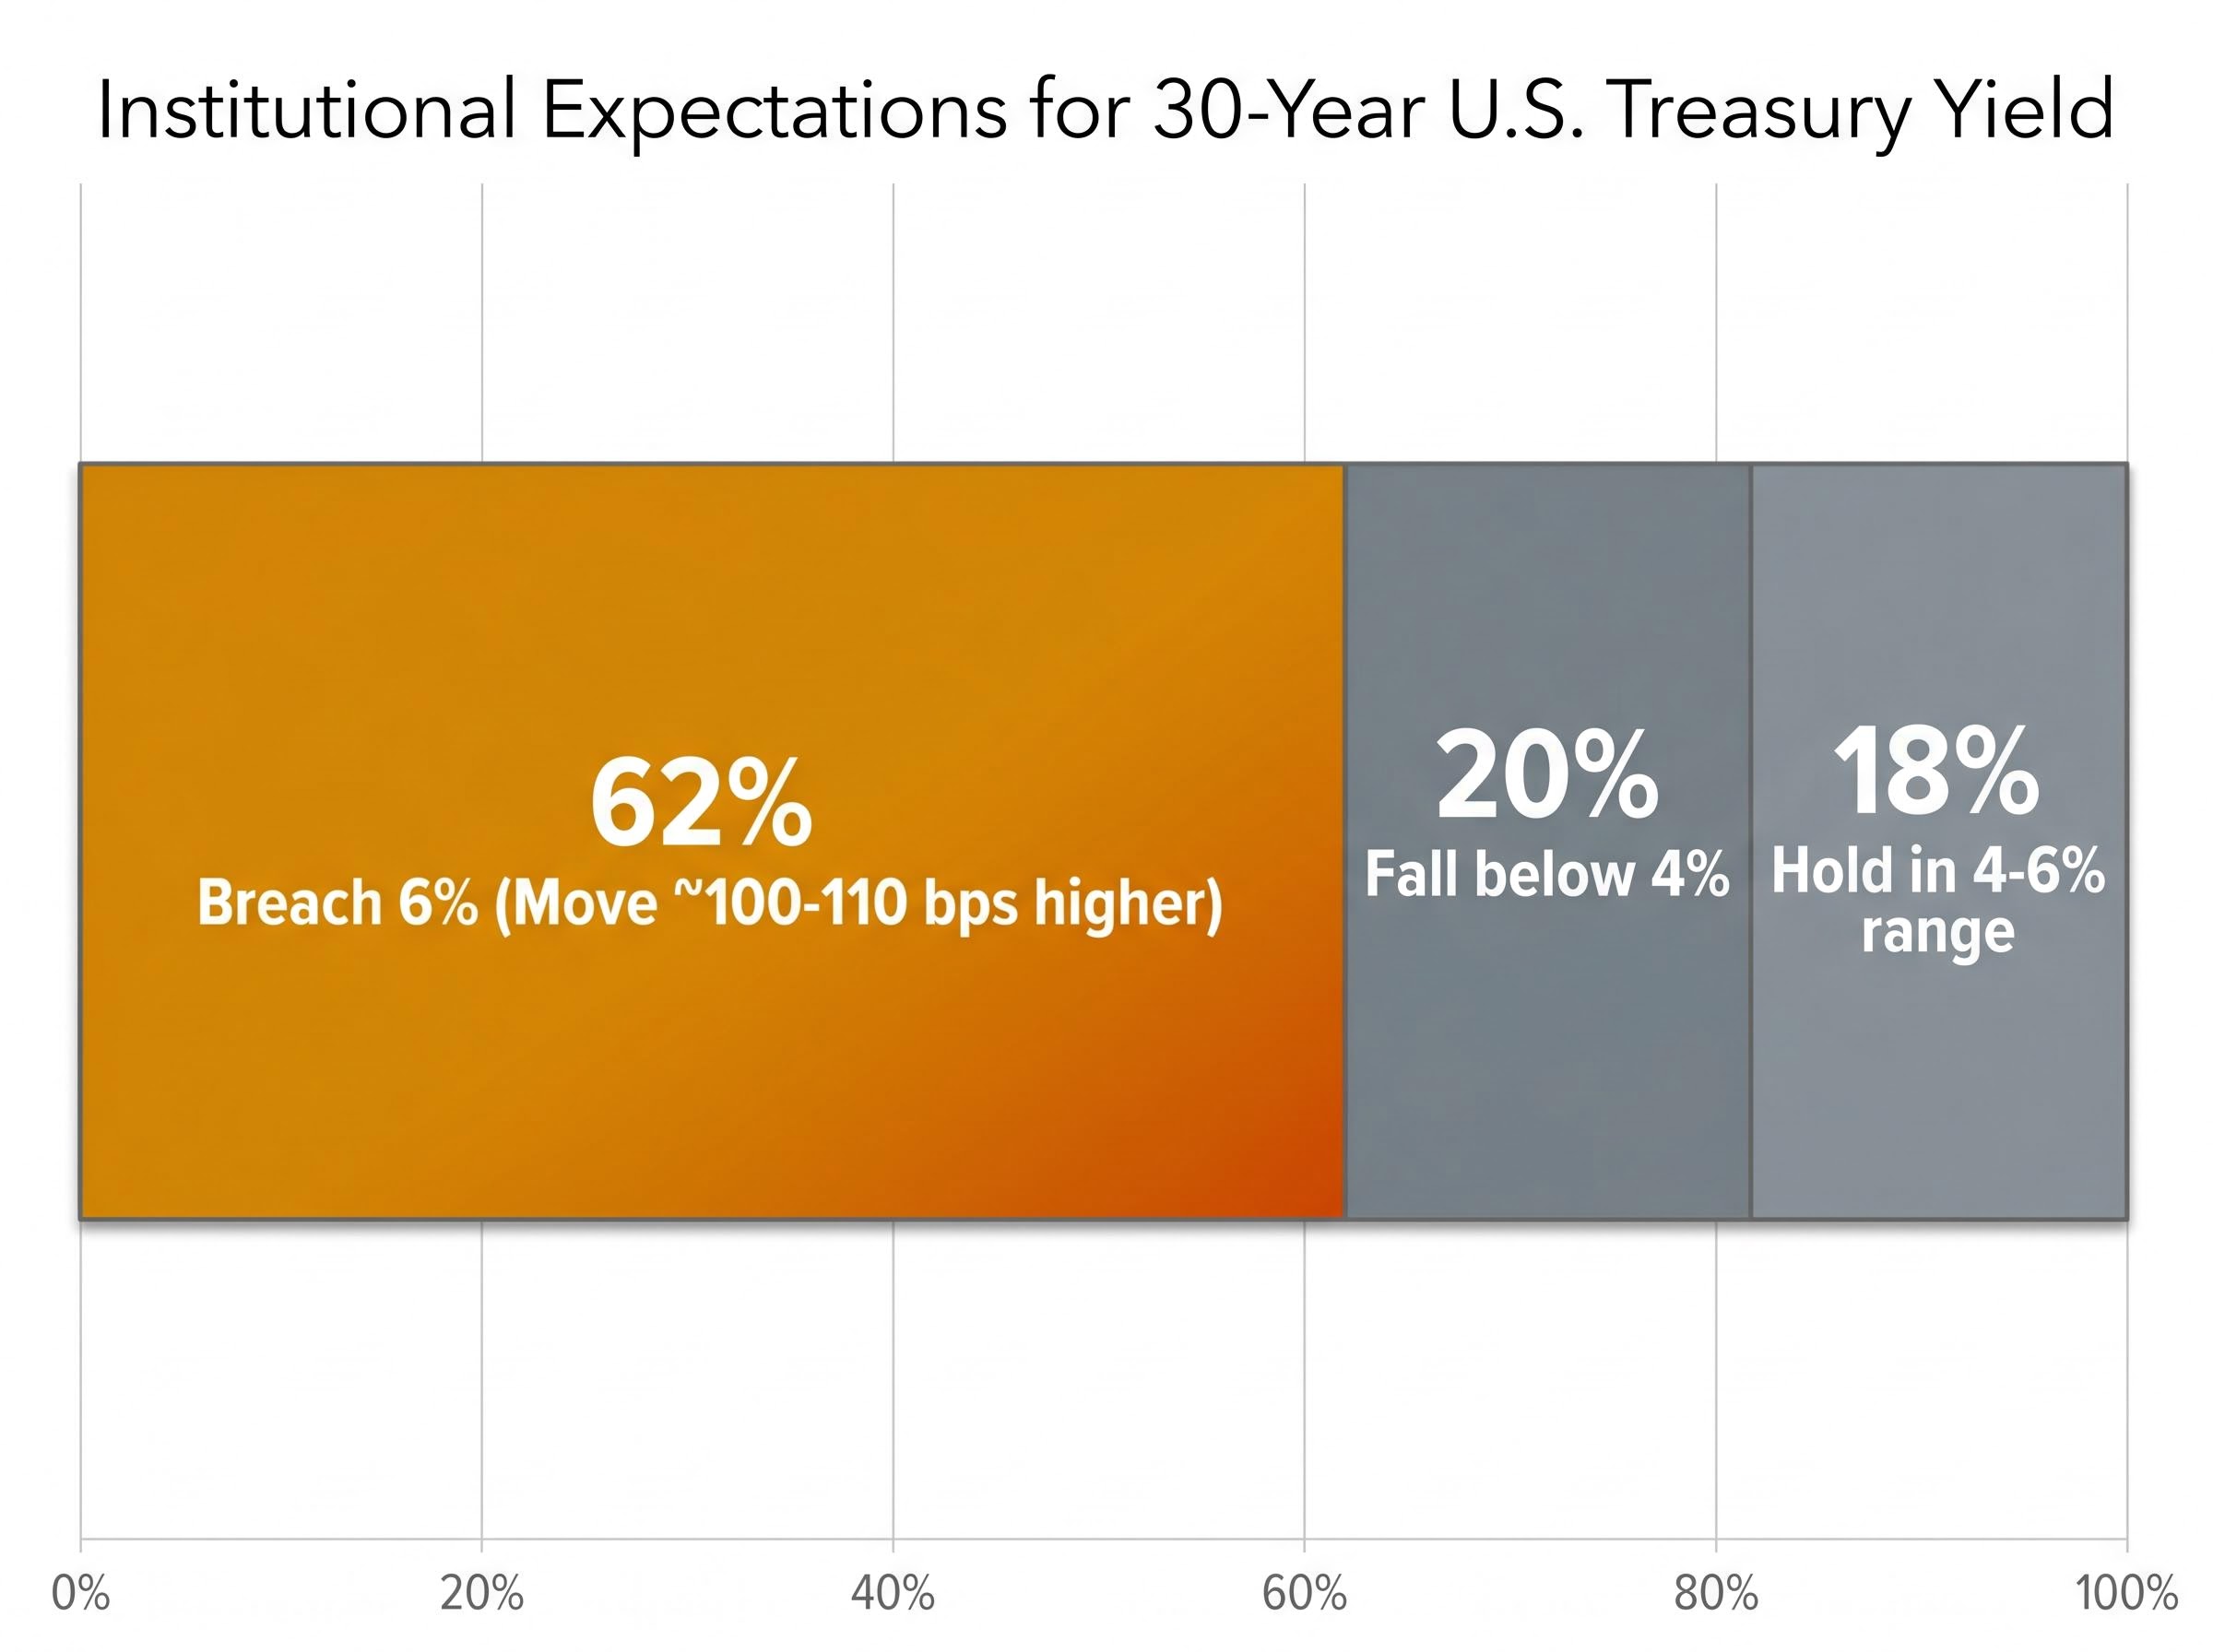
62% of managers expect the 30-year yield to exceed 6%. Only 20% expect it to fall below 4%. That asymmetric skew represents how institutional capital is being positioned for one-directional yield risk.
| Scenario | Manager % expecting outcome | Implied yield move from current level | Key condition required |
|---|---|---|---|
| Breach 6% | 62% | ~100-110 bps higher | Material inflation overshoot or fiscal shock |
| Hold in 4-6% range | 18% | Roughly unchanged | Gradual disinflation, orderly Fed path |
| Fall below 4% | 20% | ~90-100 bps lower | Recession or aggressive rate-cutting cycle |
Goldman Sachs rates strategy commentary frames a sustained move toward 6% as requiring a material inflation overshoot or fiscal shock, with term premium normalisation as a contributing driver. The scenario remains a tail risk rather than a base case, but no major bank’s 2026 projections dismiss the directional risk. For equity and fixed income investors alike, whether 6% is remote or increasingly plausible changes portfolio construction decisions materially.
Seventy-three per cent. That is the share of managers identifying semiconductor longs as the most crowded trade in May 2026, up from 24% just one month earlier when semiconductors were tied with long oil at the top of the crowded trade ranking.
A near-tripling of crowding concentration in a single month:
When positioning is this concentrated, the mechanics of risk change. Crowded trades do not unwind gradually. Any catalyst, whether an earnings miss, a regulatory shift, or a macro shock, can trigger self-reinforcing selling as managers simultaneously attempt to reduce the same exposure. The speed of the April-to-May shift suggests momentum-driven positioning rather than fundamental re-evaluation, which tends to reverse with equal speed.
The connection to the long-end yield scenario is direct. High-multiple growth stocks, including semiconductor and AI-driven names, are duration-sensitive assets. Rising discount rates compress their valuations because more of their value is embedded in distant future earnings. The 2022 rate-rise cycle demonstrated sharp negative correlation between long-end yield spikes and high-multiple technology valuations.
The inflation damage to equity multiples follows a clear mechanical sequence: persistently high CPI forces the Fed to hold real rates elevated, raising the discount rate applied to future earnings and compressing price-to-earnings ratios market-wide, with Bank of America’s historical data showing average S&P 500 returns turn negative over both three-month and six-month horizons once the 4% threshold is breached.
If the 30-year yield moves toward 6%, semiconductor names face a valuation headwind at precisely the moment when 73% of institutional capital is positioned long. The risks are compounding rather than independent.
The three survey signals are not separate items that happen to share a publication date. They form a potential sequential cascade:
The risks are mutually reinforcing rather than additive. A shock to one variable accelerates the others, which is the structural feature that makes this risk cluster more dangerous than any single component.
Short-term rate expectations rose from a net 4% to a net 23% expecting higher short-term rates, the highest reading since October 2022. Yet 50% of managers still expect Fed rate cuts within 12 months. That internal contradiction suggests the bullish consensus has not fully capitulated to the risk scenario, which is itself a reason why the unwind could be sharper if conditions deteriorate.
The survey data raises three specific positioning questions that investors should be stress-testing against their current allocations:
| Positioning area | Current consensus signal | Risk if scenario materialises | BofA indicator reading |
|---|---|---|---|
| Long-duration Treasuries | 62% expect 30-yr above 6% | ~100-110 bps capital loss on long bonds | Net 23% expect higher short rates |
| Semiconductor/AI equities | 73% most crowded trade | Valuation compression and forced unwind | Equity allocation net 50% overweight |
| Cash allocation | 3.9%, below sell-signal threshold | Insufficient liquidity for repositioning | Bull & Bear Indicator at 7.8 (sell signal at 8.0) |
BofA strategist Michael Hartnett characterised early June 2026 as a potentially favourable window for profit-taking. The Bull and Bear Indicator at 7.8 is approaching the 8.0 sell-signal threshold. The tension the survey reveals within institutional positioning itself is instructive: managers are simultaneously bullish on equities, worried about inflation, and expecting higher long-end yields. That combination of views cannot all resolve comfortably.
The Bull and Bear Indicator trajectory over the preceding week adds texture to that reading: $136 billion rushed into cash funds in the week ending 8 May 2026, the fastest defensive move since January 2026, while U.S. equity funds simultaneously logged a sixth consecutive week of inflows, pushing the indicator to 7.2 and establishing the one-week momentum that carried it to 7.8 by the time of the May survey.
The May 2026 Global Fund Manager Survey is simultaneously a record-bullish sentiment reading and a map of the specific points at which that sentiment is most vulnerable. The same dataset that produced headlines about the largest one-month equity allocation surge ever recorded also produced a 14-percentage-point jump in inflation as the top tail risk, a 62-to-20 skew toward a 6% 30-year yield, and a near-tripling of semiconductor crowding in 30 days.
The bullish consensus is not wrong. It is exposed to a specific set of conditions that the same survey identifies as the primary risks.
Investors who separate the sentiment narrative from the risk narrative in the survey data have a more complete picture than those who read only the headline allocation numbers. The three risks, inflation, long-end yields, and semiconductor crowding, are most dangerous in combination, not in isolation. The survey captures a market that is optimistic about outcomes but increasingly nervous about the conditions required to deliver them. That tension is itself the signal worth watching.
This article is for informational purposes only and should not be considered financial advice. Investors should conduct their own research and consult with financial professionals before making investment decisions. Past performance does not guarantee future results. Financial projections are subject to market conditions and various risk factors.
The Bank of America Global Fund Manager Survey is a monthly poll of professional institutional investors that tracks asset allocation, sentiment, and risk positioning. Investors follow it because it reveals how large pools of capital are positioned, which crowded trades are most vulnerable, and where consensus risk perception is shifting.
The May 2026 survey found that 62% of fund managers expect the 30-year U.S. Treasury yield to breach 6% before retreating to 4%, implying a move of approximately 100 to 110 basis points above the current level of roughly 4.9% to 5.0%.
In the May 2026 survey, 73% of fund managers identified semiconductor longs as the most crowded trade, up from just 24% in April, suggesting momentum-driven positioning rather than fundamental re-evaluation and raising the risk of a sharp, self-reinforcing unwind if a catalyst emerges.
High-growth and high-multiple technology stocks, including semiconductors, are duration-sensitive assets, meaning their valuations are heavily dependent on discounting future earnings. When long-end yields rise sharply, the discount rate increases and compresses price-to-earnings ratios, as demonstrated during the 2022 rate-rise cycle.
The Bull and Bear Indicator is a sentiment and positioning gauge produced by BofA strategists that ranges from 0 to 10. A reading at or above 8.0 triggers a contrarian sell signal; the May 2026 survey placed the indicator at 7.8, one step below that threshold.


