Eli Lilly at 40x Earnings: Expensive Stock, Underpenetrated Market
4 hrs ago

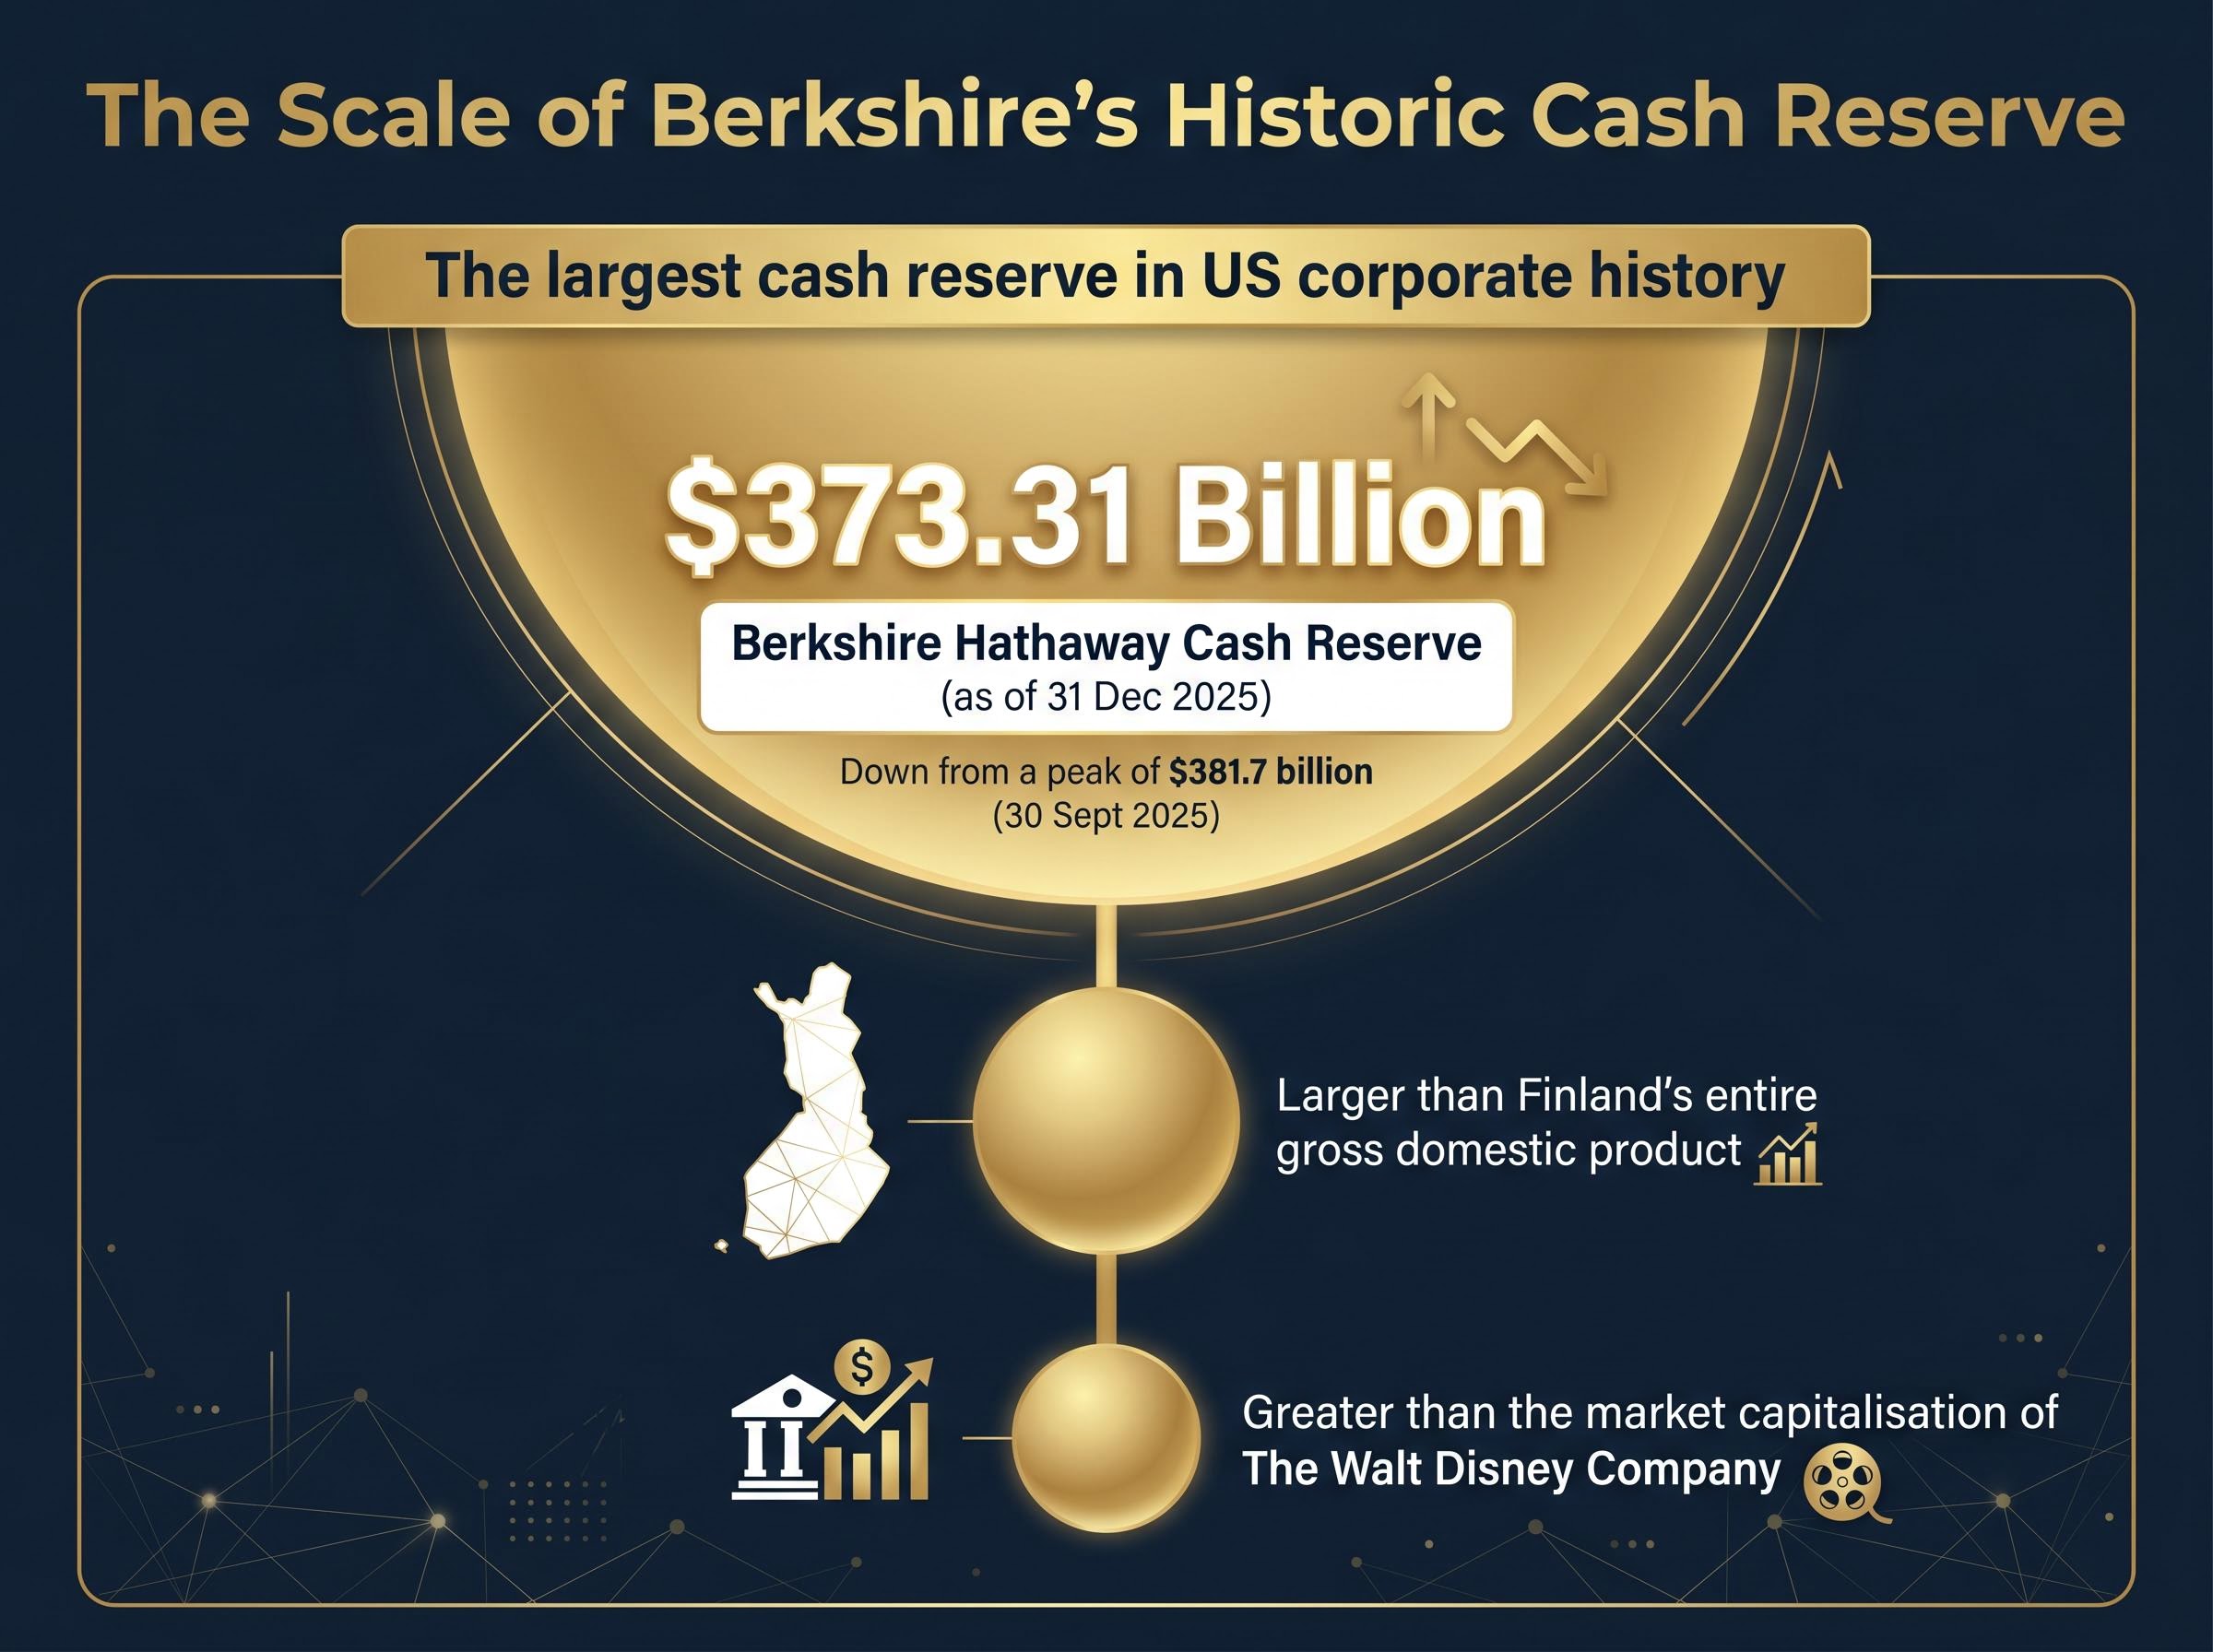
Berkshire Hathaway’s cash pile stood at $373.31 billion as of 31 December 2025, a sum larger than Finland’s entire gross domestic product and greater than the market capitalisation of The Walt Disney Company. It is the largest cash reserve ever accumulated by a single US corporation. Warren Buffett did not stumble into that figure. He built it across 19 months of deliberate abstention from meaningful stock purchases, and then he handed it, along with the company, to his successor.
Buffett’s retirement at 95 and the transfer of operational leadership to Greg Abel marks the most consequential succession in modern investment history. The leadership change itself, though, may matter less than what Buffett chose to leave behind: a cash position constructed during a period when his preferred valuation measure signalled extreme overvaluation and the compensation for taking equity risk had narrowed to levels not seen in over a decade. What follows examines what that cash position reveals about current market conditions, how it fits the historical pattern of Buffett’s three prior accumulation episodes, and what investors should monitor as Abel assumes control of the most closely watched balance sheet in global finance.
The 19-month buying drought that preceded Buffett’s departure was not passive. It was the final act of a career defined by the willingness to sit on capital when prices exceeded intrinsic value. Berkshire’s cash as a proportion of total assets reached levels not seen in over 20 years, and the trajectory was unmistakable: from a peak of $381.7 billion as of 30 September 2025 to a modest drawdown to $373.31 billion by year end. Buffett deployed a fraction of the reserve in his final quarter. He left the vast majority untouched.
Greg Abel inherits both the capital and the discipline that built it. In a 5 March 2026 CNBC interview, Abel signalled continuity with Berkshire’s valuation-driven philosophy while leaving the door open for deployment:
Abel’s March 2026 CNBC interview confirmed that Berkshire’s capital deployment framework remains anchored to opportunity quality rather than any timetable, with Abel explicitly citing acquisitions and internal capital projects as the two primary channels through which the reserve would be reduced.
“As we see opportunity, you’ll see the capital deployed. And we’re deploying it in certain areas across our businesses, across certain capital projects, but also obviously seeking acquisitions.”
The scale of what Abel now stewards bears emphasis:
This is not idle capital. It is a live position, and Abel’s stewardship of it is now one of the most consequential capital allocation decisions in the US market.
Buffett has done this before. Not at this scale, but with the same logic, and each time the outcome rewarded the patience that critics called complacency.
In the late 1960s, Buffett dissolved his investment partnership entirely, returning capital to investors rather than deploying it into a market he considered overpriced. The Dow Jones Industrial Average peaked near 1,000 and did not sustainably surpass that level for nearly two decades.
In the late 1990s, Buffett declined to participate in the technology boom. He was publicly criticised for missing the rally. The NASDAQ Composite subsequently declined approximately 78% from its peak.
Before the Great Recession, Berkshire accumulated substantial cash reserves while credit markets overheated. When the crisis arrived, Buffett deployed that capital into preferred-stock investments in Goldman Sachs and Bank of America on terms unavailable to anyone without both the cash and the nerve to act at the point of maximum fear.
Across roughly six decades, this discipline contributed to Berkshire’s long-run annualised return of approximately 20%. The returns came not despite the periods of inaction but because of them.
| Era | Market Condition at Peak | Buffett’s Action | Subsequent Market Outcome | Deployment Move |
|---|---|---|---|---|
| Late 1960s | Broad equity overvaluation | Dissolved partnership entirely | Dow stagnated near 1,000 for ~20 years | Acquired Berkshire Hathaway; began long-term compounding |
| Late 1990s | Technology bubble | Declined tech stocks; held cash | NASDAQ fell ~78% from peak | Deployed into undervalued businesses post-crash |
| Pre-2008 | Credit and housing bubble | Accumulated cash reserves | S&P 500 fell ~57% peak to trough | Preferred-stock deals with Goldman Sachs, Bank of America |
The current $373 billion reserve exceeds every prior episode in absolute magnitude. It is the largest such position in US corporate history. The strategic rationale, however, is consistent: hold cash when the market offers insufficient compensation for risk, and wait for conditions that offer a genuine margin of safety. The scale is new. The logic is not.
Buffett himself gave investors the tool to understand his behaviour. In a 2001 Fortune magazine article, he described a single ratio as “probably the best single measure of where valuations stand at any given moment”: the total US stock market capitalisation divided by GDP. That ratio is now known as the Buffett Indicator.
The mechanics are straightforward. When the total value of all publicly traded US stocks is low relative to the economy’s output, equities are broadly cheap. When the ratio climbs well above 100%, it signals that stock prices have outpaced the economy’s ability to generate the earnings that justify those prices.
The threshold bands, as interpreted by market practitioners:
The current readings remove ambiguity. As of 30 September 2025 and 31 December 2025, the Buffett Indicator stood at approximately 230%. By late April to early May 2026, it had eased modestly to 223.6%, potentially reflecting a combination of market softness and GDP growth. Both readings sit deep in territory that Buffett has publicly described as dangerous.
Buffett characterised this ratio as arguably the most useful single measure of market valuation. At 223-230%, it sits at levels that have historically preceded periods of subdued equity returns.
The indicator does not predict timing. It does not say when a correction will arrive. What it does is explain, with a single number, why the most disciplined capital allocator in modern history chose to sit on $373 billion rather than put it to work in equities.
The standard criticism of holding cash is that it earns nothing while equities compound. That criticism has not held for several years, and the numbers explain why.
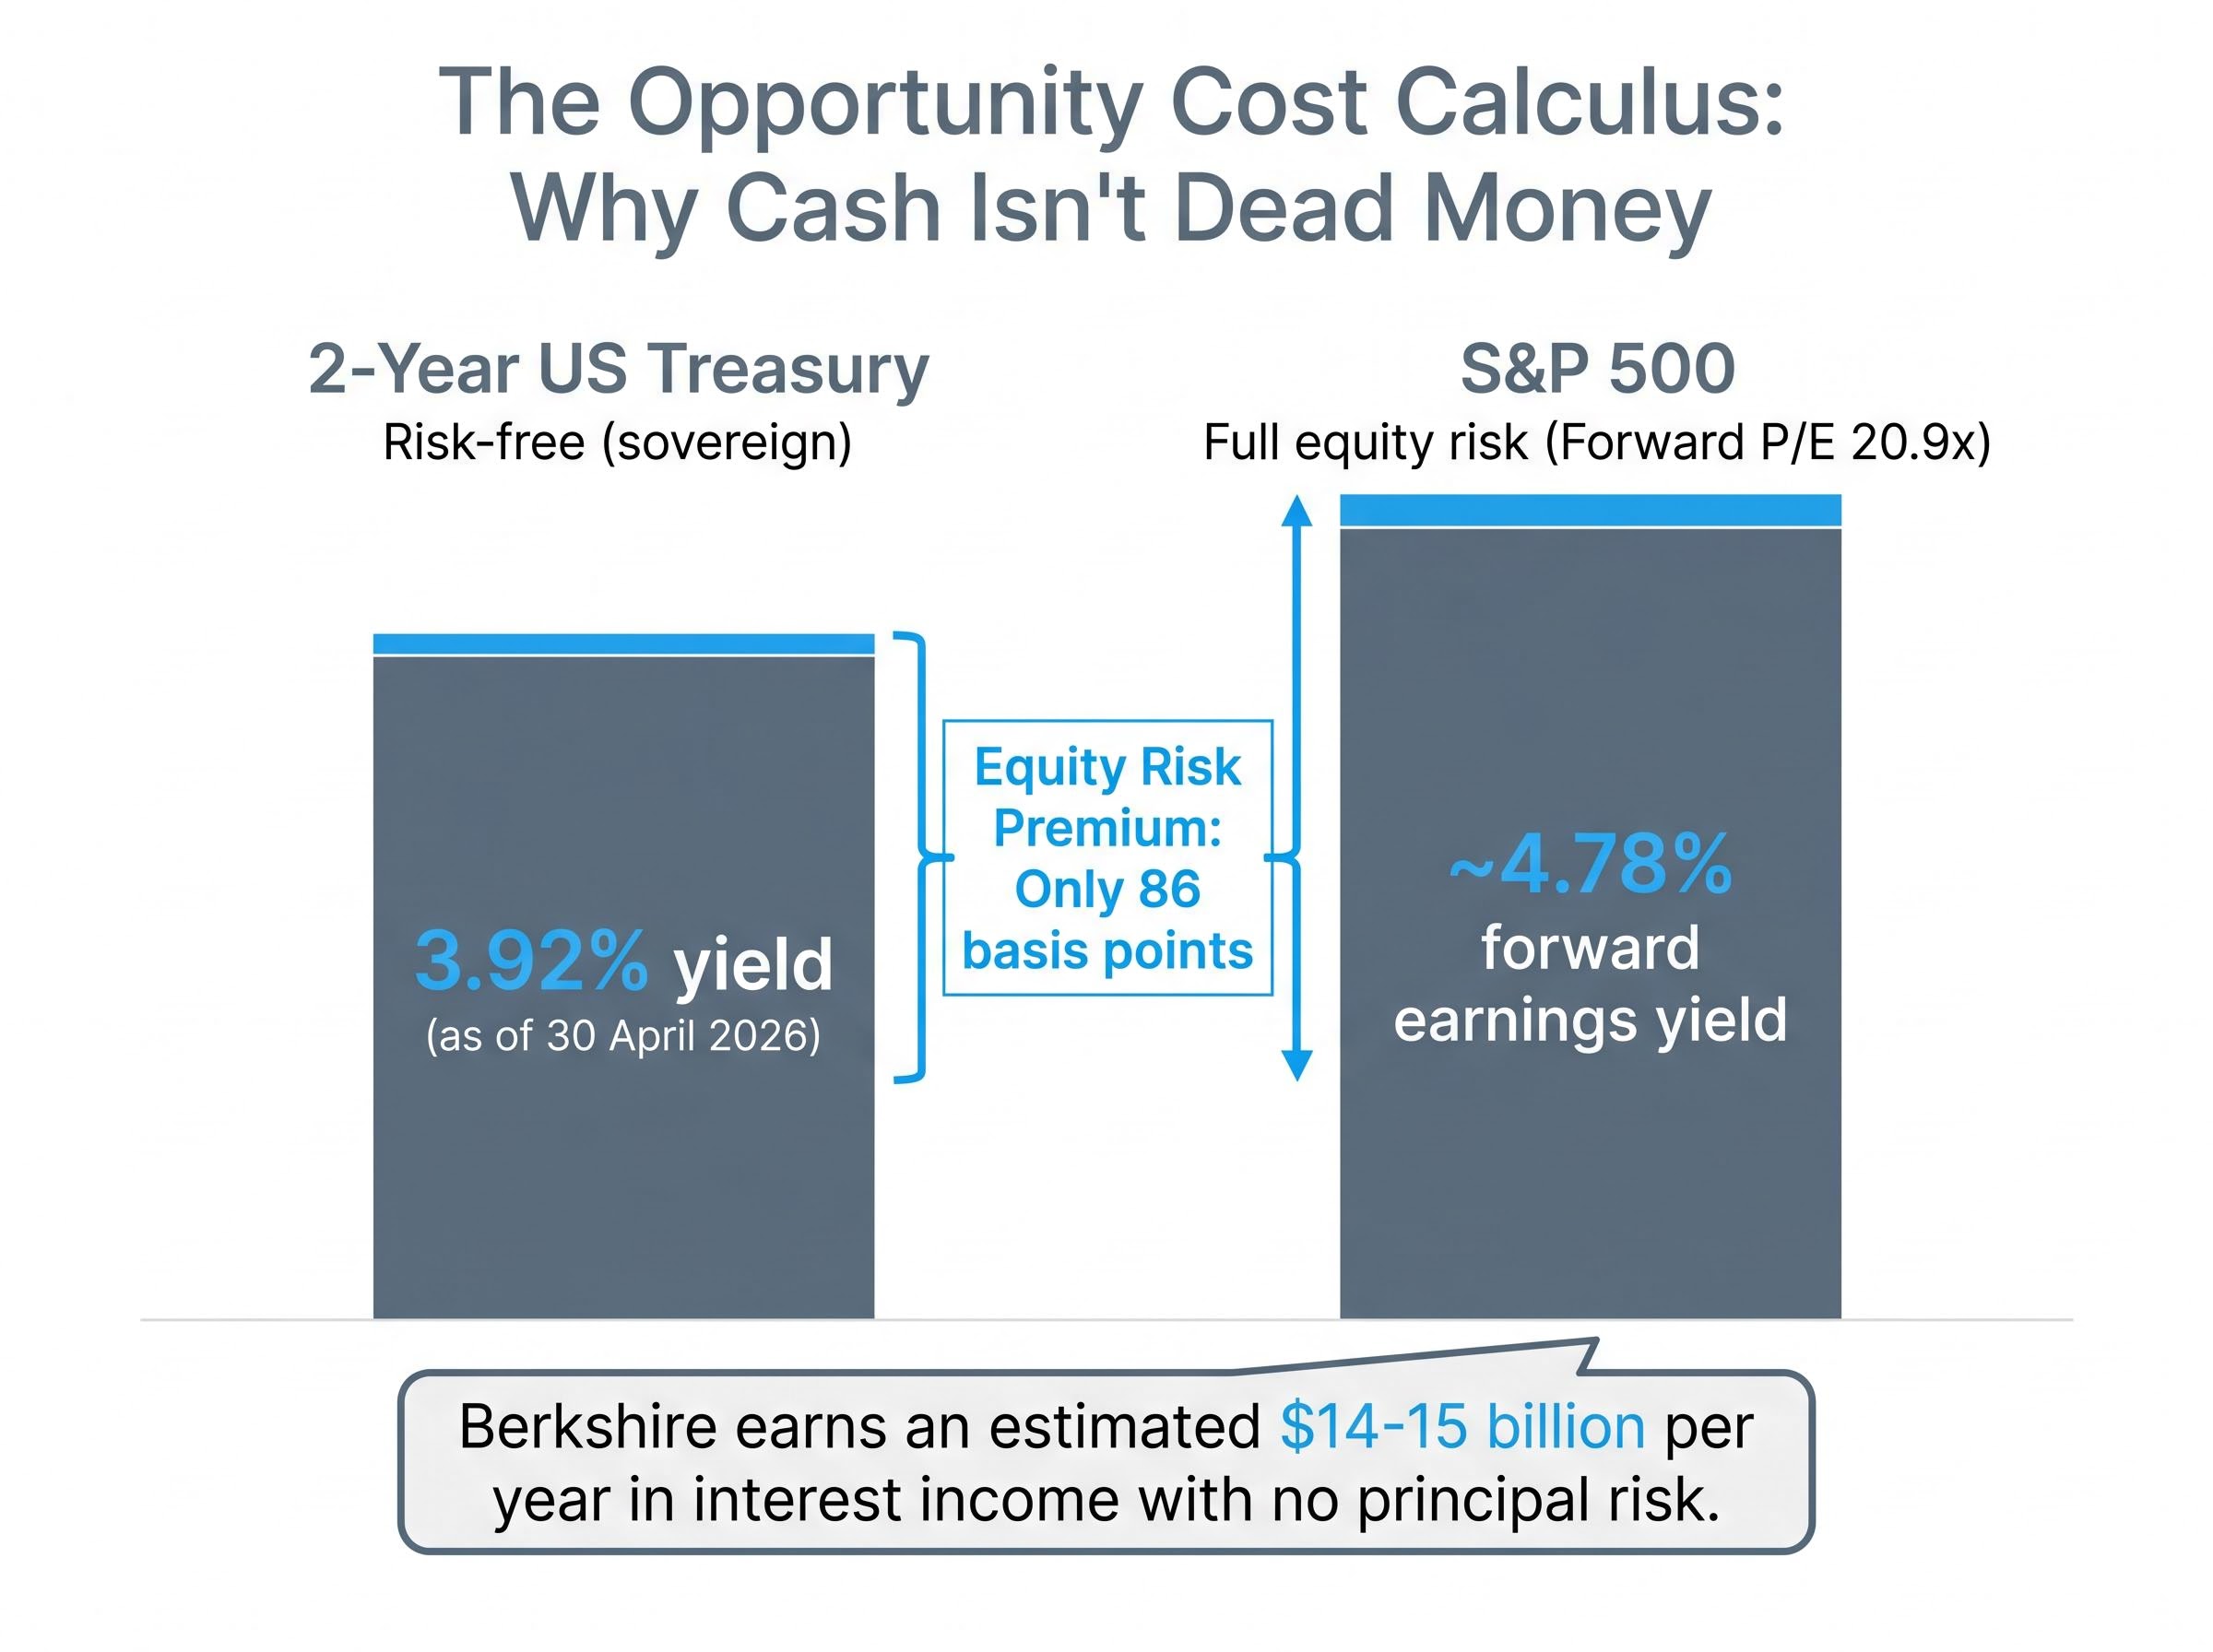
The S&P 500 forward price-to-earnings ratio sits at approximately 20.9x, implying a forward earnings yield of roughly 4.78%. The 2-year US Treasury yields 3.92% as of 30 April 2026. The spread between the two, the equity risk premium, is approximately 86 basis points.
That is the additional return an investor receives for accepting the volatility, drawdown risk, and uncertainty of equities over the guaranteed return of a Treasury bill. By historical standards, 86 basis points is thin.
The case for thin compensation at current valuations is reinforced by underpriced equity market risk across multiple dimensions: the S&P 500 hit its full-year analyst target in April, retail optimism is elevated, and geopolitical disruptions to 20% of global oil supply remain unresolved, compressing the forward return outlook that any deployment of Berkshire’s reserve would need to clear.
Damodaran’s historical equity risk premium data shows the long-run implied ERP for US equities has averaged well above 200 basis points over most modern market cycles, placing the current 86-basis-point spread at the low end of the distribution and consistent with periods that preceded compressed forward equity returns.
| Instrument | Current Yield | Risk Level | Berkshire Est. Annual Income |
|---|---|---|---|
| 2-Year US Treasury | 3.92% | Risk-free (sovereign) | ~$14-15 billion |
| S&P 500 (forward earnings yield) | ~4.78% | Full equity risk | Variable; subject to drawdowns |
At $373 billion invested primarily in short-duration Treasuries, Berkshire earns an estimated $14-15 billion per year in interest income with no principal risk. That is not dead money. It is a productive allocation that preserves optionality while the equity market offers thin compensation for risk.
Three conditions would shift the calculus in favour of deployment:
Until at least one of those conditions materialises, the math favours patience. Berkshire’s scale adds a further constraint: at $373 billion, the universe of acquisitions large enough to move the needle is extremely limited, regardless of market valuation.
Berkshire’s public filings are the most accessible early-warning system available to retail investors monitoring institutional capital deployment. Abel’s stated focus on acquisitions as the primary vehicle for deployment means the signals, when they arrive, are likely to be visible in regulatory disclosures.
A practical monitoring framework involves three indicators:
Abel’s continued patience with the reserve, should it persist, functions as a live confirmation that conditions remain unattractive. Bloomberg Opinion noted in March 2025 that Berkshire’s posture, alongside similar capital-preservation signals from major investors such as Li Ka-shing, could serve as a leading indicator of financial downturn rather than a company-specific anomaly. Reuters confirmed in April 2026 that the cash position performed well during March market volatility, validating the defensive stance.
The window for preparation is before the deployment signal, not after. Investors who wait for Abel to deploy before identifying their own targets will be buying into a market that has already repriced.
The preparation step is specific: identify five to fifteen high-quality businesses with predetermined buy prices now, while conditions are static. The discipline is the same one Berkshire practises at institutional scale, building a watchlist when patience is the correct posture so that conviction is ready when conditions change.
The preparation step is specific: identify five to fifteen high-quality businesses with predetermined buy prices now, while conditions are static, applying the same long-term investing discipline that has generated approximately 9.43% annualised S&P 500 returns over 150 years and that underlies every patient accumulation phase Berkshire has executed.
Berkshire Hathaway’s cash reserve is not a management problem awaiting a solution. It is a coherent, historically grounded response to specific, measurable market conditions: a Buffett Indicator reading above 220%, an equity risk premium of 86 basis points, and a universe of deployment targets constrained by Berkshire’s own scale.
The genuine uncertainty lies ahead. Abel may deploy more aggressively than Buffett’s final years. Market conditions can shift faster than backward-looking indicators suggest. The Q1 2026 figures, scheduled for release on 2 May 2026, may reveal the first evidence of a new deployment posture, or they may confirm that patience remains the dominant strategy.
The principles that explain Berkshire’s position, margin of safety, capital preservation, and the willingness to wait, are not proprietary. They are available to any investor as a framework. The largest cash reserve in corporate history is, at its core, a reminder that the hardest thing in markets is doing nothing when nothing is the right thing to do.
This article is for informational purposes only and should not be considered financial advice. Investors should conduct their own research and consult with financial professionals before making investment decisions. Past performance does not guarantee future results. Financial projections are subject to market conditions and various risk factors.
The Buffett Indicator is the ratio of total US stock market capitalisation to GDP, and Buffett described it as probably the best single measure of where valuations stand at any given moment. A reading above 200% has historically been associated with extreme overvaluation and periods of poor subsequent equity returns; the indicator currently sits at approximately 223-230%.
Berkshire Hathaway held $373.31 billion in cash as of 31 December 2025, the largest cash reserve ever accumulated by a single US corporation, exceeding Finland's entire GDP and the market capitalisation of The Walt Disney Company.
Berkshire has held back from major equity purchases because the Buffett Indicator stands above 220%, the equity risk premium is a historically thin 86 basis points, and suitable acquisition targets at prices offering a genuine margin of safety have not materialised at the scale Berkshire requires.
Greg Abel is Warren Buffett's successor as operational leader of Berkshire Hathaway, having taken over following Buffett's retirement at 95. Abel has signalled he will deploy the $373 billion reserve based on opportunity quality rather than any fixed timetable, prioritising acquisitions and internal capital projects.
Investors can track Berkshire's quarterly 13F filings for new equity positions, monitor the cash balance trajectory across earnings releases for a sustained drawdown rather than a single-quarter dip, and watch the Buffett Indicator for reversion toward historical fair-value ranges below 120%.