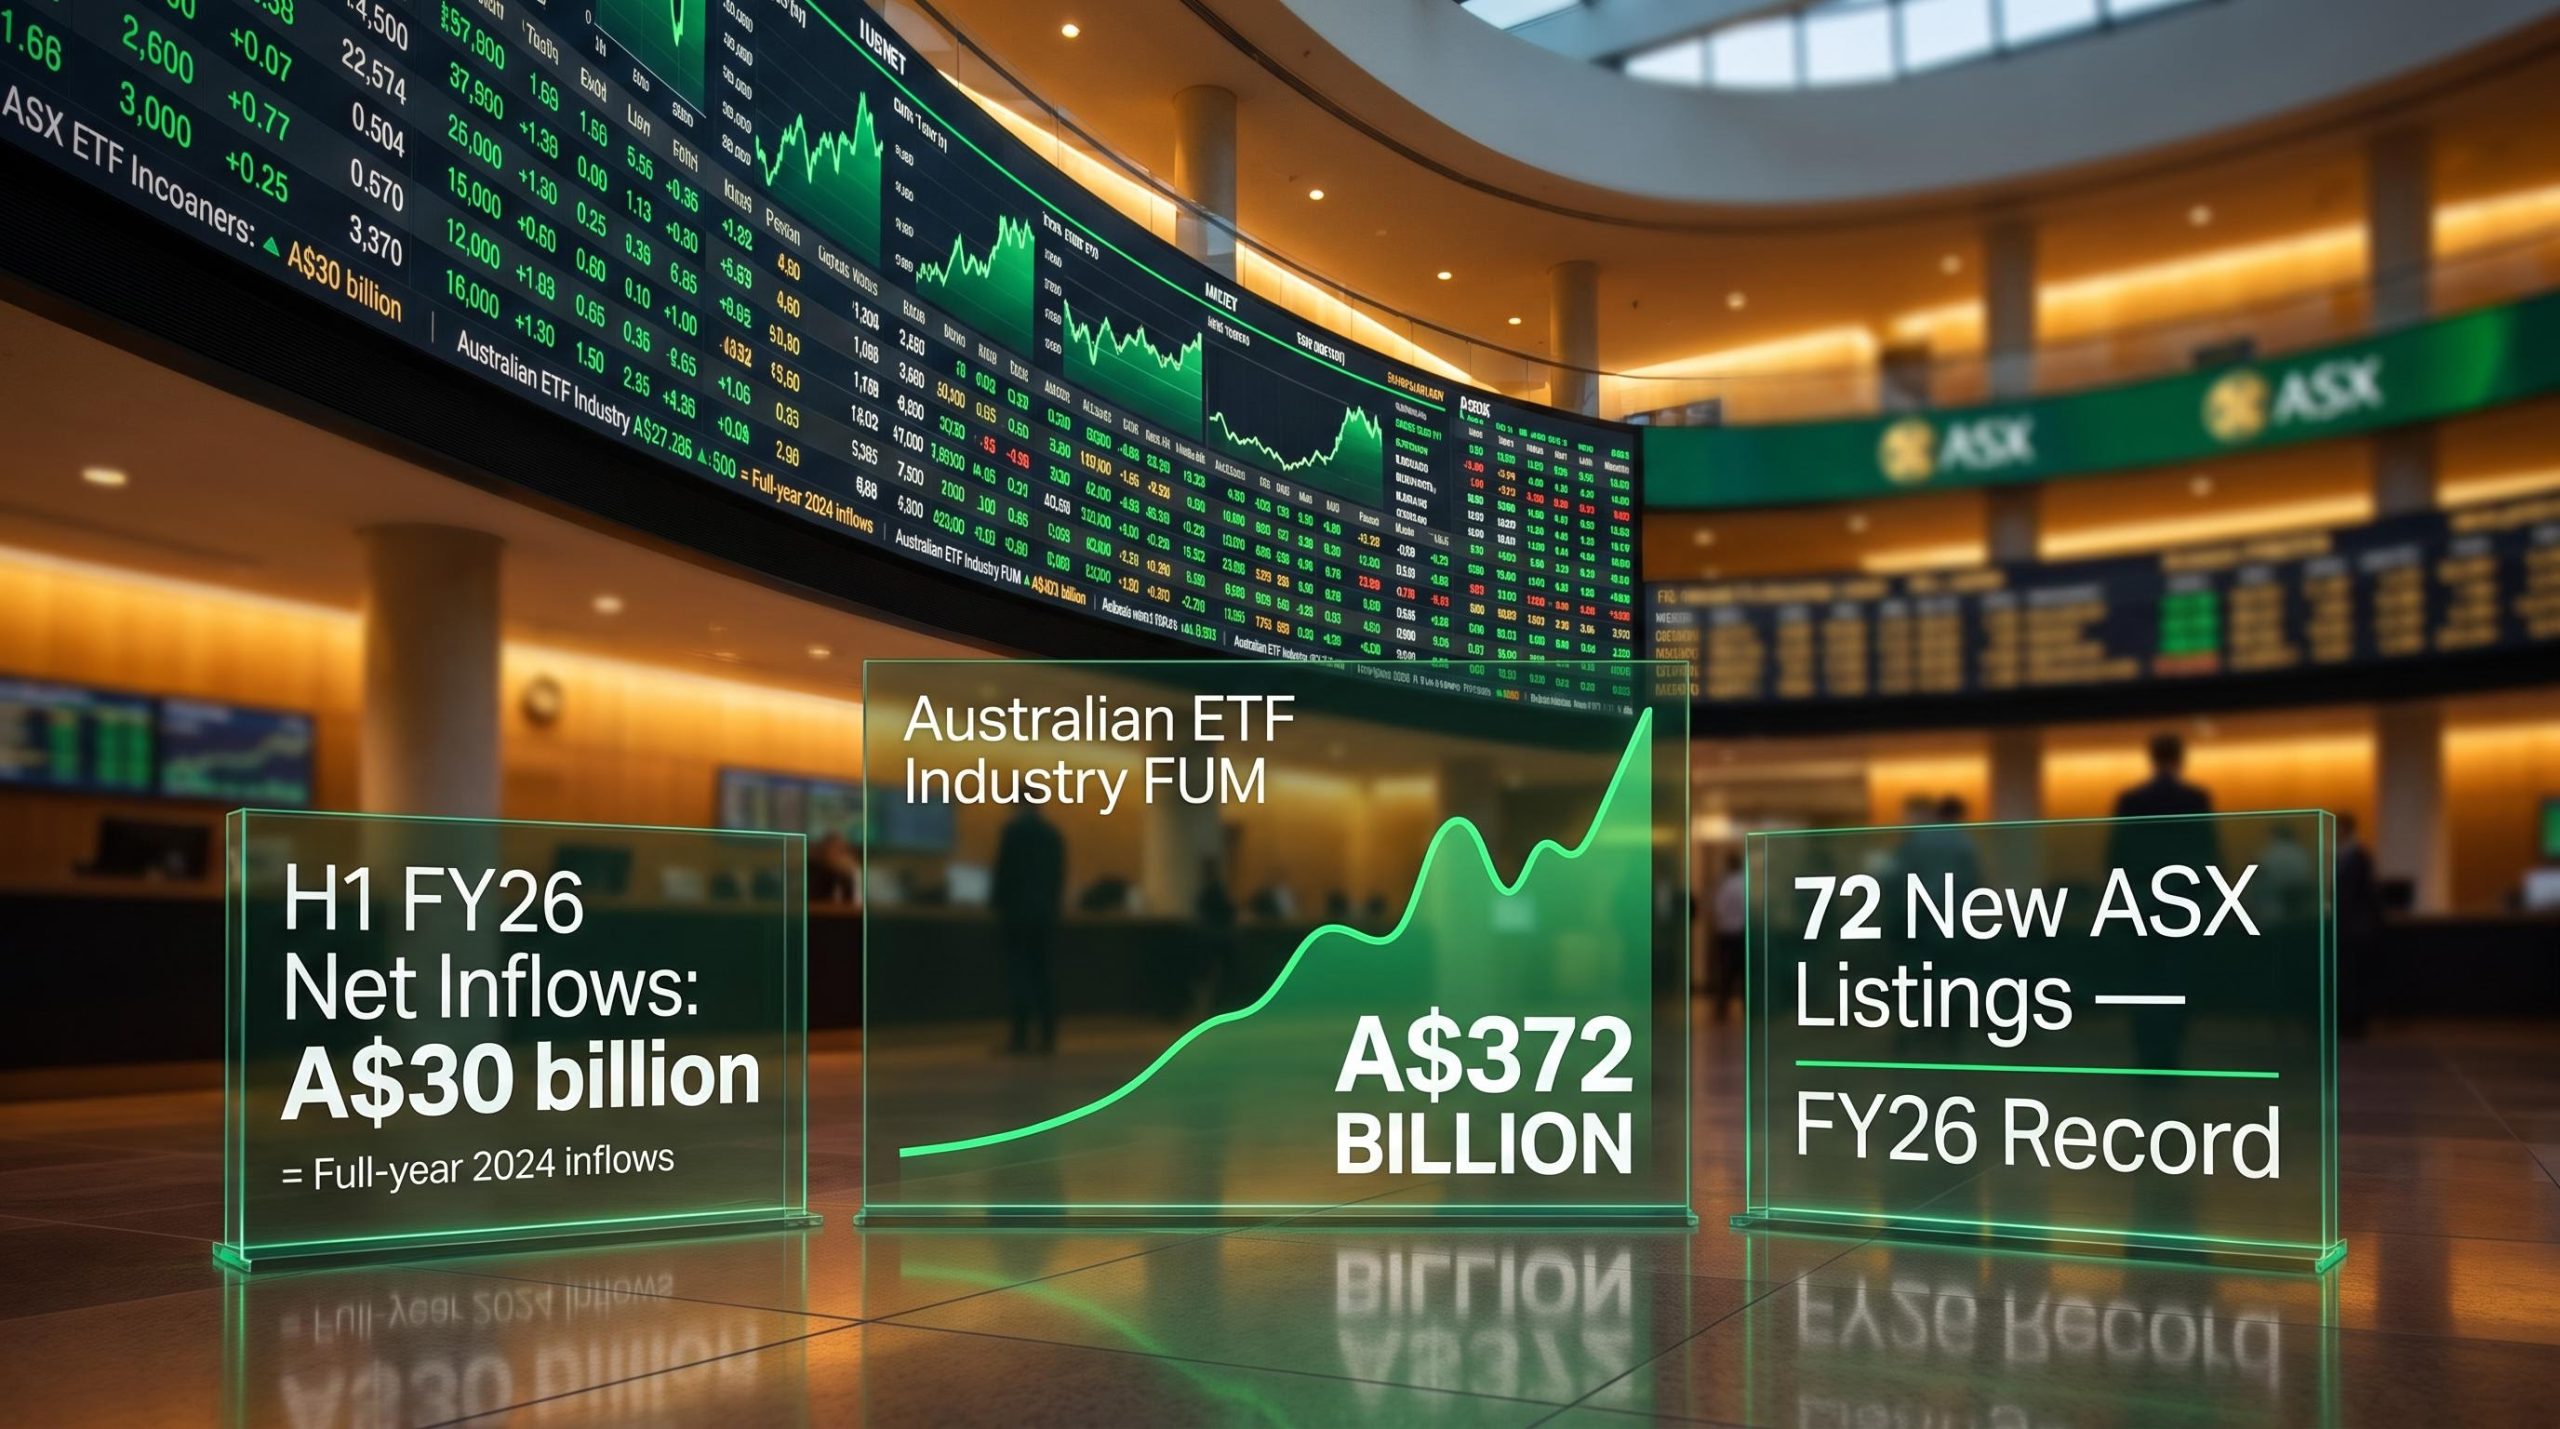
The net inflows recorded by the Australian ETF industry across the opening six months of FY26 equalled the entire annual figure for 2024, with roughly A$30 billion flowing into the market over that half-year period alone. That single comparison captures the velocity of change better than any headline figure.
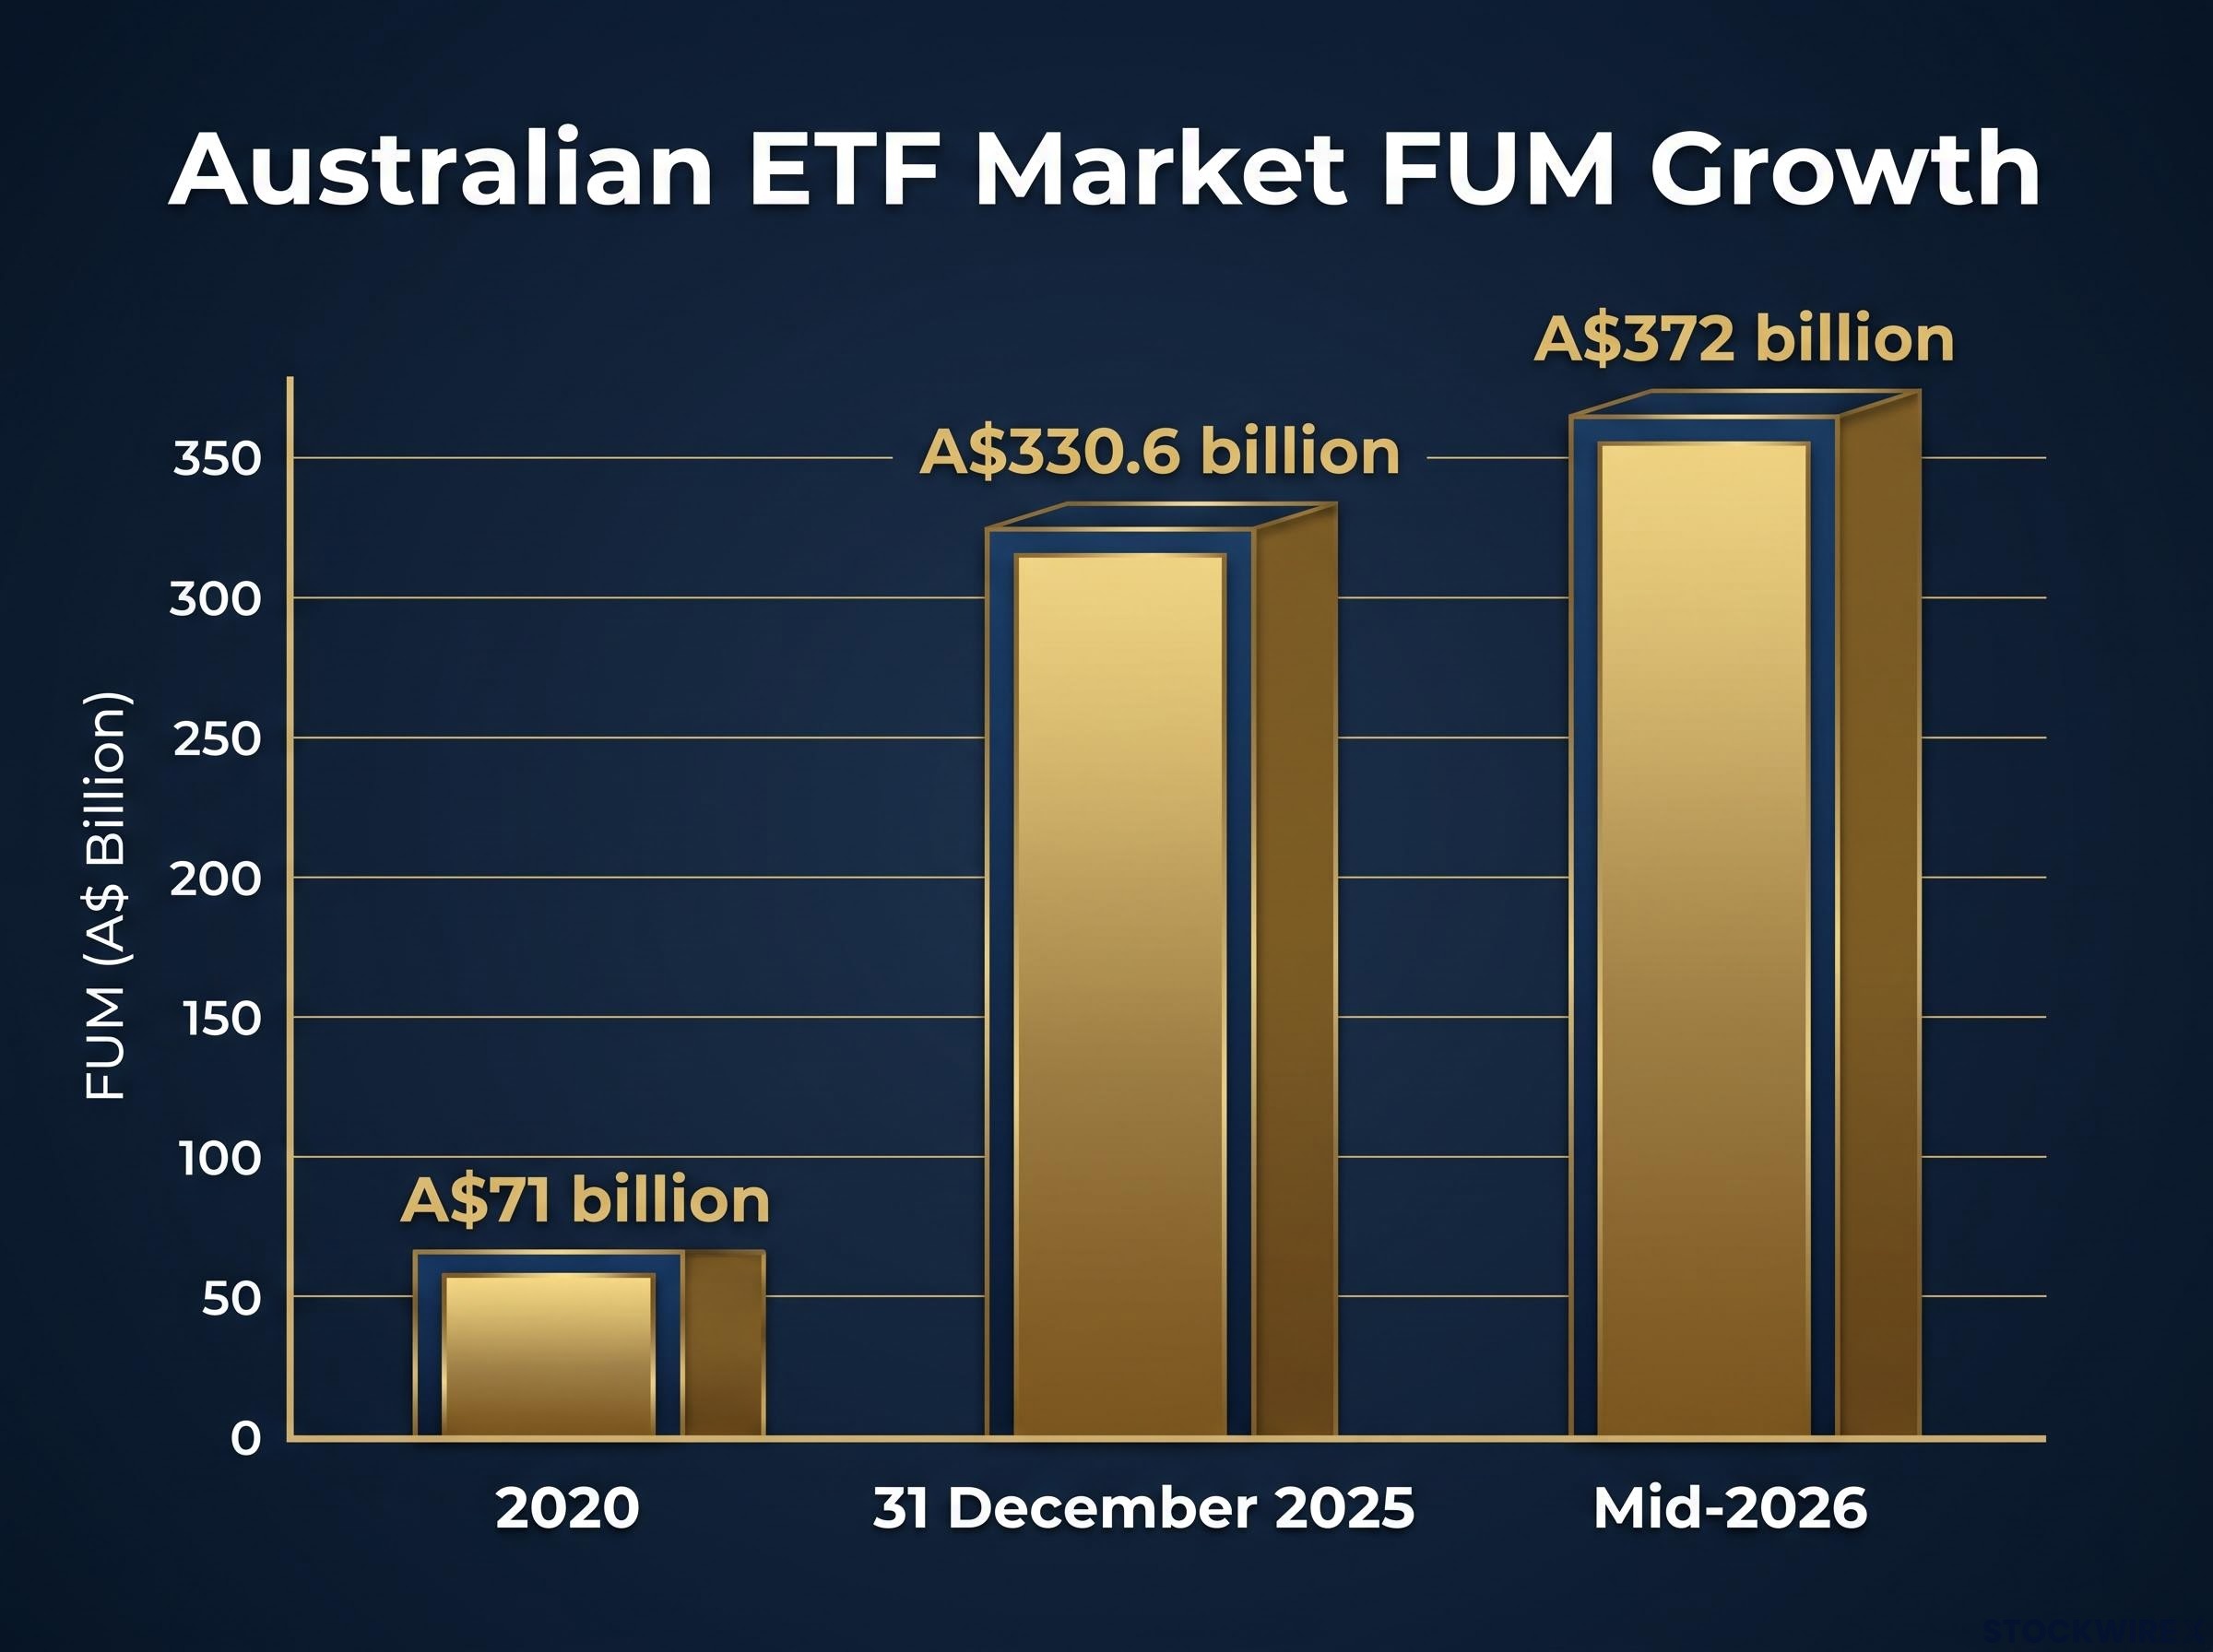
The context behind it is striking. Total industry assets have crossed a new record at A$372 billion, a figure that was unimaginable five years ago when the entire market sat at roughly A$71 billion. This is not a cyclical surge driven by one strong quarter. It is a structural reordering of how Australians invest.
Here is what the data actually tells you: what is driving the acceleration, what the record product launch figures mean for the choices available, and whether the momentum shows any sign of slowing.
A market that has quadrupled in five years
The growth arc from 2020 to mid-2026 does not need editorial embellishment. The numbers speak clearly enough:
- 2020: approximately A$71 billion in industry FUM
- 31 December 2025: A$330.6 billion, representing 34.2% year-on-year growth (Global X)
- September 2025: more than A$300 billion (ASX data)
- Mid-2026: A$372 billion, a new all-time record (Betashares)
One scope distinction matters here. The A$372 billion figure covers the total Australian ETF industry across both the ASX and Cboe exchanges. ASX-listed ETFs specifically hold more than A$350 billion across 458 products. Both reference points appear in industry reporting, and the table below separates them clearly.
| Metric | ASX-listed ETFs only | Australian ETF industry (ASX + Cboe) | Source |
|---|---|---|---|
| FUM (mid-2026) | A$350+ billion | A$372 billion | ASX FY26 release; Betashares; Grafa |
| Products (mid-2026) | 458 | ~494-496 | ASX; Betashares/Newswire; Grafa |
| New listings in FY26 | 72 (record) | Not separately reported | ASX FY26 release |
| H1 FY26 net inflows | Part of industry total | A$30 billion | Betashares half-year 2026 review |
| Full-year FY26 inflows | A$50+ billion (ASX ref.) | A$50-62 billion range | ASX; Grafa |
| Calendar 2024 net inflows | A$30 billion | A$30 billion | Betashares (comparison figure) |
Trading activity across ASX-listed ETFs rose 26% year-on-year, according to ASX and ABC reporting. This is not a market finding its feet. It has reached a scale where ignoring it entirely carries its own risk.
When big ASX news breaks, our subscribers know first
Why the inflow comparison is the real story
The headline FUM number is a record, but it is the inflow pace that deserves attention. According to Betashares’ half-year 2026 ETF review, A$30 billion in net inflows entered the Australian ETF industry in H1 FY26 alone. That matches what the entire industry attracted across all of 2024.
A$30 billion in six months, the same amount the industry received over the entirety of calendar 2024.
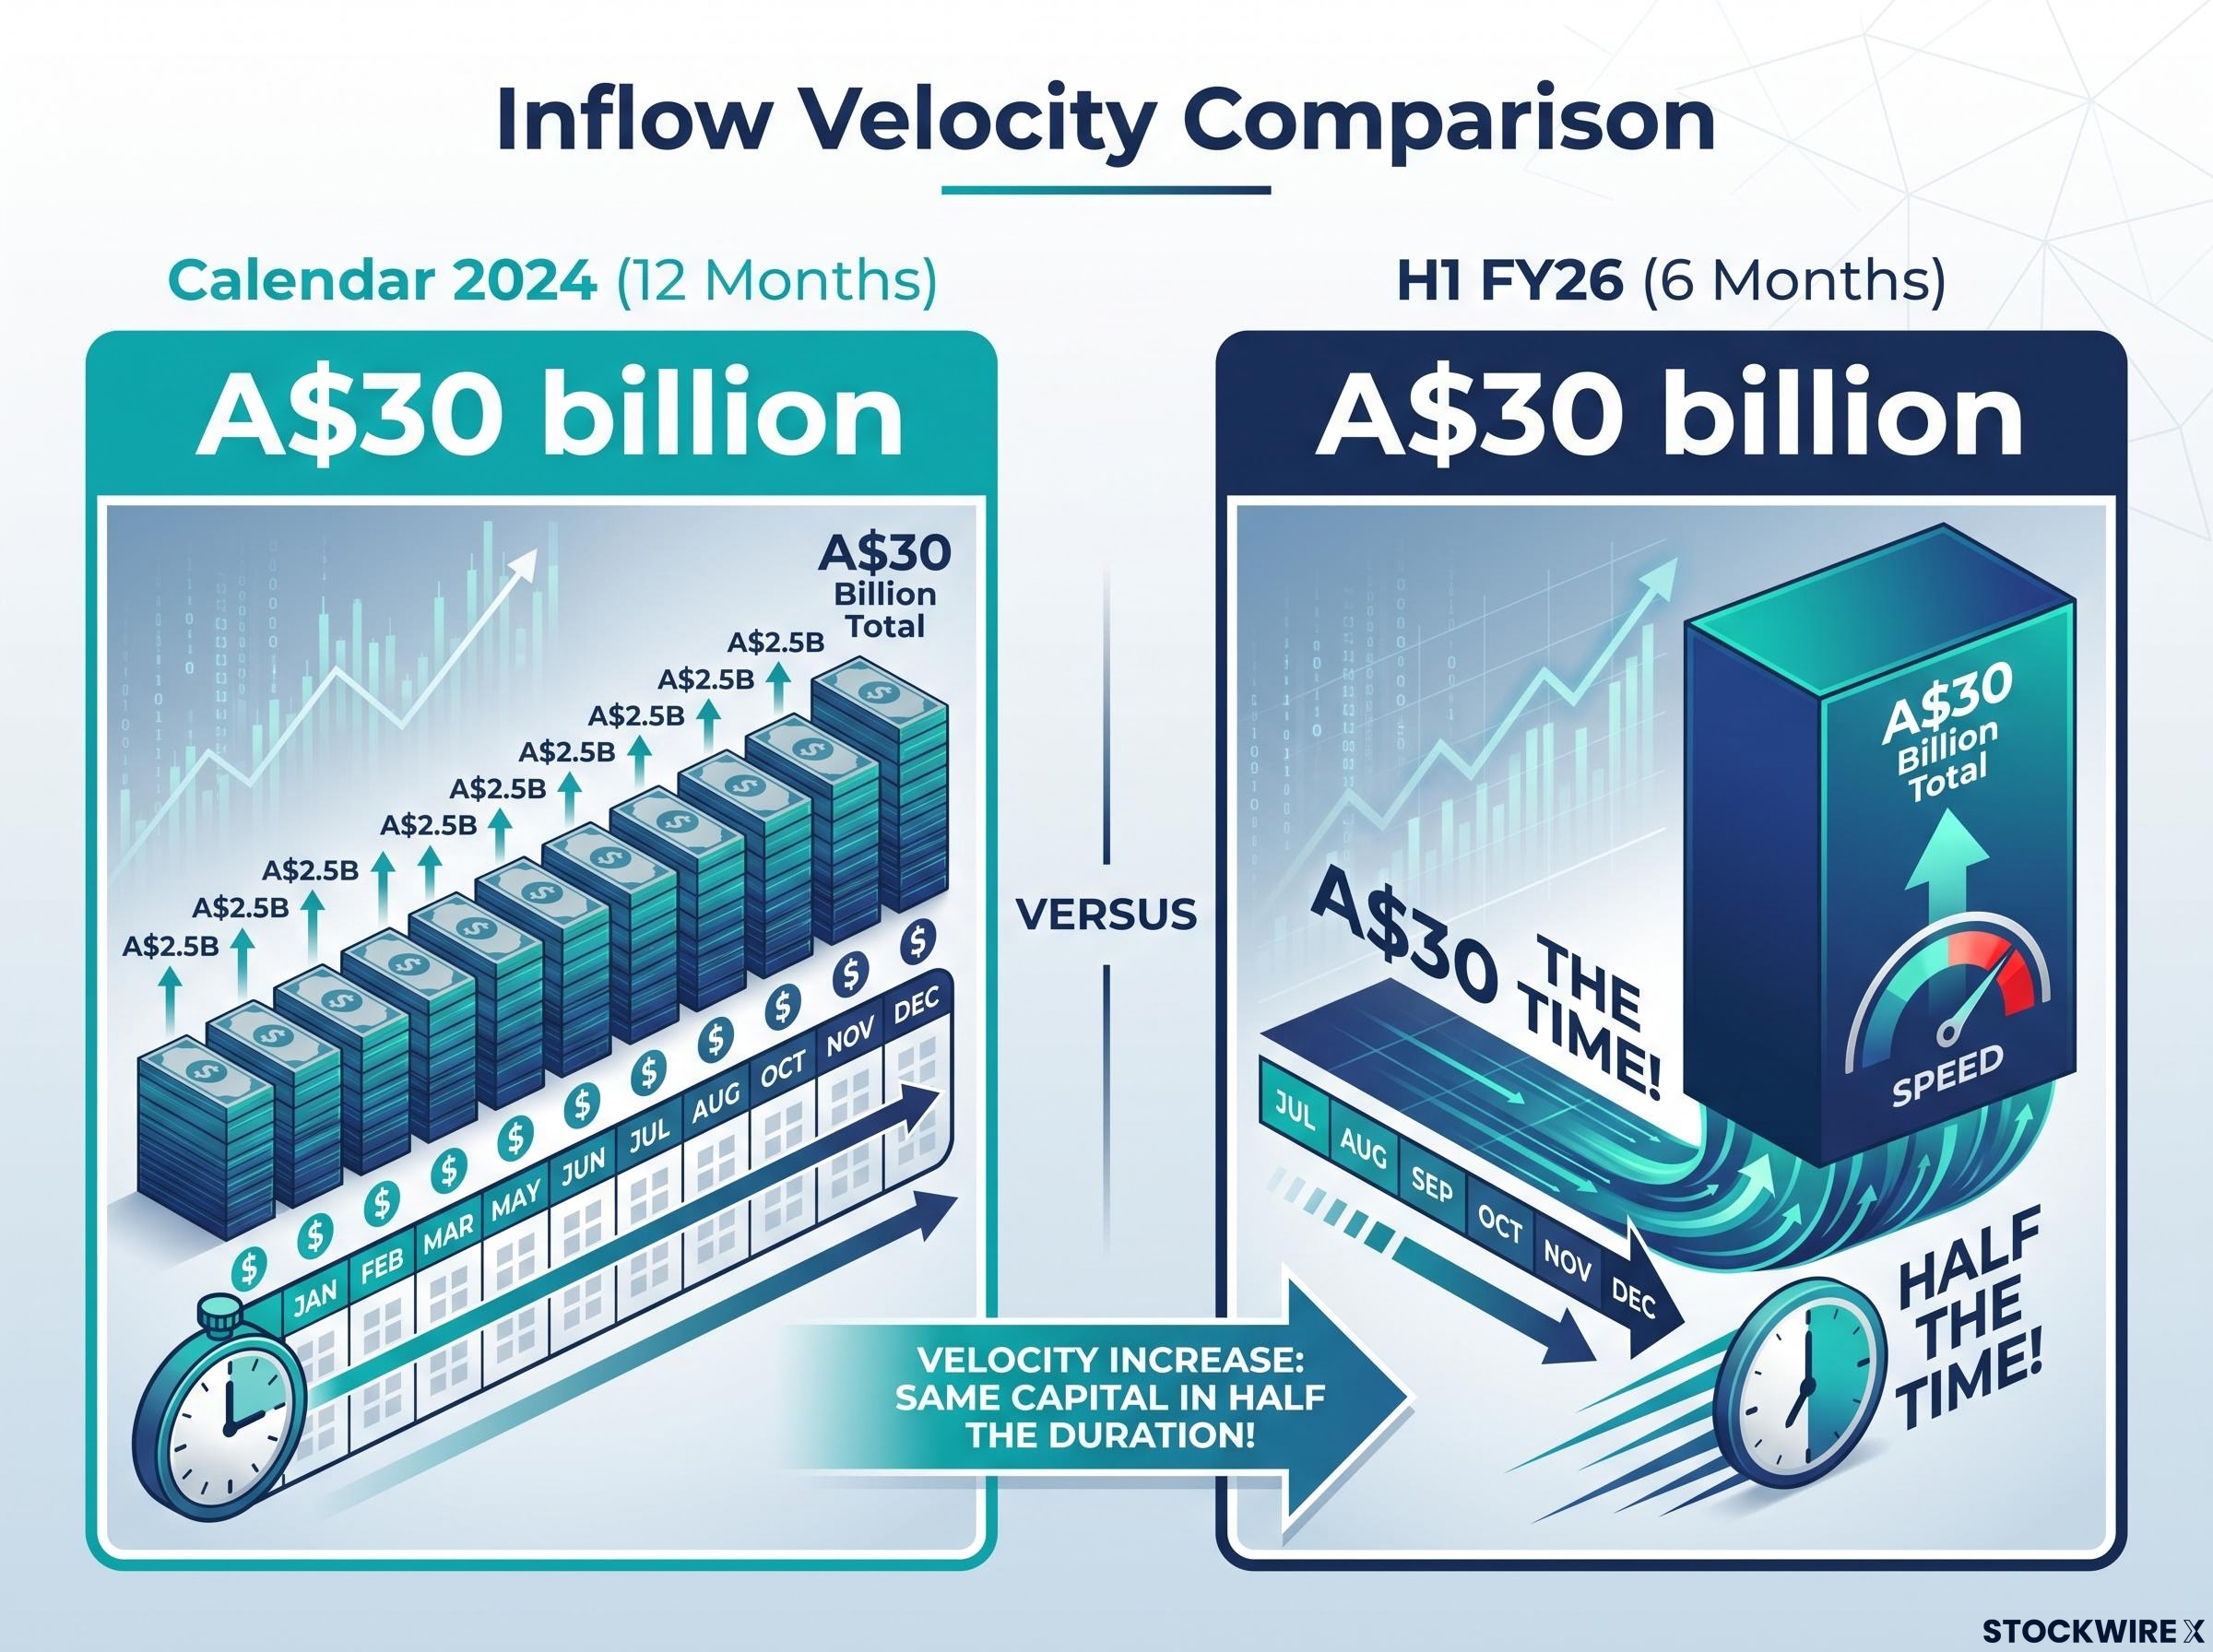
That is not normal acceleration. Something structural, not seasonal, has changed in how Australians are choosing to deploy capital.
The ETF bubble debate has intensified alongside the market’s growth, but the structure itself, specifically the creation and redemption mechanism that keeps ETF prices anchored to the net asset value of underlying holdings, means the wrapper cannot become detached from its assets in the way a traditional speculative bubble does.
Full-year FY26 inflows sit in a range across sources:
- A$50+ billion per ASX
- A$61.6 billion per Grafa
- A$53 billion in calendar 2025 net inflows per Global X (a separate reference point)
The H1 figure therefore represents roughly half of the full-year total, confirming that the inflow velocity held across both halves. Once the flow pace is understood, the record AUM figure starts to look like an inevitable outcome rather than a surprise.
What is driving the shift away from active management
The inflows are not arriving by accident. A structural shift in investor behaviour is behind them, and it starts with a change in how Australians think about fund management itself.
Marc Jocum, Senior Investment Strategist at Global X, framed the trend in commentary reported by the Australian Financial Review: investors are moving away from delegating capital to active fund managers in the expectation of outperformance and toward directly selecting specific exposure themes through ETFs.
According to Marc Jocum of Global X, as cited by the Australian Financial Review, the growth reflects a shift from delegated active management to self-directed thematic exposure, with investors increasingly choosing their own sector and theme allocations rather than paying a manager to do it for them.
That shift is being reinforced on the supply side. The conversion of unlisted managed funds into active ETFs, as noted in Global X’s landscape report, has expanded the product range available on-exchange. ETFs’ low-cost, transparent, exchange-traded structure gives them a competitive advantage over traditional unlisted funds, particularly now that thematic and active options sit alongside broad index trackers.
Trading activity rising 26% year-on-year is the behavioural signal that confirms the trend. Australians are not just buying ETFs; they are trading them more frequently, which points to an investor cohort that is actively managing its own exposures. That carries implications for due diligence: decisions that were previously handled by fund managers are now sitting with individual investors.
Record product launches and the thematic frontier
The demand signal has produced a supply-side response. The ASX recorded 72 new ETF listings across FY26, a figure that surpassed every previous financial year and lifted the total on-exchange product count to 458.
Industry-wide (ASX and Cboe combined), the product count now sits at approximately 494-496, according to Betashares, Financial Newswire, and Grafa.
The ASX FY26 ETF market milestone release confirms 72 new listings across the financial year, a 26% rise in trading activity, and more than A$350 billion in assets held across 458 on-exchange products, providing the authoritative baseline for each of those figures.
- 72 new ASX listings in FY26 (record)
- 458 total ASX-listed products
- 494-496 total industry-wide products
- Energy transition and artificial intelligence: the two clearest thematic growth areas attracting new launches
Where the new products are pointing
The concentration of new product development around energy transition and AI themes is not coincidental. These are the two structural investment narratives that have attracted the strongest investor interest, and issuers are building products to meet that demand.
Thematic ETF timing risk is particularly acute when issuers launch products in response to investor demand that has already driven valuations higher, a dynamic illustrated by the ARK Innovation case where reported returns of approximately 233% translated into an estimated negative 35% for investors who entered near peak inflows.
Active ETFs and targeted strategies, not just passive index funds, are a growing segment of the new launch pipeline. The line between active management and ETF structure is blurring, with fund managers increasingly wrapping active strategies in an ETF format to capture the structural migration of capital.
If you last reviewed your ETF options even 12 months ago, the product set has changed materially. The choice set is expanding rapidly, but so is the complexity of selecting the right product.
For investors wanting to act on the expanded product set rather than simply observe it, our dedicated guide to choosing an ETF covers the eight-step due diligence framework, including how a 0.95 percentage point fee difference can cost approximately $100,000 over 20 years on a standard portfolio.
Scale, maturity, and what the record means for Australian investors
A A$372 billion industry with nearly 500 products is structurally different from the niche asset class the Australian ETF market was five years ago. The ASX itself describes the market’s current state as reflecting “scale and maturity,” and that framing carries practical weight.
A larger, more liquid market generally means tighter bid-ask spreads (the gap between the price a buyer will pay and a seller will accept) and greater product durability. For retail investors, that translates to lower trading costs and reduced risk that a product will be delisted due to insufficient scale. Trading activity rising 26% year-on-year reinforces the liquidity signal.
If you have been cautious about ETF liquidity or product survival risk, the environment those concerns were formed in no longer exists. The risk profile of ETF investing in Australia has shifted alongside the market’s growth.
This article is for informational purposes only and should not be considered financial advice. Investors should conduct their own research and consult with financial professionals before making investment decisions.
What this pace of growth signals about where the market is heading
The H1 FY26 inflow pace of A$30 billion, if sustained, would imply a full-year figure well above any prior calendar year. The full-year FY26 range of A$50-62 billion already confirms that acceleration played out across the period.
Several structural tailwinds support continued growth:
- The ongoing conversion of unlisted managed funds into active ETFs, expanding the on-exchange product set
- The broadening of thematic product ranges around energy transition, AI, and targeted strategies
- A generational wealth transfer toward investor cohorts more comfortable with self-directed ETF access than delegated active management
The record 72 new product launches and 26% year-on-year trading activity growth both point to a supply-demand dynamic that shows no visible sign of saturation at mid-2026. The convergence of record inflows, record listings, and rising engagement tells you the Australian ETF market is not peaking but is in a phase of structural expansion.
Industry consensus behind the A$400 billion outlook is supported by April 2026 data showing international equities attracting close to half of total monthly inflows, confirming that the structural decline in Australian investors’ home bias is a durable component of the demand picture, not a one-month anomaly.
The question for investors is no longer whether to pay attention. It is how to position within a market that now offers nearly 500 products and is still accelerating.
Past performance does not guarantee future results. These forward-looking observations are subject to change based on market developments and investor behaviour.