Is Woolworths’ Share Price Rally Ahead of Its Earnings?
10 mins ago


Commonwealth Bank shares suffered the largest single-day fall in the company’s listed history earlier this month, shedding roughly 10% in a single session. That event was not an accident or an outlier. It was the intersection of several pressures that have been building across the Australian economy for months: three consecutive interest rate hikes, a deteriorating labour market, an oil supply shock that pushed Brent crude above US$100 per barrel, and a Federal Budget that rattled investor confidence in equities and property through sweeping capital gains tax reform. What follows is an analysis of what specifically triggered CBA’s crash, the broader macroeconomic storm now battering ASX bank shares as a sector, the valuation risk investors face at current prices, and what Morgan Stanley’s earnings downgrade projections signal about the road ahead.
The crash did not arrive from a single direction. It arrived as two separate shocks, landing within 24 hours of each other and compounding in a way that left investors nowhere to stand.
The headline number was not a disaster. The problem was what sat beneath it. Cash profit fell 1% against the first-half quarterly average, triggering disappointment among investors who had priced in sustained momentum at elevated multiples.
The detail that crystallised concern: CBA increased bad debt provisions by $200 million, attributing the increase to heightened geopolitical and economic uncertainty. That line item named the risks most investors had been watching from a distance and placed them inside the bank’s own balance sheet.
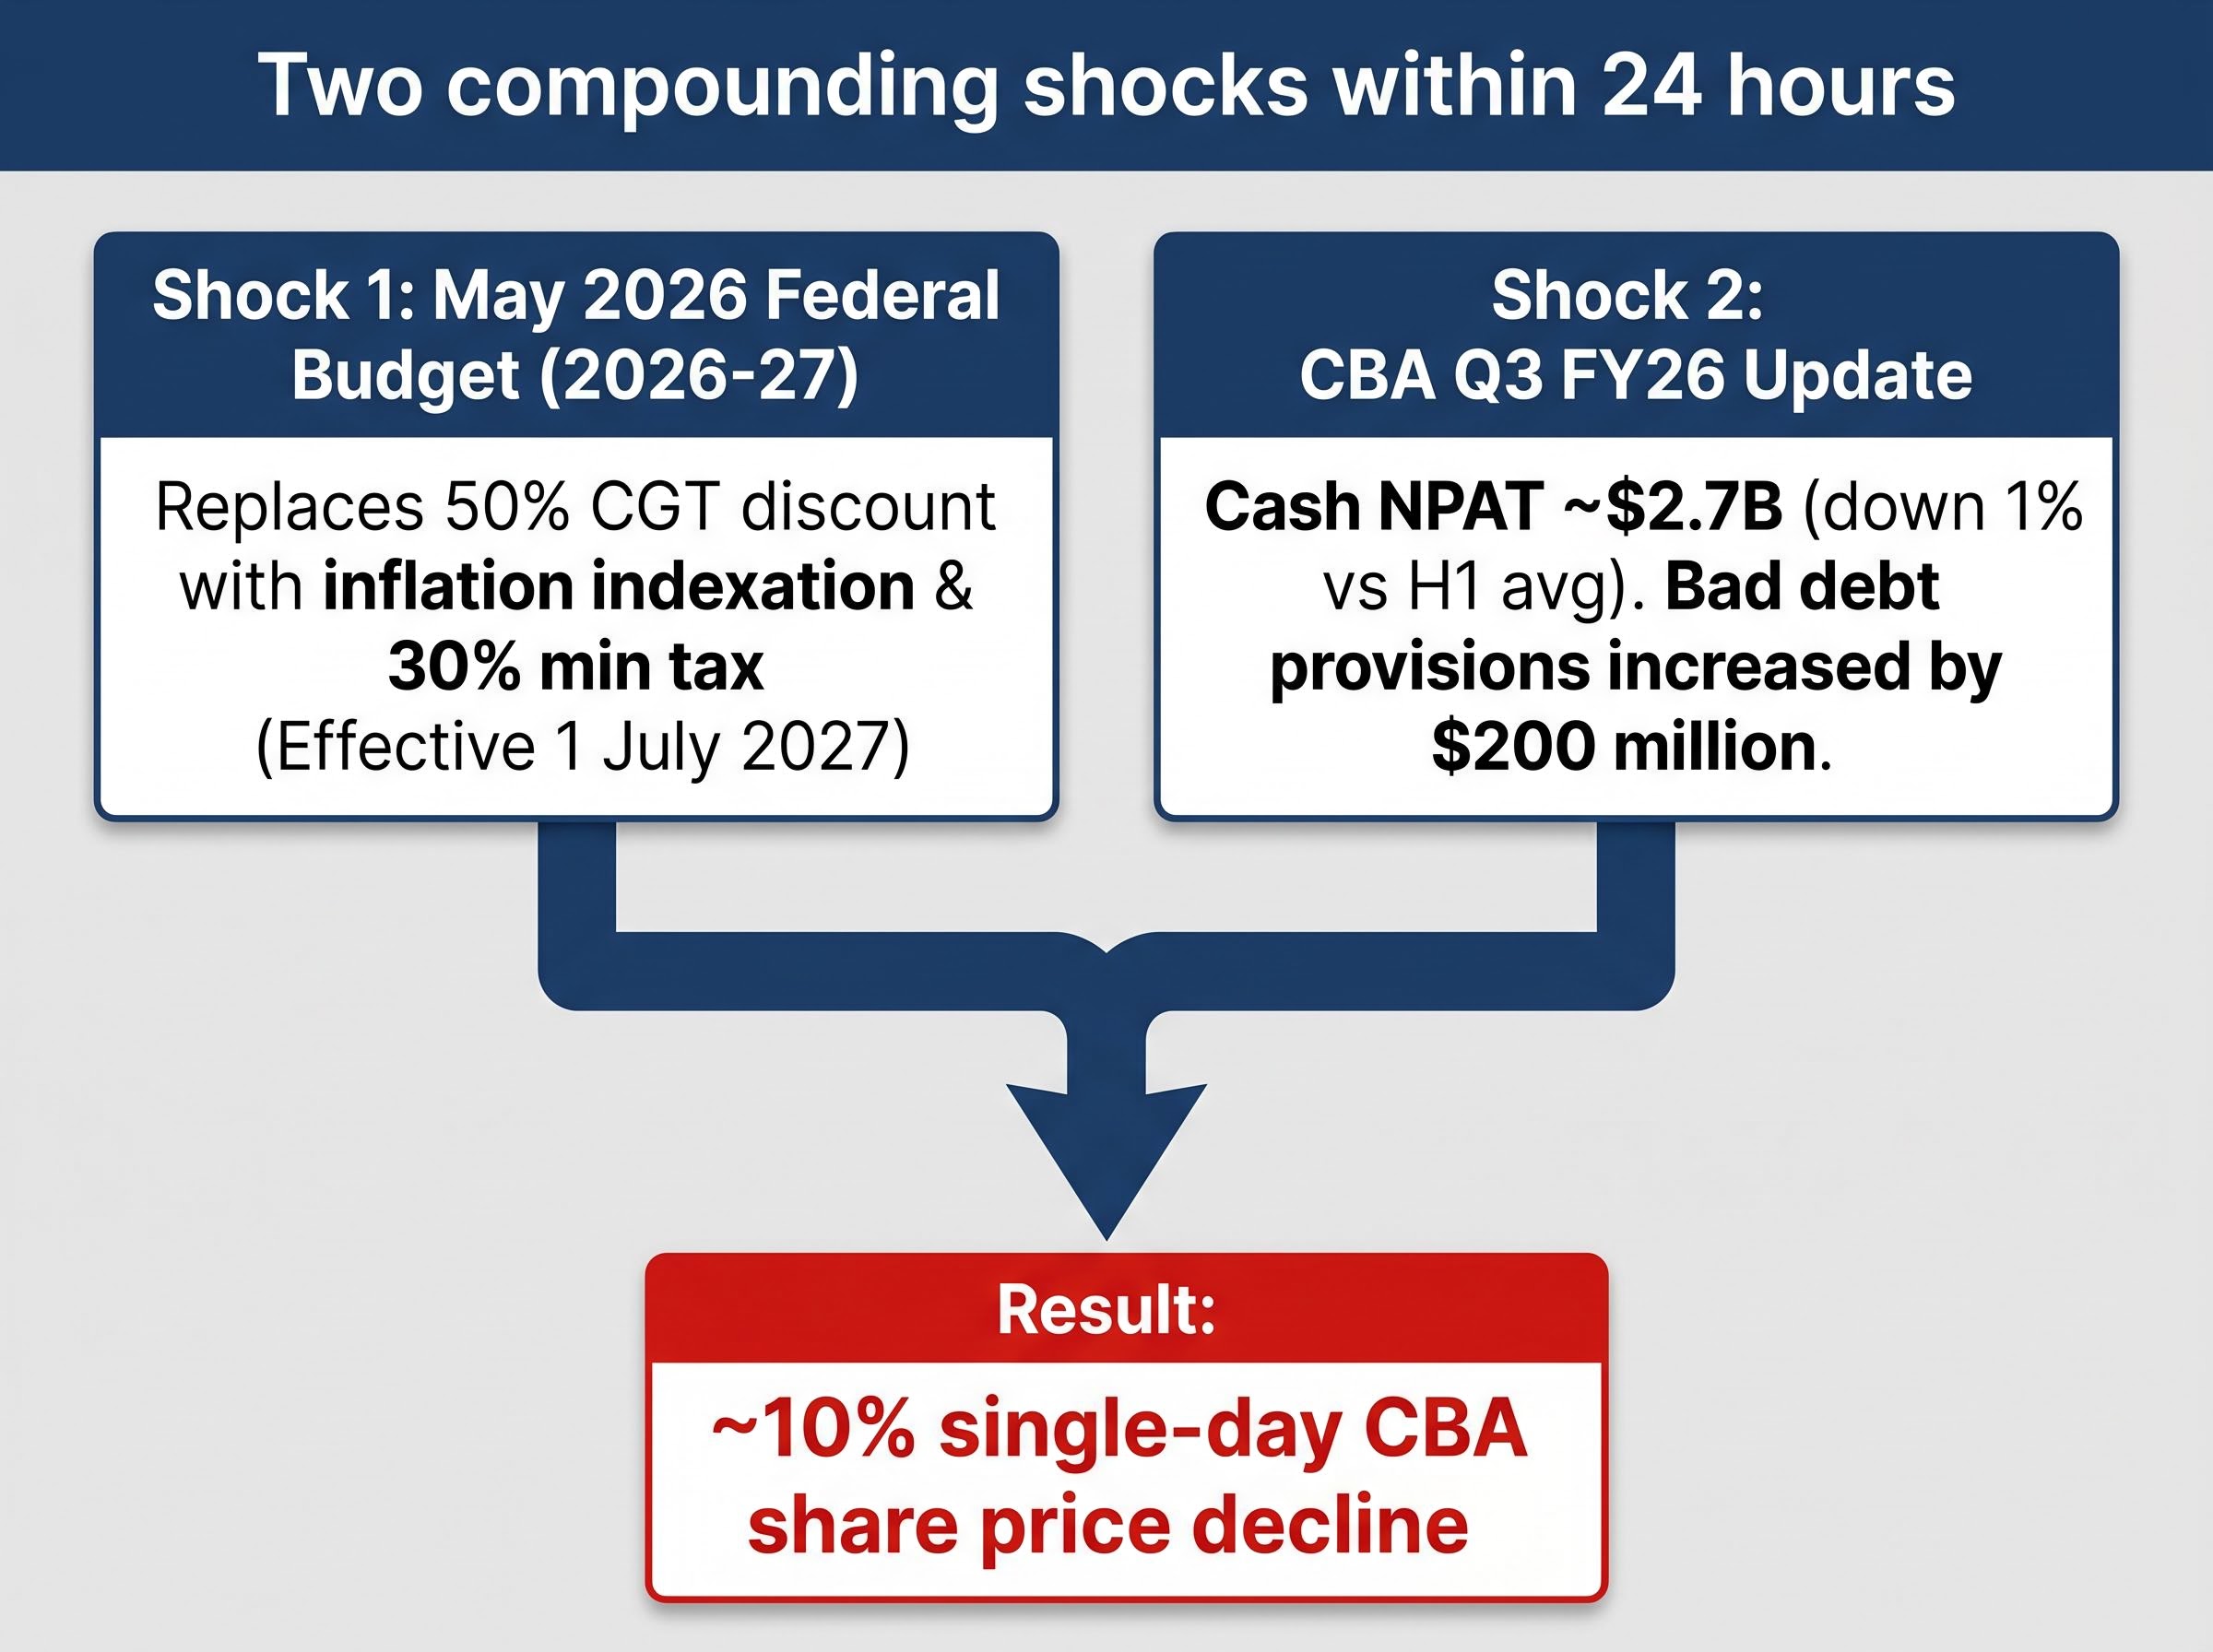
The result was an approximately 10% single-day share price decline, the largest in CBA’s listed history. Two shocks, one after the other, each making the other feel worse.
The CBA result did not land in a vacuum. It landed at the end of a rate-hiking sequence that had been tightening financial conditions for months.
The Reserve Bank of Australia (RBA) raised the cash rate to 4.35% at its 5-6 May 2026 board meeting, voting 8-1 in favour. That was the third rate hike of 2026, following a move to 4.10% in March 2026. The next scheduled board meeting is 16 June 2026.
The global central bank divergence visible at the May 2026 decision, with the Fed, ECB, and Bank of England all holding rates steady in the same week, has intensified the pressure on Australian borrowers by pushing the spread between Australian and US policy rates to more than 230 basis points, a gap that affects both capital flows and the RBA’s room to manoeuvre.
| Date | Decision | Resulting Cash Rate |
|---|---|---|
| Early 2026 | +25 basis points | 3.85% |
| March 2026 | +25 basis points | 4.10% |
| 5-6 May 2026 | +25 basis points (voted 8-1) | 4.35% |
Three consecutive hikes do not simply raise borrowing costs. They compound them. Each increase reprices variable-rate mortgages and business loans, squeezing serviceability further along a loan book that was already adjusting to the prior move. The cumulative effect on household cash flow and business margins is materially different from a single adjustment.
The April 2026 labour market data from the Australian Bureau of Statistics confirmed what rate-sensitive sectors had been signalling: unemployment rose to 4.5%, with a net loss of 18,600 jobs. This was the first clear deterioration signal, landing as a leading indicator rather than a lagging one for bank earnings.
Rising unemployment translates into mortgage arrears and business loan stress with a typical lag of 6-12 months. Consumer sentiment, already at multi-year lows driven by fuel and borrowing costs, compounds the picture. Lower confidence suppresses credit demand and increases repayment strain simultaneously. Against this backdrop, CBA’s quarterly result looked less like a one-off miss and more like the first print in a deteriorating cycle.
The consumer confidence collapse that preceded CBA’s quarterly result, with the Westpac-Melbourne Institute index dropping to 80.1 in April 2026, its weakest reading in years, reflects the cumulative weight of three rate hikes, near-tripling diesel prices, and a household sector already carrying debt at approximately 186% of disposable income.
Banks initially benefit from rising rates. Lending rates reprice faster than deposit rates, expanding the net interest margin, which is the spread between what a bank earns on loans and what it pays on deposits. This is the revenue tailwind that drove bank share outperformance through much of the recent cycle.
The tailwind does not last. Three stages describe how a rate cycle moves from bank benefit to bank burden:
The Australian banking sector is now firmly in the transition between stages two and three. All four major banks carry significant residential mortgage exposure, and variable-rate borrowers face compounding increases with no relief horizon in sight.
Provisions as a forward signal: When a bank raises bad debt provisions, it is forward-dating expected losses. The stress is anticipated but not yet fully realised in actual write-offs. CBA’s $200 million provision increase is not a record of past damage; it is a statement about expected future damage.
This distinction matters for investors reading bank results. Provisions are the analytical signal, not a footnote.
The Strait of Hormuz disruption between February and April 2026 pushed Brent crude above US$100 per barrel at its peak, triggering supply concerns across global energy markets. By 26 May 2026, prices had eased to approximately US$97.72 per barrel, down roughly 12% over the prior week as markets priced in a potential reopening of the strait to commercial vessels.
The easing is welcome. It is not sufficient to reverse the damage already absorbed by Australian businesses.
Elevated fuel costs compound existing pressure on small and medium enterprises (SMEs) through a direct transmission mechanism:
Economists have flagged that the full economic consequences of the Strait of Hormuz supply disruption have not yet fully materialised. Further credit stress in business loan books remains a forward risk, not a past event.
For investors watching ASX bank shares, the oil shock is not a commodities story. It is a banking story. SME loan stress feeds directly into provision movements and, eventually, write-offs. The quarters ahead will reveal how much of this pressure has already been priced in and how much remains to surface.
The corporate insolvency surge that reached approximately 12,000 failures in 2025, the highest level since the 1990-91 recession, provides the upstream signal for what elevated fuel costs and sustained rate pressure tend to produce in business loan books: rising stress that surfaces in bank provisions quarters before it registers in headline unemployment figures.
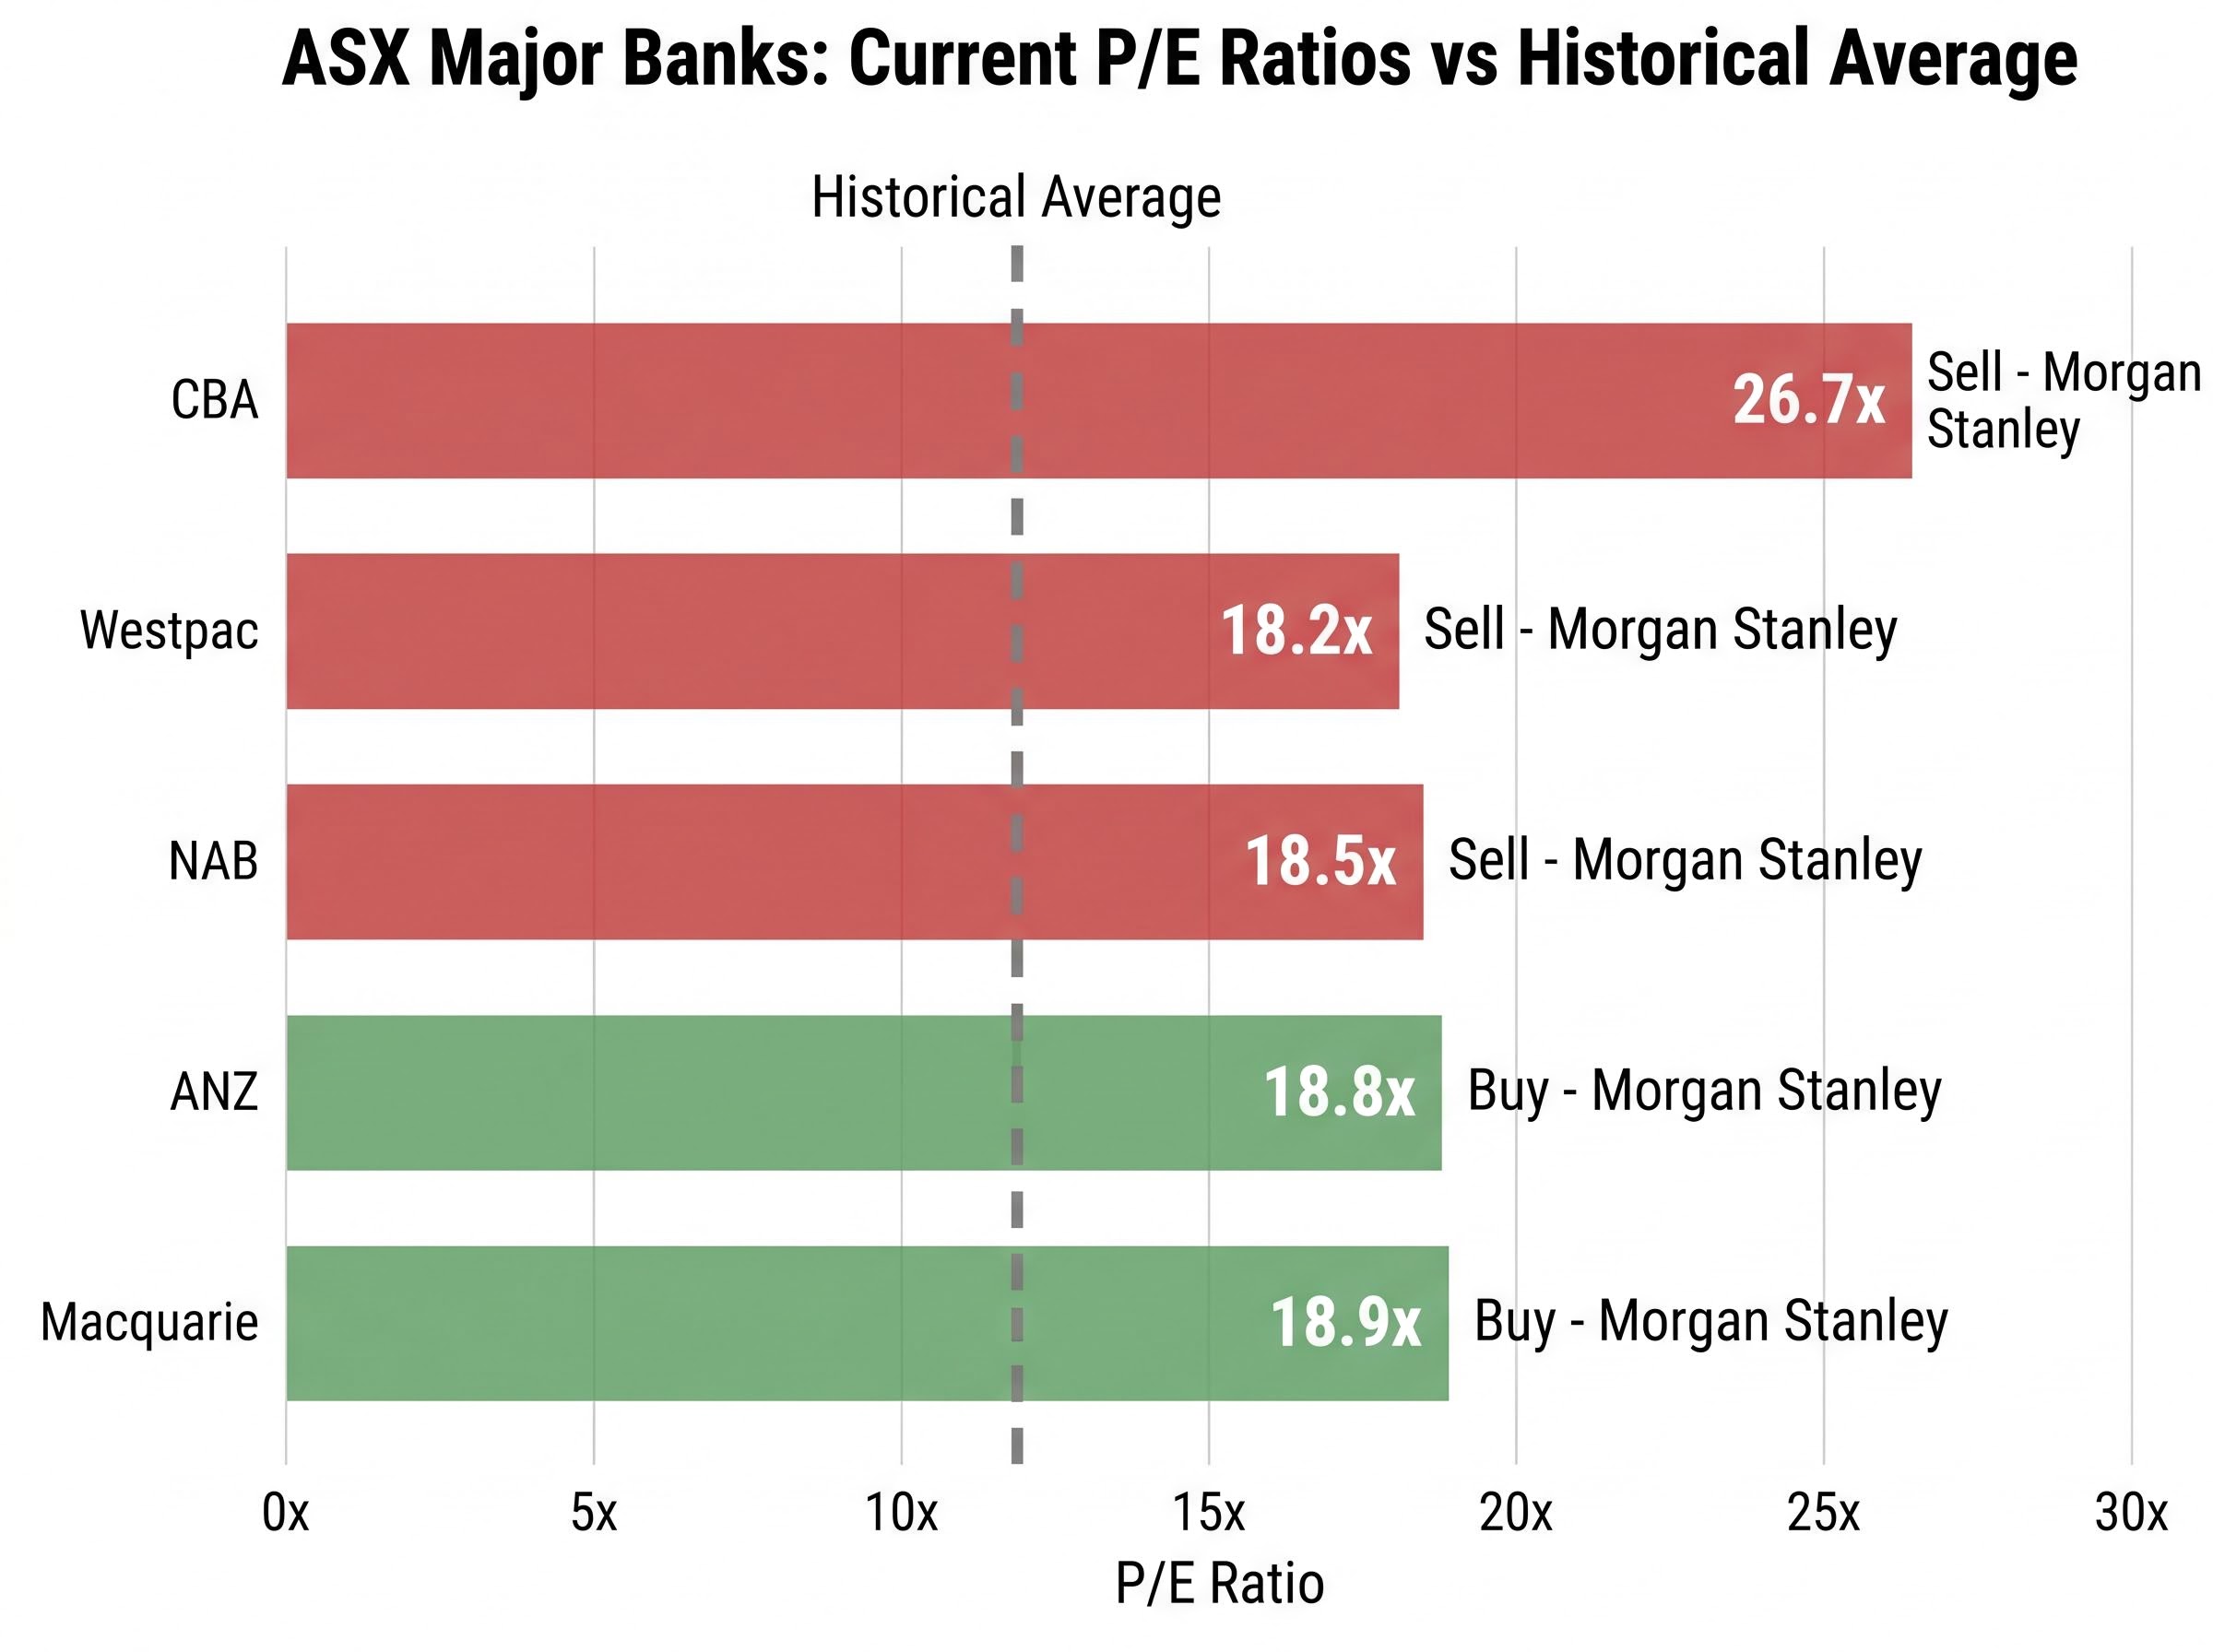
The four major banks currently trade at price-to-earnings (P/E) ratios of 18-19 times, compared with a long-run historical average of approximately 12 times. CBA sits at a pronounced premium, trading at 26.7 times earnings.
| Bank | Current P/E Ratio | Historical Average P/E | Morgan Stanley Recommendation |
|---|---|---|---|
| CBA | 26.7x | ~12x | Sell |
| Westpac | ~18-19x | ~12x | Sell |
| NAB | ~18-19x | ~12x | Sell |
| ANZ | ~18-19x | ~12x | Buy |
| Macquarie | ~18-19x | ~12x | Buy |
Morgan Stanley estimates an approximately 5% earnings downgrade for major ASX 200 banks in FY27, linked to CGT changes and weaker mortgage growth. The firm currently holds sell recommendations on CBA, Westpac, and NAB, while maintaining buy ratings on ANZ and Macquarie.
Suhas Nayak, portfolio manager at Allan Gray, has characterised current bank valuations as elevated, noting that total return prospects appear less compelling relative to other market segments.
The CGT reform replaces the 50% capital gains discount with inflation-based indexation and introduces a 30% minimum tax on net capital gains, effective 1 July 2027. The 1 July 2027 effective date creates a behavioural window. Investors who might otherwise have held bank shares through volatility may begin repositioning ahead of the rule change, particularly those sitting on substantial unrealised gains accumulated since November 2023.
The uncertainty itself, not just the actual tax impact, is sufficient to suppress multiple expansion and accelerate de-rating. When stretched P/E ratios meet a policy change that discourages long-duration holding, the conditions for mean reversion accumulate from multiple directions simultaneously.
All five major bank stocks have been on a sustained upward trend since November 2023, with each reaching record highs over that period. Share prices rising faster than earnings has mechanically compressed dividend yields, eroding the income investment case that has historically supported bank share valuations among retail and superannuation investors.
On 26 May 2026, all five major banks declined, underperforming a broader ASX 200 that itself fell 0.7%.
| Bank | Share Price (26 May 2026) | Daily Change | 52-Week Trend |
|---|---|---|---|
| CBA | $162.99 | -1.0% | Record high reached |
| NAB | $37.54 | -1.9% | Record high reached |
| ANZ | $35.37 | -1.1% | Record high reached |
| Westpac | $36.38 | -1.1% | Record high reached |
| Macquarie | $233.95 | -1.5% | Record high reached |
Investors holding major bank stocks at current levels face pressure on two fronts:
A stock can look like a reliable income holding based on historical dividend levels while delivering progressively less income relative to its current price. At stretched multiples and compressed yields, investors are getting less on both the growth and income fronts simultaneously.
CBA’s 10% single-day crash was the visible event, but the underlying pressures are sector-wide and structural. Three consecutive rate hikes have pushed the cash rate to 4.35%. Unemployment has risen to 4.5%. An oil supply shock has elevated business input costs across transport, logistics, and retail supply chains. CGT reform has introduced behavioural uncertainty for long-duration equity holders. And valuations sit at 50-120% premiums to their historical averages.
The RBA Board minutes from the May 2026 meeting confirm the 8-1 vote in favour of the increase, with the board citing persistent services inflation and a labour market that, at the time of the decision, had not yet shown the deterioration that April data would subsequently confirm.
In the near term, investors should watch the 16 June RBA meeting, further labour market data releases, oil price movements as the Strait of Hormuz situation evolves, and Morgan Stanley’s FY27 earnings revision cycle.
The question is no longer whether ASX bank shares face headwinds. It is whether current prices adequately reflect the scale and duration of those headwinds. For investors who bought into the rally since late 2023, the answer may prove uncomfortable.
Readers wanting to understand the structural risks that sit beyond the major banks’ published capital ratios will find our full explainer on Australian financial system blind spots, which examines how geopolitical instability and the US$2.3 trillion global private credit market transmit stress into Australian bank balance sheets through wholesale funding costs and superannuation fund offshore allocations, channels that domestic stress tests were not designed to fully capture.
This article is for informational purposes only and should not be considered financial advice. Investors should conduct their own research and consult with financial professionals before making investment decisions. Past performance does not guarantee future results. Financial projections are subject to market conditions and various risk factors.
CBA's record single-day decline was triggered by two shocks landing within 24 hours: the 2026-27 Federal Budget announcing sweeping CGT reforms, followed by CBA's Q3 FY26 trading update which revealed a 1% sequential profit decline and a $200 million increase in bad debt provisions.
A bad debt provision is an amount a bank sets aside in anticipation of future loan losses; it is a forward-looking signal of expected credit stress rather than a record of losses already realised, making it one of the most important indicators investors should monitor in bank earnings results.
Banks initially benefit from rate hikes as lending rates reprice faster than deposit rates, expanding net interest margins, but sustained high rates eventually trigger deposit competition that narrows margins and borrower stress that raises provisions and write-offs, shifting the dynamic from tailwind to headwind.
The four major Australian banks currently trade at price-to-earnings ratios of 18-19 times, compared to a long-run historical average of approximately 12 times, with CBA at a pronounced premium of 26.7 times earnings, representing a significant mean reversion risk if earnings disappoint.
Morgan Stanley estimates an approximately 5% earnings downgrade for major ASX 200 banks in FY27, linked to CGT reform and weaker mortgage growth, and currently holds sell recommendations on CBA, Westpac, and NAB while maintaining buy ratings on ANZ and Macquarie.