Is Woolworths’ Share Price Rally Ahead of Its Earnings?
10 mins ago


Australia’s major bank stocks have delivered one of the most sustained rallies in ASX history since November 2023, pushing share prices to record highs. On 26 May 2026, every one of the Big Five fell harder than the broader index, with Commonwealth Bank of Australia (CBA) having already shed approximately 10% in a single session earlier this month, the largest one-day decline in the company’s listed history. The contradiction is hard to ignore.
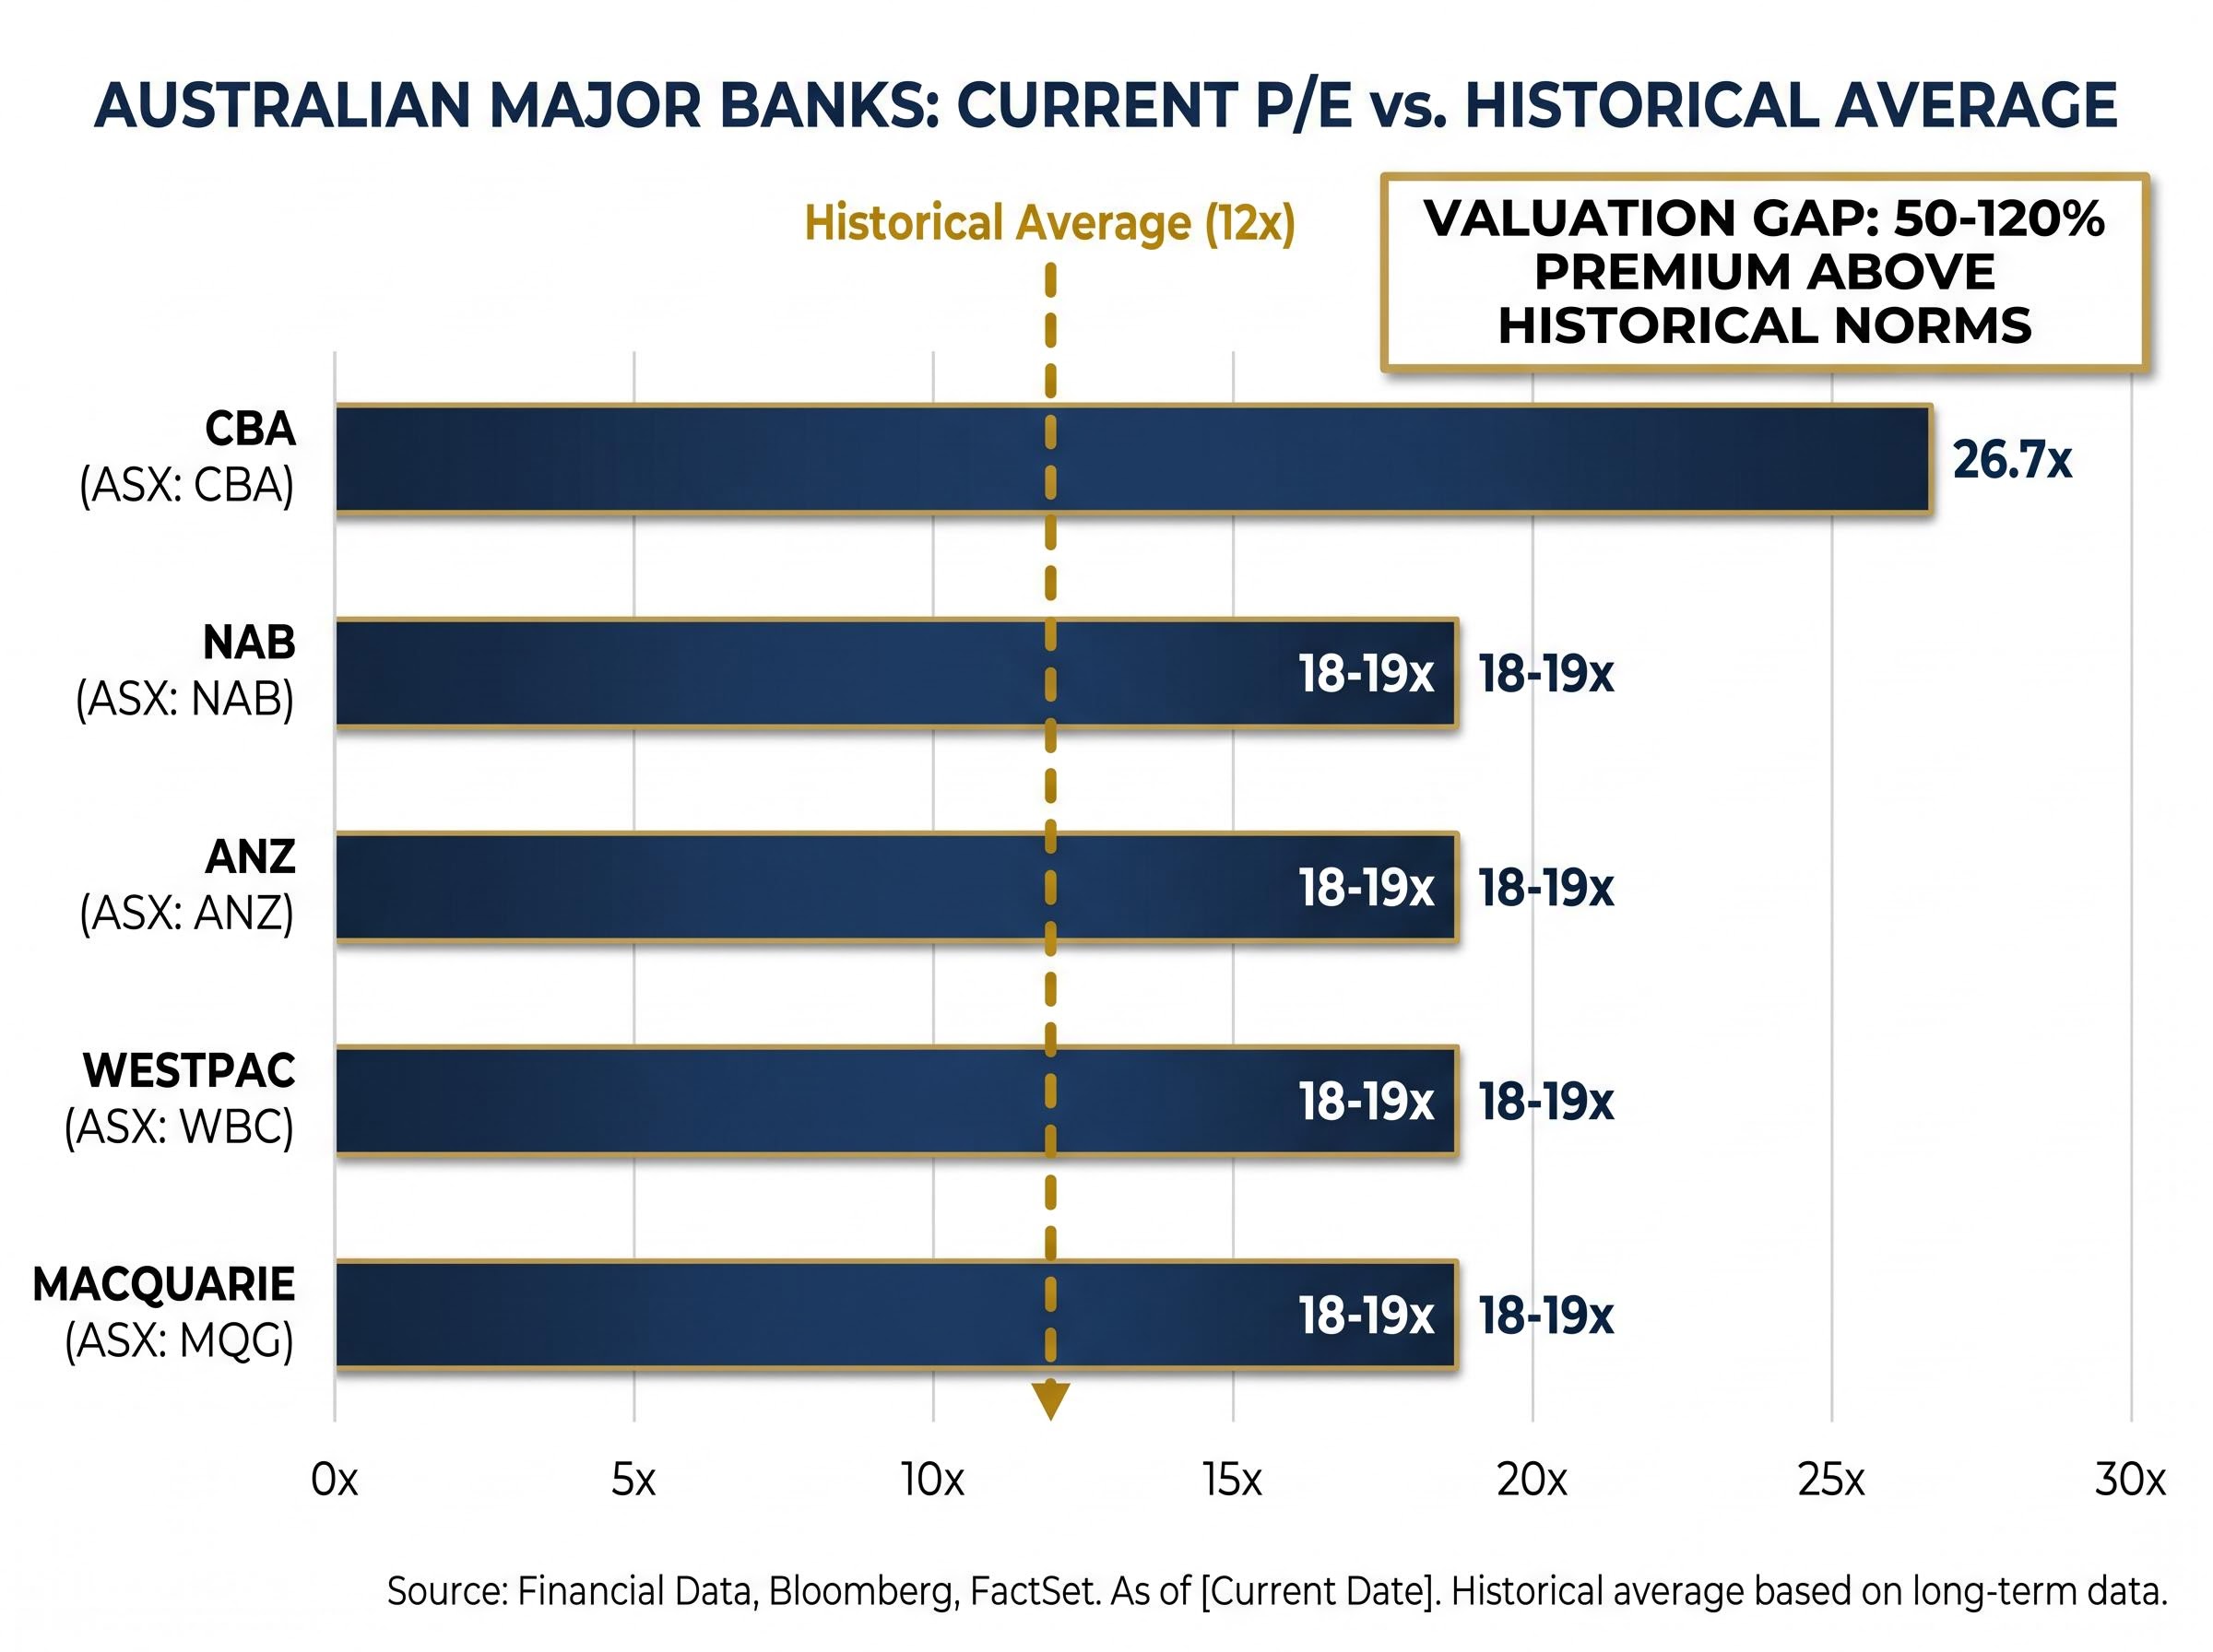
Share prices have run far ahead of earnings. Price-to-earnings (P/E) ratios across the sector sit at 18-19 times, against a long-run average of approximately 12 times. CBA trades at 26.7 times. Dividend yields have compressed in lockstep with the price inflation, and Morgan Stanley has quantified the forward risk: approximately 5% earnings downgrades for FY27, driven by proposed capital gains tax (CGT) changes and softening mortgage growth. What follows unpacks each of these warning signals in sequence, so investors holding bank shares can evaluate whether current prices represent a holding, trimming, or exit decision.
The rally has been remarkable by any historical standard. From November 2023 through early 2026, ASX bank shares climbed with a persistence that drew comparisons to the pre-GFC run. Retail investors piled in. Superannuation allocations tilted further toward the sector. The momentum felt self-reinforcing.
Then 26 May 2026 offered a different signal. All five major banks fell more sharply than the ASX 200’s 0.7% decline on the day. CBA closed at $162.99, down 1%. NAB dropped 1.9% to $37.54. ANZ slid 1.1% to $35.37. Westpac lost 1.1% to $36.38. Macquarie fell 1.5% to $233.95.
The day’s losses were modest in isolation. The valuation context is not.
| Bank | 26 May 2026 Price | Day’s Move | P/E Ratio | Long-Run Avg P/E |
|---|---|---|---|---|
| CBA | $162.99 | -1.0% | 26.7x | ~12x (CBA norm higher) |
| NAB | $37.54 | -1.9% | ~18-19x | ~12x |
| ANZ | $35.37 | -1.1% | ~18-19x | ~12x |
| Westpac | $36.38 | -1.1% | ~18-19x | ~12x |
| Macquarie | $233.95 | -1.5% | ~18-19x | ~12x |
The valuation gap: Four of the five major ASX bank stocks trade at P/E ratios of 18-19 times, against a long-run historical average of approximately 12 times. CBA sits at 26.7 times. Investors are being asked to accept a premium of 50-120% above historical norms.
A P/E premium of that magnitude is not a rounding error. It is the central risk parameter for anyone holding these shares.
A P/E ratio measures how much investors pay for each dollar of a company’s earnings. A ratio of 12 times means the share price equals twelve years’ worth of current annual earnings. A ratio of 19 times means investors are paying nearly 60% more for the same dollar of profit. At 26.7 times, CBA shareholders are paying more than double the historical rate.
The gap between current multiples and the long-run average is not merely a premium. It introduces directional risk. P/E ratios compress through one of three mechanisms:
For the sector to sustain current multiples, earnings growth would need to accelerate materially. The evidence examined in the sections that follow suggests the opposite trajectory.
Allan Gray portfolio manager Suhas Nayak has characterised current ASX major bank valuations as elevated, noting that total return prospects appear less compelling than other market segments. CBA, Nayak observed, trades at a notably higher multiple than the other four.
The distinction matters. The banks remain profitable, well-capitalised institutions. The question confronting investors is not whether these are sound businesses, but whether the current share price has already priced in more optimism than the earnings trajectory can deliver. A reversion toward the 12 times historical average, assuming static earnings, would imply material share price reductions across the sector, and a sharper correction for CBA.
The divergence between CBA’s 26.7 times multiple and the sector’s long-run average of 12 times becomes sharper when examined through formal bank stock valuation methods: the Dividend Discount Model adjusted for franking credits, for instance, produces a sector-adjusted fair value estimate for CBA that sits materially below its current share price across a range of reasonable growth and discount rate assumptions.
For decades, Australian retail investors have held bank shares for one reason above all others: dividends. The income case was straightforward. Buy the banks, collect a reliable yield, reinvest or spend the income. That thesis is under strain.
Dividend yields have compressed because share prices have risen faster than earnings, and therefore faster than dividends. Even if the absolute dollar amount of a bank’s dividend holds steady, the yield percentage falls as the share price climbs. An investor buying CBA at $162.99 receives a materially lower yield than one who bought at $100.
According to Allan Gray’s Suhas Nayak, forward total return expectations from major bank stocks appear less compelling relative to other market segments, encompassing both capital appreciation and income dimensions.
Three factors are squeezing the income case simultaneously:
Income investors who entered the sector during the rally may find their yield assumptions no longer hold at current prices.
The income compression is most visible when dividends are evaluated on a grossed-up dividend yield basis: CBA’s cash yield of below 3% at current prices grosses up to approximately 4% once franking credits are factored in, a figure that must then be compared against term deposit rates that now exceed 5% for many investors following three consecutive rate rises in 2026.
Morgan Stanley estimates approximately 5% earnings downgrades for major ASX 200 bank stocks in FY27, driven by proposed CGT changes and weaker mortgage growth.
The projection is not built on a single variable. Two structural pressures converge.
First, proposed capital gains tax changes threaten to reduce property market transaction volumes. Lower turnover in housing markets feeds directly into reduced mortgage origination, which compresses bank revenue from their largest lending book. Second, mortgage growth has already softened against the backdrop of three rate rises in 2026, constraining household borrowing capacity and dampening new lending volumes.
The Budget 2026-27 CGT and negative gearing reforms propose replacing the existing 50 per cent CGT discount and limiting negative gearing concessions to new builds from 1 July 2027, the legislative changes underpinning Morgan Stanley’s assumption that property transaction volumes will contract and mortgage origination will weaken through FY27.
CBA’s third-quarter FY26 results offered early corroboration. Cash net profit after tax came in at $2.7 billion, representing a 1% decline on the first-half FY26 quarterly average. The bank increased bad debt provisions by $200 million, attributing the uplift to geopolitical and economic uncertainty. The quarterly update, released the day after the Federal Budget, triggered CBA’s approximately 10% single-session decline earlier in May 2026.
Morgan Stanley’s ratings across the sector reflect differentiated conviction rather than a blanket call.
| Bank | Morgan Stanley Rating | Key Risk Factor |
|---|---|---|
| CBA | Sell | Extreme P/E premium; earnings decline |
| Westpac | Sell | Mortgage growth exposure; CGT sensitivity |
| NAB | Sell | Business lending quality risk |
| ANZ | Buy | Relative valuation discount |
| Macquarie | Buy | Diversified earnings base |
The sell/buy split provides a tactical map for investors weighing selective exposure rather than a wholesale sector exit.
Morgan Stanley is not alone in its bearish conviction: Morgans issued sector-wide sell ratings on all four major ASX banks simultaneously in April 2026, projecting implied total returns of up to negative 24% for CBA over 12 months and forecasting total Big Four provisions rising from approximately $2.4 billion in FY25 to $5.5 billion by FY27.
Bank earnings are a function of credit quality, and credit quality is a function of whether borrowers can service their debts. Each of the following macroeconomic data points bears directly on that question:
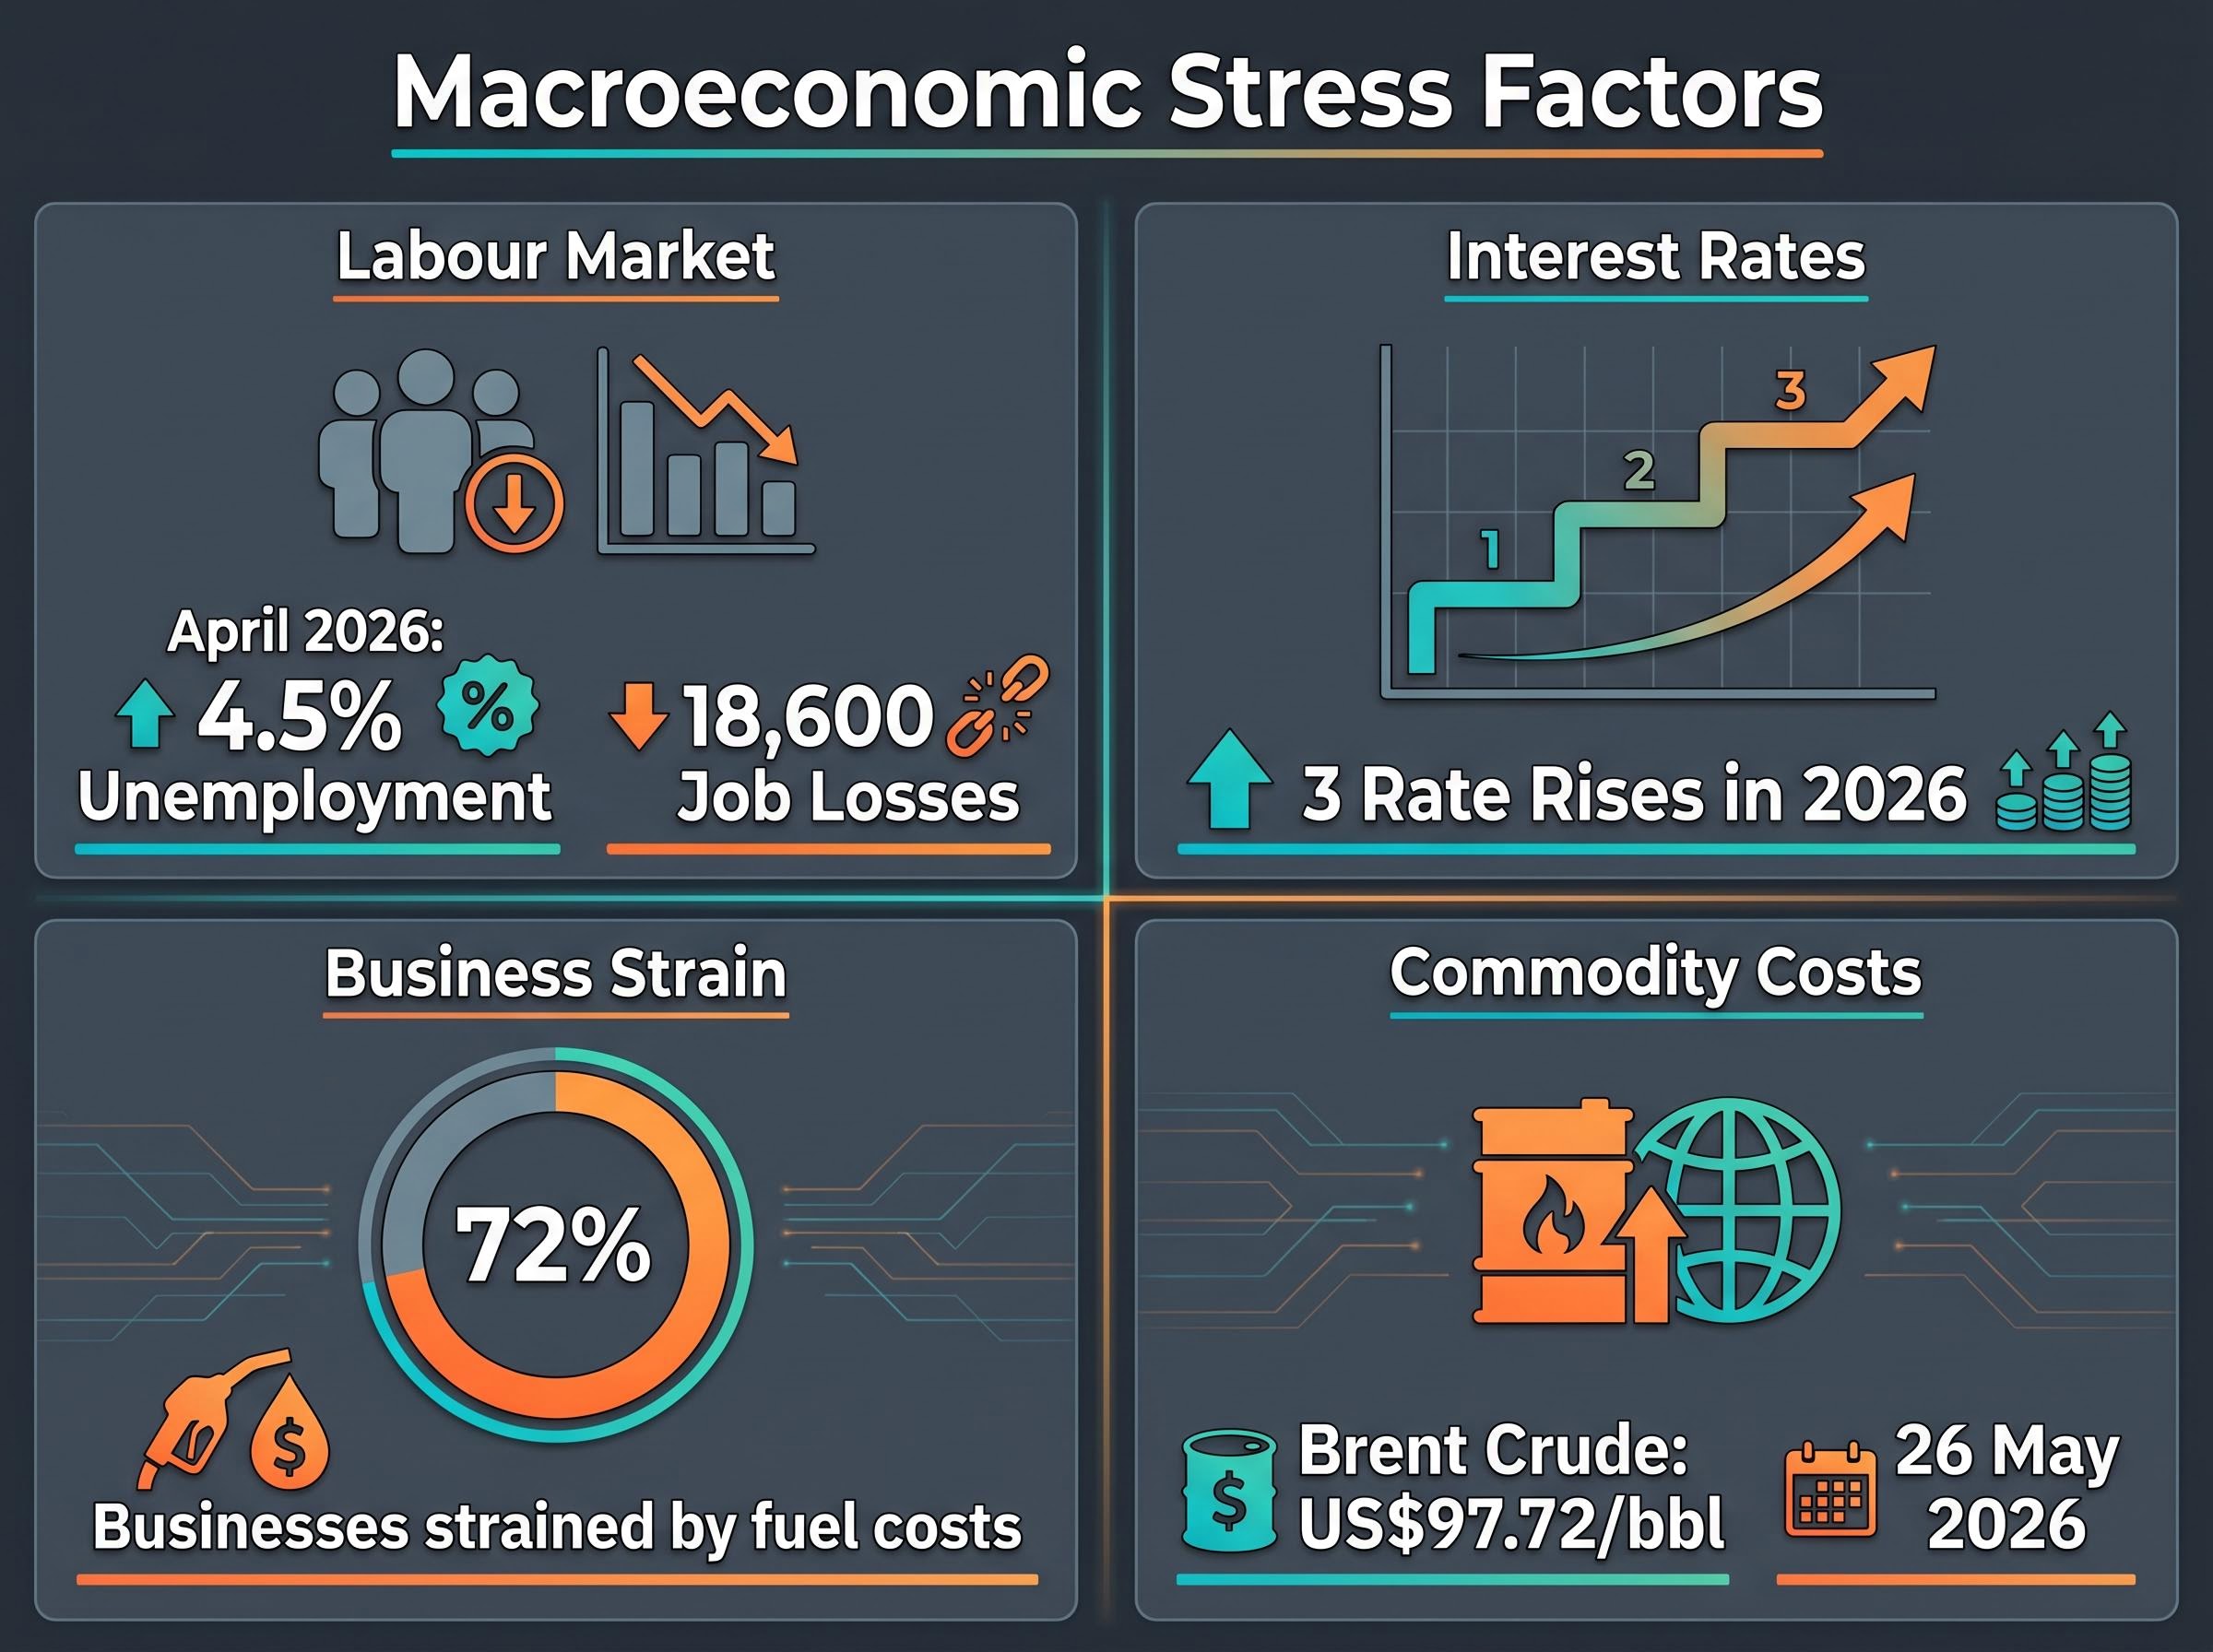
Consumer sentiment has fallen to multi-year lows. The cumulative weight of these pressures makes the benign earnings scenario increasingly difficult to sustain.
The translation from macroeconomic stress to bank balance sheets runs through a well-documented chain. Rising unemployment and cost pressures increase the proportion of borrowers falling behind on mortgage payments and business loan covenants. Banks respond by increasing provisions for expected losses.
CBA’s $200 million increase in bad debt provisions is precisely this mechanism at work. Provision increases are a leading indicator, not a lagging one. They reflect internal credit models pricing in deterioration that has not yet fully materialised in reported arrears, but which the bank’s risk management expects to emerge.
The preceding analysis identifies four distinct pressures: stretched valuations, compressed yields, a named broker’s earnings downgrade projection, and a deteriorating macroeconomic backdrop. No single factor in isolation constitutes a verdict. Together, they form a framework for investors to apply to their own circumstances.
Morgan Stanley’s differentiated ratings offer a starting point for selective positioning. Sell recommendations on CBA, Westpac, and NAB contrast with buy recommendations on ANZ and Macquarie, suggesting that wholesale sector exits may be less appropriate than targeted trimming.
Four leading indicators are worth monitoring in the months ahead:
CGT legislative progress remains a live variable: the proposed 30% minimum effective tax rate has not yet passed, opposition figures have signalled intent to repeal it, and investors who restructure portfolios or sell assets on the assumption the reform proceeds in its current form risk acting on a change that may never be enacted.
The APRA quarterly property exposure statistics track arrears as a proportion of total housing credit outstanding, providing the most direct available measure of whether the provision increases already flagged by CBA are beginning to manifest across the broader sector.
The decision framework for current holders maps against these signals:
This article is for informational purposes only and should not be considered financial advice. Investors should conduct their own research and consult with financial professionals before making investment decisions. Past performance does not guarantee future results. Financial projections are subject to market conditions and various risk factors.
The rally since November 2023 is not in dispute. The gains are real, and investors who participated have been rewarded. What has changed is the margin for error.
A P/E premium of 50-120% above historical norms, compressed dividend yields in a rising rate environment, a 5% earnings downgrade projection from Morgan Stanley, and a macroeconomic backdrop characterised by rising unemployment and household stress collectively reduce the buffer available to absorb negative surprises.
CBA at 26.7 times earnings, against a long-run norm of approximately 12 times, captures the scale of the gap between current prices and historical valuation anchors.
Two variables will likely resolve the uncertainty in either direction: the trajectory of the labour market, which governs credit quality, and the legislative outcome on CGT reform, which governs the earnings downgrade thesis. Both bear close watching in the quarters ahead.
A price-to-earnings (P/E) ratio measures how much investors pay for each dollar of a company's annual earnings; ASX major banks currently trade at 18-19 times earnings against a long-run historical average of approximately 12 times, meaning investors are paying a significant premium above historical norms.
CBA released its third-quarter FY26 results the day after the Federal Budget, reporting a 1% decline in cash net profit after tax on the first-half quarterly average and a $200 million increase in bad debt provisions attributed to geopolitical and economic uncertainty, triggering the largest one-day decline in the company's listed history.
Morgan Stanley projects approximately 5% earnings downgrades for major ASX 200 bank stocks in FY27, driven by proposed capital gains tax changes that could reduce property transaction volumes and softer mortgage growth following three interest rate rises in 2026.
Rising interest rates lift the return available from risk-free alternatives such as term deposits and government bonds, which now exceed 5% for many investors, narrowing the gap to bank dividend yields and reducing the relative income appeal of holding bank shares at current elevated prices.
Morgan Stanley rates CBA, Westpac, and NAB as sell, citing stretched valuations and earnings risk, while rating ANZ as a buy based on its relative valuation discount and Macquarie as a buy due to its diversified earnings base.