Bendigo and Adelaide Bank shares sit near A$10.40 in late May 2026, yet a dividend discount model built on the bank’s own declared A$0.63 fully franked dividend generates a central fair value estimate of A$13.32 to A$13.75. That gap, roughly 28% to 32%, is large enough to demand a closer look. With the RBA rate cycle shifting and mortgage competition compressing margins across the sector, BEN occupies an unusual position: its dividend is unchanged, its capital ratios remain within regulatory comfort zones, and yet the market continues to price it well below where income-focused valuation models suggest it should trade. What follows is a full DDM valuation of BEN using real declared dividend data, a scenario matrix across multiple discount rate and growth assumptions, and an explanation of how franking credits materially lift the gross estimate for Australian investors. The goal is not a single price target but a structured framework for deciding whether the current share price reflects genuine undervaluation or a discount the market has good reason to apply.
BEN’s fundamentals: what the numbers say before we value anything
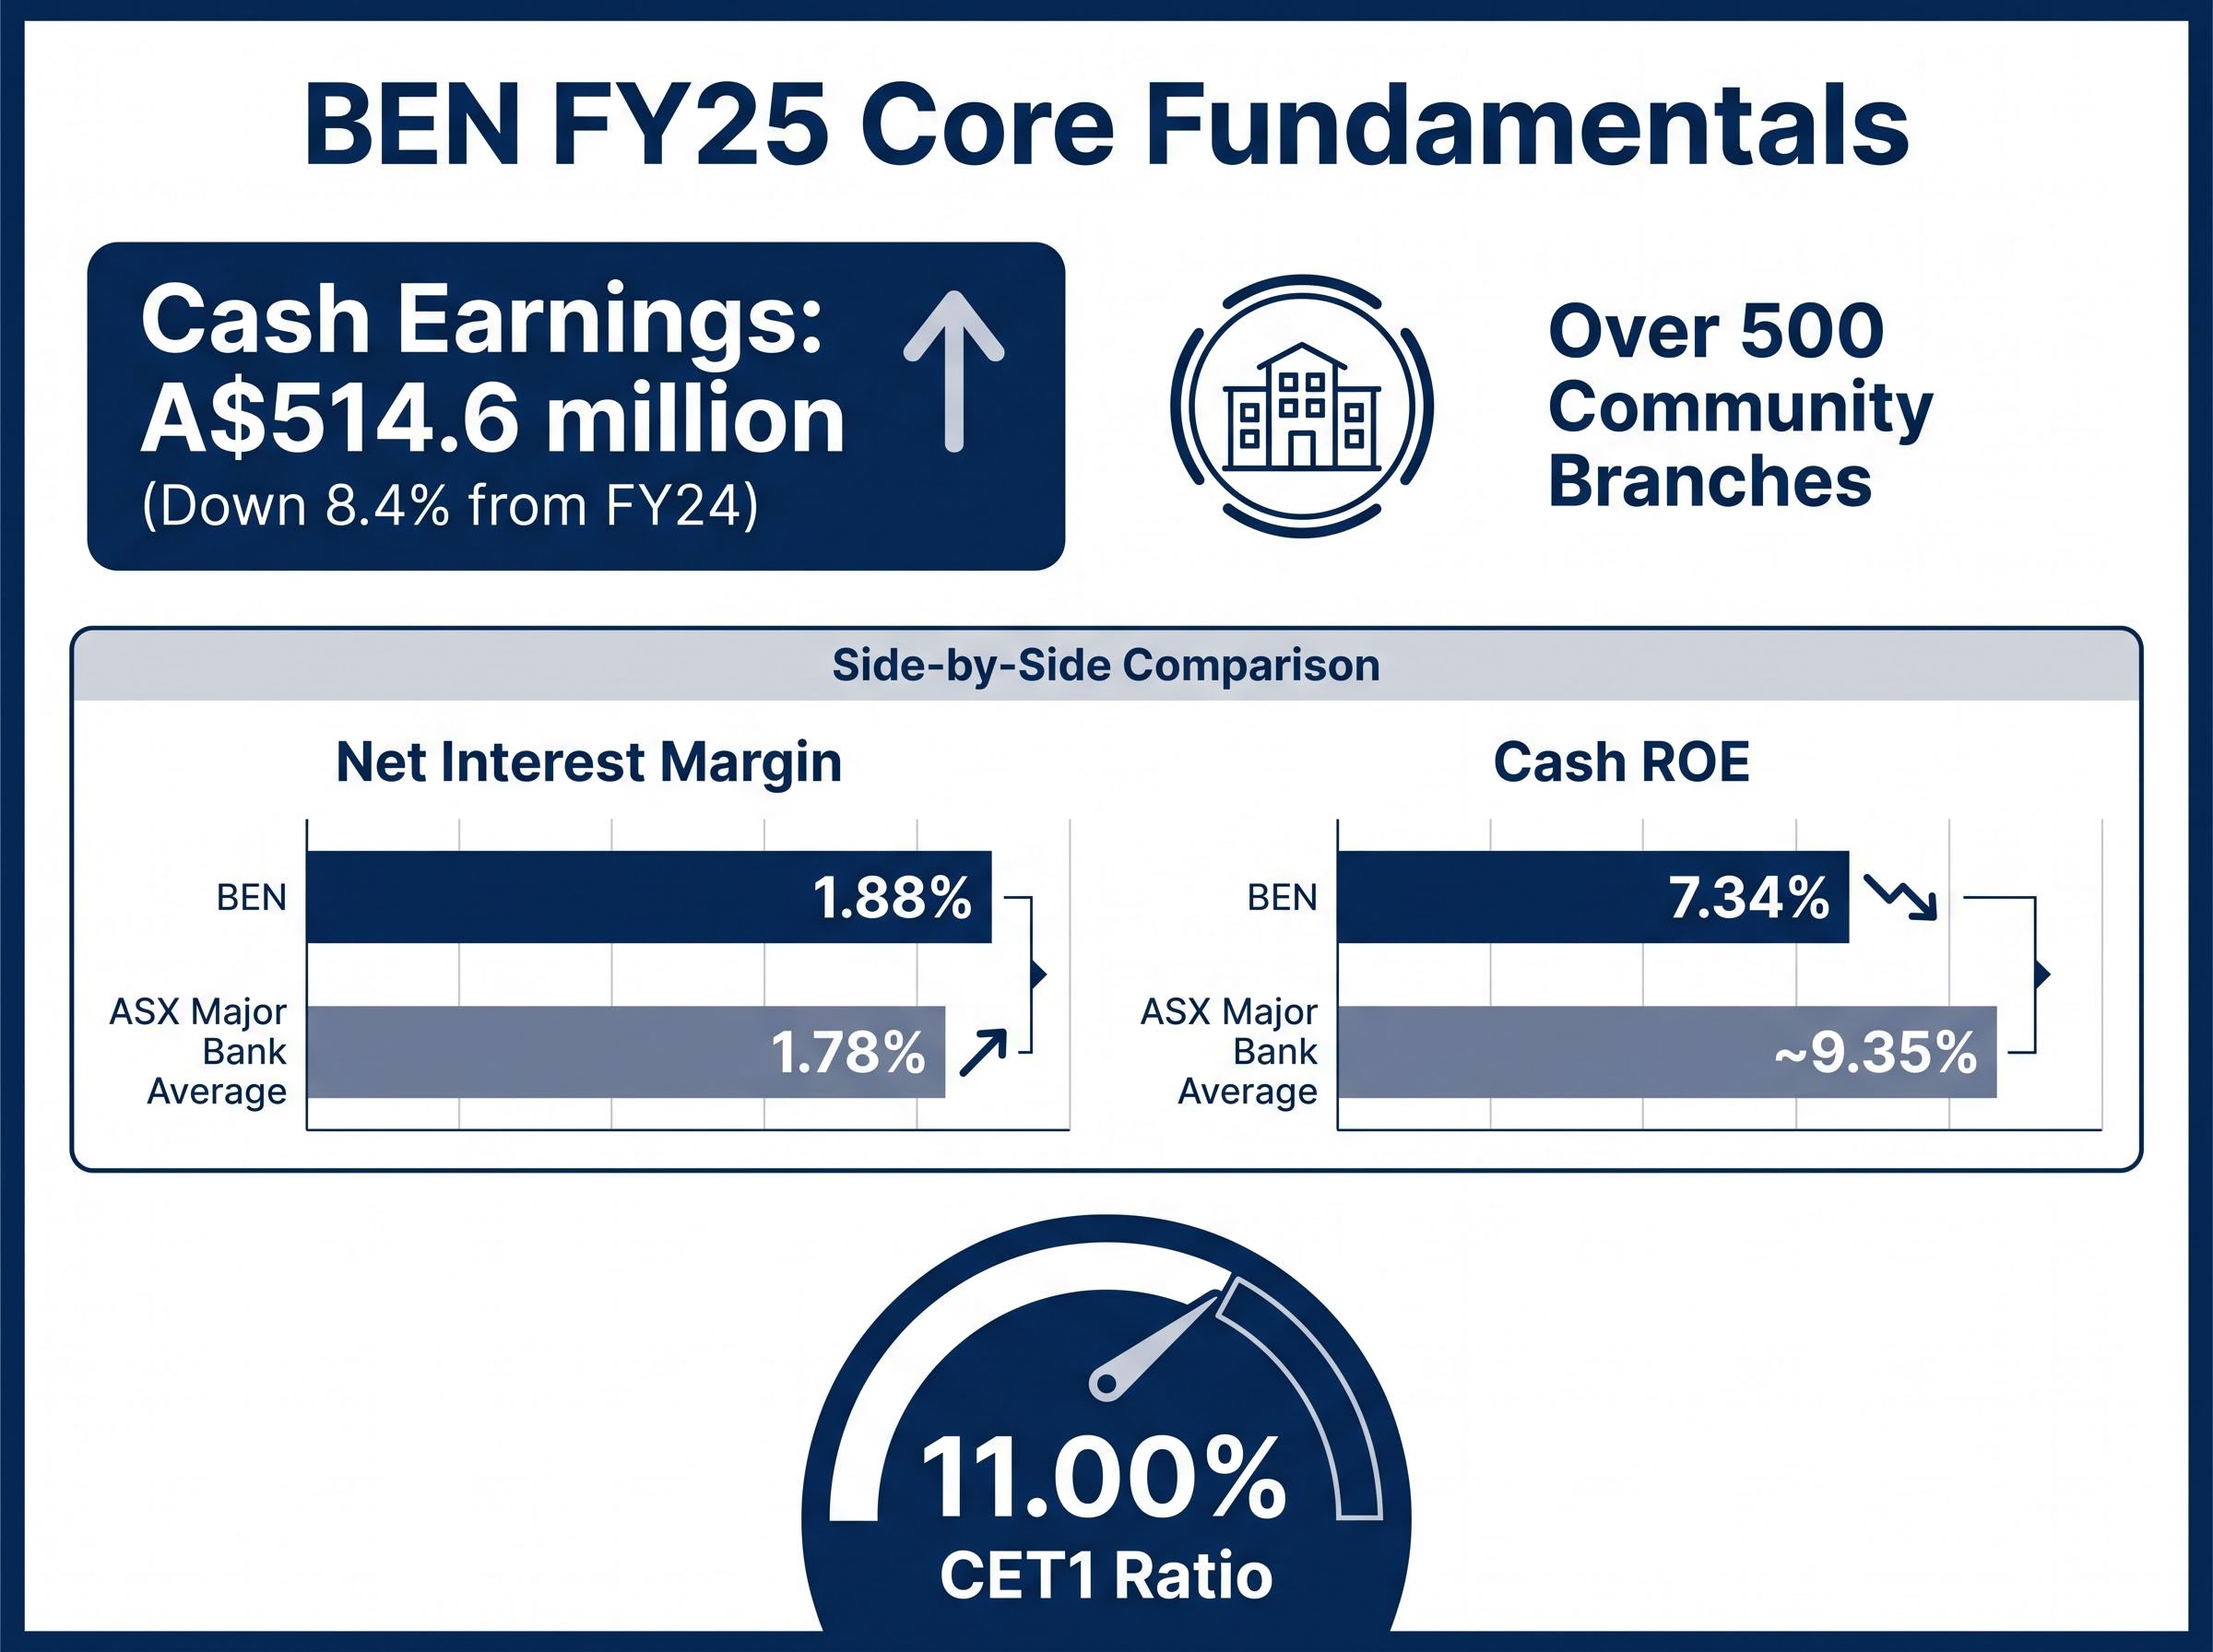
No valuation model means much without a clear picture of the business underneath. Bendigo and Adelaide Bank is a retail-focused lender with more than 500 community branches, formed through the merger of Bendigo Bank and Adelaide Bank in November 2007. A few facts frame the investment case before any model is applied:
- Lending income represents approximately 87% of total revenue
- The bank operates more than 500 community branches nationally
- FY25 cash earnings after tax came in at A$514.6 million, down 8.4% on FY24
The FY25 full-year results, released in August 2025, provide the most recent confirmed data across the three metrics that matter most for a DDM valuation: net interest margin, return on equity, and Common Equity Tier 1 capital ratio (the measure of a bank’s highest-quality capital relative to its risk-weighted assets).
| Metric | BEN (FY25) | ASX Major Bank Average |
|---|---|---|
| Net Interest Margin (NIM) | 1.88% | 1.78% |
| Cash Return on Equity (ROE) | 7.34% | ~9.35% |
| CET1 Ratio | 11.00% | Above 11% for most majors |
The NIM outperformance is a genuine positive, sitting 10 basis points above the major bank average. The ROE tells a different story: 7.34% in FY25, down from 8.18% in FY24, and nearly 200 basis points below the sector average. The CET1 ratio has also drifted lower, from 11.32% at the end of FY24 to 11.00% at the end of FY25, with no buyback or special dividend announced. BEN earns more per dollar of lending than most peers but converts that margin into shareholder returns less efficiently. That tension shapes everything that follows.
When big ASX news breaks, our subscribers know first
How the dividend discount model works, and why it suits bank stocks
The dividend discount model reduces a stock’s value to a single proposition: what is a stream of future dividends worth today? The formula is direct.
The dividend discount model was formalised by economist John Burr Williams in 1938 as a direct response to the speculative excess of the preceding decade, anchoring a stock’s value to the present worth of its future income stream rather than to market sentiment or price momentum.
DDM Fair Value = Full-Year Dividend ÷ (Risk Rate − Dividend Growth Rate)
The risk rate (also called the discount rate or required rate of return) represents what an investor demands for holding the stock instead of a risk-free asset. The dividend growth rate is the assumed annual rate at which dividends will increase over time. The fair value output rises as the growth assumption increases and falls as the risk rate increases. The critical sensitivity sits in the gap between the two: when that spread narrows, fair value estimates climb sharply; when it widens, they compress.
Using BEN’s confirmed FY25 full-year dividend of A$0.63 per share (fully franked), a risk rate of 7%, and a growth rate of 3%, the formula produces: $0.63 ÷ (0.07 − 0.03) = A$15.75. That single calculation already sits well above the current share price of approximately A$10.40, but a single assumption set is not a valuation. The scenario matrix in the following section tests the full range.
Why banks suit the DDM more than most companies
Banks are mature, capital-constrained businesses. Unlike growth-stage technology companies that reinvest the majority of earnings, banks distribute a high proportion of profits as dividends. BEN’s full-year dividend has held at A$0.63 per share, fully franked, across both FY24 and FY25. That consistency is precisely what the DDM is designed to value: a predictable, recurring cash return to shareholders. The Rask Invest methodology, which underpins the scenario analysis that follows, applies this framework directly to BEN’s declared dividend.
Running the numbers: BEN fair value across multiple assumptions
The strength of a DDM analysis lies not in a single output but in the range of estimates that different assumption combinations produce. The table below applies BEN’s confirmed A$0.63 dividend to risk rates from 6% to 11% and dividend growth rates from 2% to 4%.
| Risk Rate | 2% Growth | 3% Growth | 4% Growth |
|---|---|---|---|
| 6% | A$15.75 | A$21.00 | A$31.50 |
| 7% | A$12.60 | A$15.75 | A$21.00 |
| 8% | A$10.50 | A$12.60 | A$15.75 |
| 9% | A$9.00 | A$10.50 | A$12.60 |
| 10% | A$7.88 | A$9.00 | A$10.50 |
| 11% | A$7.00 | A$7.88 | A$9.00 |
At the most conservative credible assumptions (risk rate 9%, growth 2%), the model produces A$9.00, modestly below the current price. At moderate settings (7-8% risk rate, 3% growth), every output exceeds A$10.40 by a meaningful margin. Using a forecast dividend of A$0.65 rather than the confirmed A$0.63 pushes the upper estimates higher, producing the top end of the Rask Invest range at approximately A$13.75.
Rask Invest’s central DDM fair value range sits at A$13.32 to A$13.75, while the current BEN share price is approximately A$10.40. Morningstar’s fair value estimate falls in the low-to-mid teens per share. Broker consensus targets, by contrast, cluster around A$10.64 to A$10.82, with a full range of A$10.28 to A$11.54.
The divergence between value-model estimates and broker targets is itself a data point that warrants explanation. That comes in the risk section below.
The franking credit factor: why Australian investors see a higher gross value
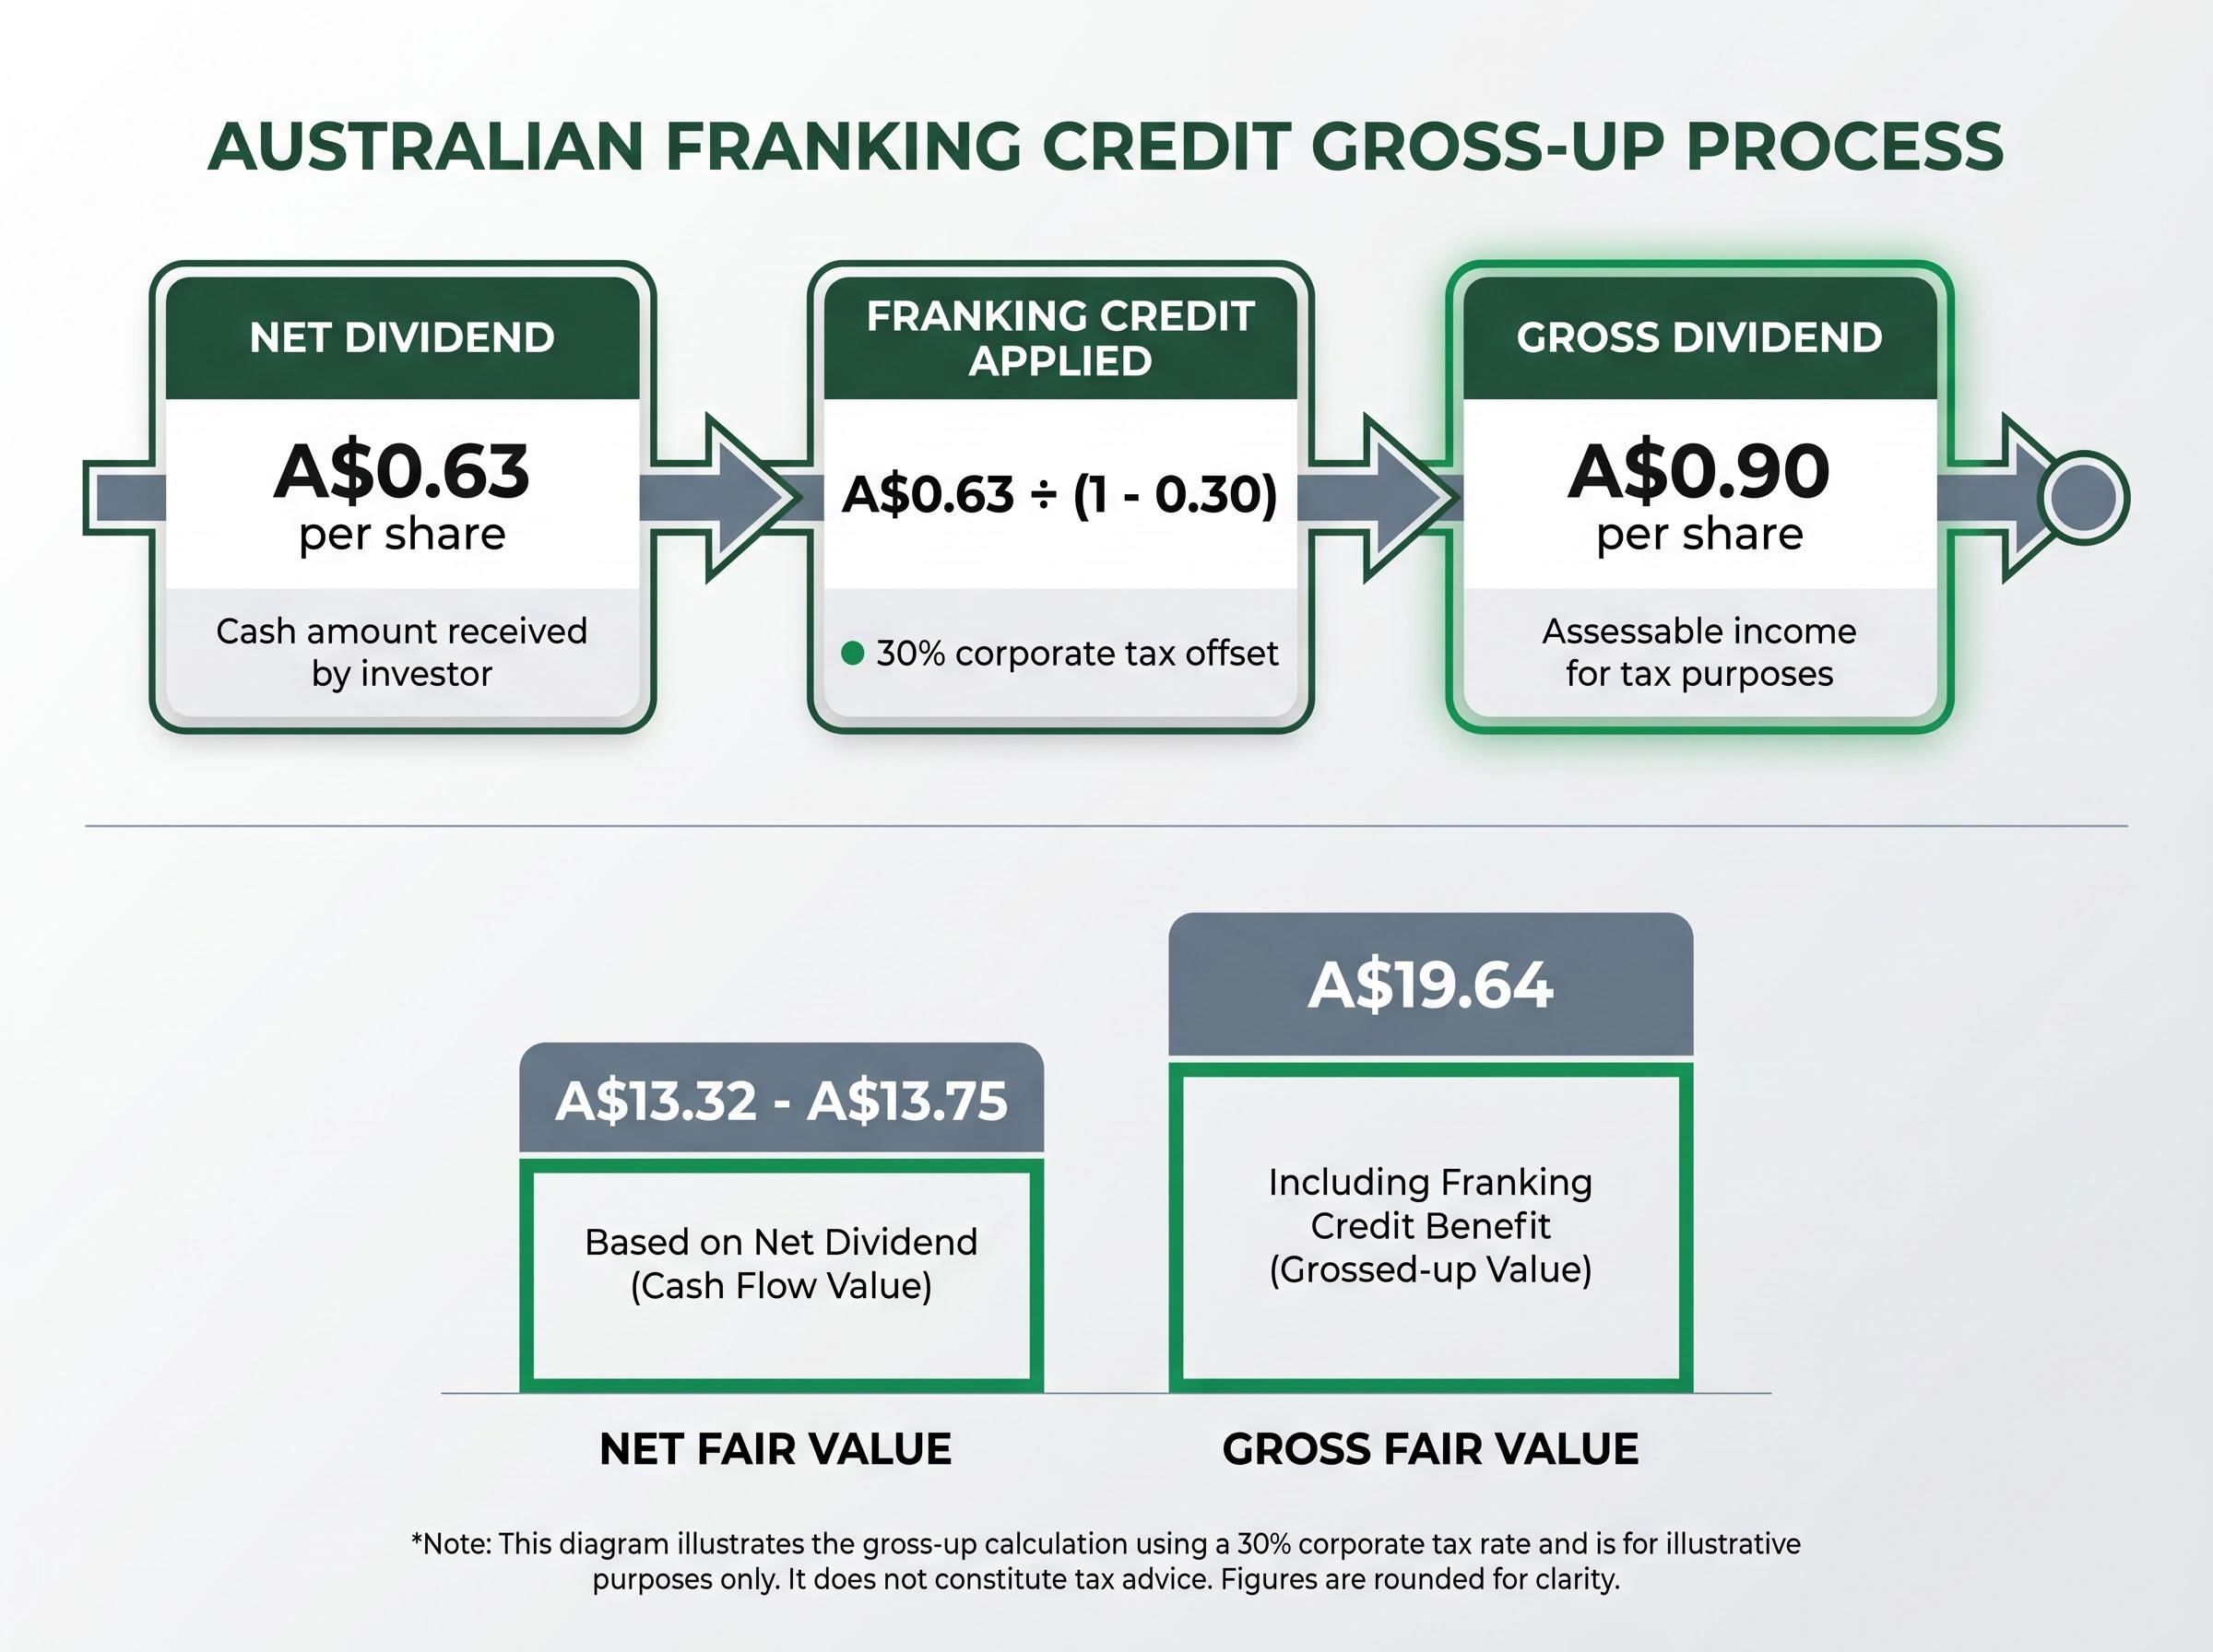
For Australian resident investors, the net dividend is not the full picture. BEN’s A$0.63 dividend is fully franked, meaning the company has already paid 30% corporate tax on the profits distributed. Shareholders receive a tax credit that offsets their personal tax liability, effectively lifting the pre-tax value of the dividend.
The gross-up calculation follows three steps:
- Start with the declared net dividend: A$0.63 per share
- Apply the grossing-up formula: A$0.63 ÷ (1 − 0.30) = A$0.90 per share
- The gross dividend, including the franking credit, is A$0.90 per share
Applying this A$0.90 gross dividend to the DDM formula produces a gross fair value estimate of approximately A$19.64 per share, according to Rask Invest’s analysis from May 2026. The gap between the net fair value range (A$13.32-A$13.75) and the gross fair value (A$19.64) illustrates how significantly franking credits can alter an income-focused valuation.
Who captures the franking credit value
The benefit flows unevenly across investor categories. Australian resident individuals in low-to-mid tax brackets receive franking credits that reduce their tax payable, sometimes generating a refund. Superannuation funds in accumulation phase pay a concessional 15% tax rate, making the credit particularly valuable. Those in pension phase can receive franking credit refunds under current tax law, effectively receiving income above the declared dividend amount.
For investors wanting to model the grossed-up DDM with internally consistent inputs, our dedicated guide to franking credits and the DDM explains why grossing up the dividend without also adjusting the discount rate will systematically overstate fair value, and walks through the correct paired adjustment using a major ASX bank as a worked example.
Foreign investors and non-residents generally cannot access franking credits. This is why DDM valuations aimed at a global investor base tend to use the net dividend figure. For Australian-domiciled portfolios, however, ignoring franking credits systematically understates the after-tax value of fully franked stocks like BEN.
Why the model’s gap to the share price is not the whole story
A 28-32% gap between a model’s output and the market price can signal undervaluation or, equally, signal that the model’s assumptions are too generous. Four structural risks explain why the market may be correct to price BEN below the DDM estimate:
- Declining ROE trajectory: Cash ROE fell from 8.18% in FY24 to 7.34% in FY25, against a sector average of approximately 9.35%. A bank earning below its cost of equity destroys value regardless of what its dividend model implies.
- NIM compression risk: Mortgage competition across the Australian banking sector is intensifying. BEN’s 1.88% NIM outperforms the major bank average today, but deposit repricing and competitive loan pricing could narrow that advantage.
- CET1 pressure limiting dividend growth: CET1 declined from 11.32% to 11.00% over FY24-FY25, with no buyback or special dividend announced. Management may prioritise capital accumulation over dividend increases, undermining the growth assumptions that support higher DDM outputs.
- Formula sensitivity: The DDM is acutely sensitive to the spread between the discount rate and growth rate. A 1 percentage point shift in either input can move the fair value estimate by 20-30%.
BEN’s cost reduction programme, which involves seven-year and six-year outsourcing partnerships with Infosys and Genpact respectively, targets A$65-75 million in annualised savings by FY28, though upfront transition costs of A$85-95 million concentrated in FY27 will likely worsen the cost-to-income ratio before improving it.
APRA’s APS 110 capital adequacy standard sets the minimum CET1 ratio at 4.5% for authorised deposit-taking institutions, with capital conservation buffers layered above that floor, meaning BEN’s 11.00% CET1 sits well above the regulatory minimum but the directional decline from 11.32% still warrants monitoring in the context of dividend sustainability.
Broker consensus targets of A$10.64 to A$10.82 sit roughly 23-28% below the DDM fair value range of A$13.32 to A$13.75. That gap reflects structural concerns, including lower ROE, competitive pressures, and capital constraints, that pure dividend-based models do not directly capture.
Historical precedent reinforces the caution. During the GFC and COVID, Australian bank dividends were cut or paused, a reminder that “reliable” bank dividends are not guaranteed. BEN’s workplace culture score of 2.9 out of 5.0, versus a sector average of 3.1 (Seek data, May 2026), also presents a softer long-term concern around talent retention and operational execution.
The most productive approach, as several analysts and financial commentators recommend, is to use the DDM as one input alongside price-to-book and ROE-based comparisons rather than as a standalone verdict on value.
Undervalued or fairly discounted? The verdict for BEN investors in May 2026
The DDM framework consistently points to a fair value materially above A$10.40. Across most credible assumption combinations, the model generates estimates in the A$12-A$16 range, with the Rask Invest central estimate at A$13.32 to A$13.75 and Morningstar in the low-to-mid teens. The arithmetic is clear.
The structural discount is equally clear. BEN’s declining ROE, compressing CET1, and competitive NIM pressures are real, and they partially justify the gap between model output and market price. Broker targets clustering near A$10.64 to A$10.82 reflect those concerns directly.
For income-focused Australian investors, BEN’s confirmed A$0.63 fully franked dividend remains the most tangible near-term case. The grossed-up yield is difficult to replicate elsewhere on the ASX at this price level. The practical next step is to cross-check the DDM scenario that best reflects personal risk and growth assumptions against a required rate of return and tax situation, and compare those results against price-to-book metrics before forming a position.
For readers wanting to apply a fuller analytical framework before forming a position, our comprehensive walkthrough of ASX bank valuation methods covers PE ratios, price-to-book analysis, DDM, and DCF alongside the qualitative factors that professional analysts weight heavily, including management track record, APRA capital compliance history, and loan book quality.
This article is for informational purposes only and should not be considered financial advice. Investors should conduct their own research and consult with financial professionals before making investment decisions. Past performance does not guarantee future results. Financial projections are subject to market conditions and various risk factors.