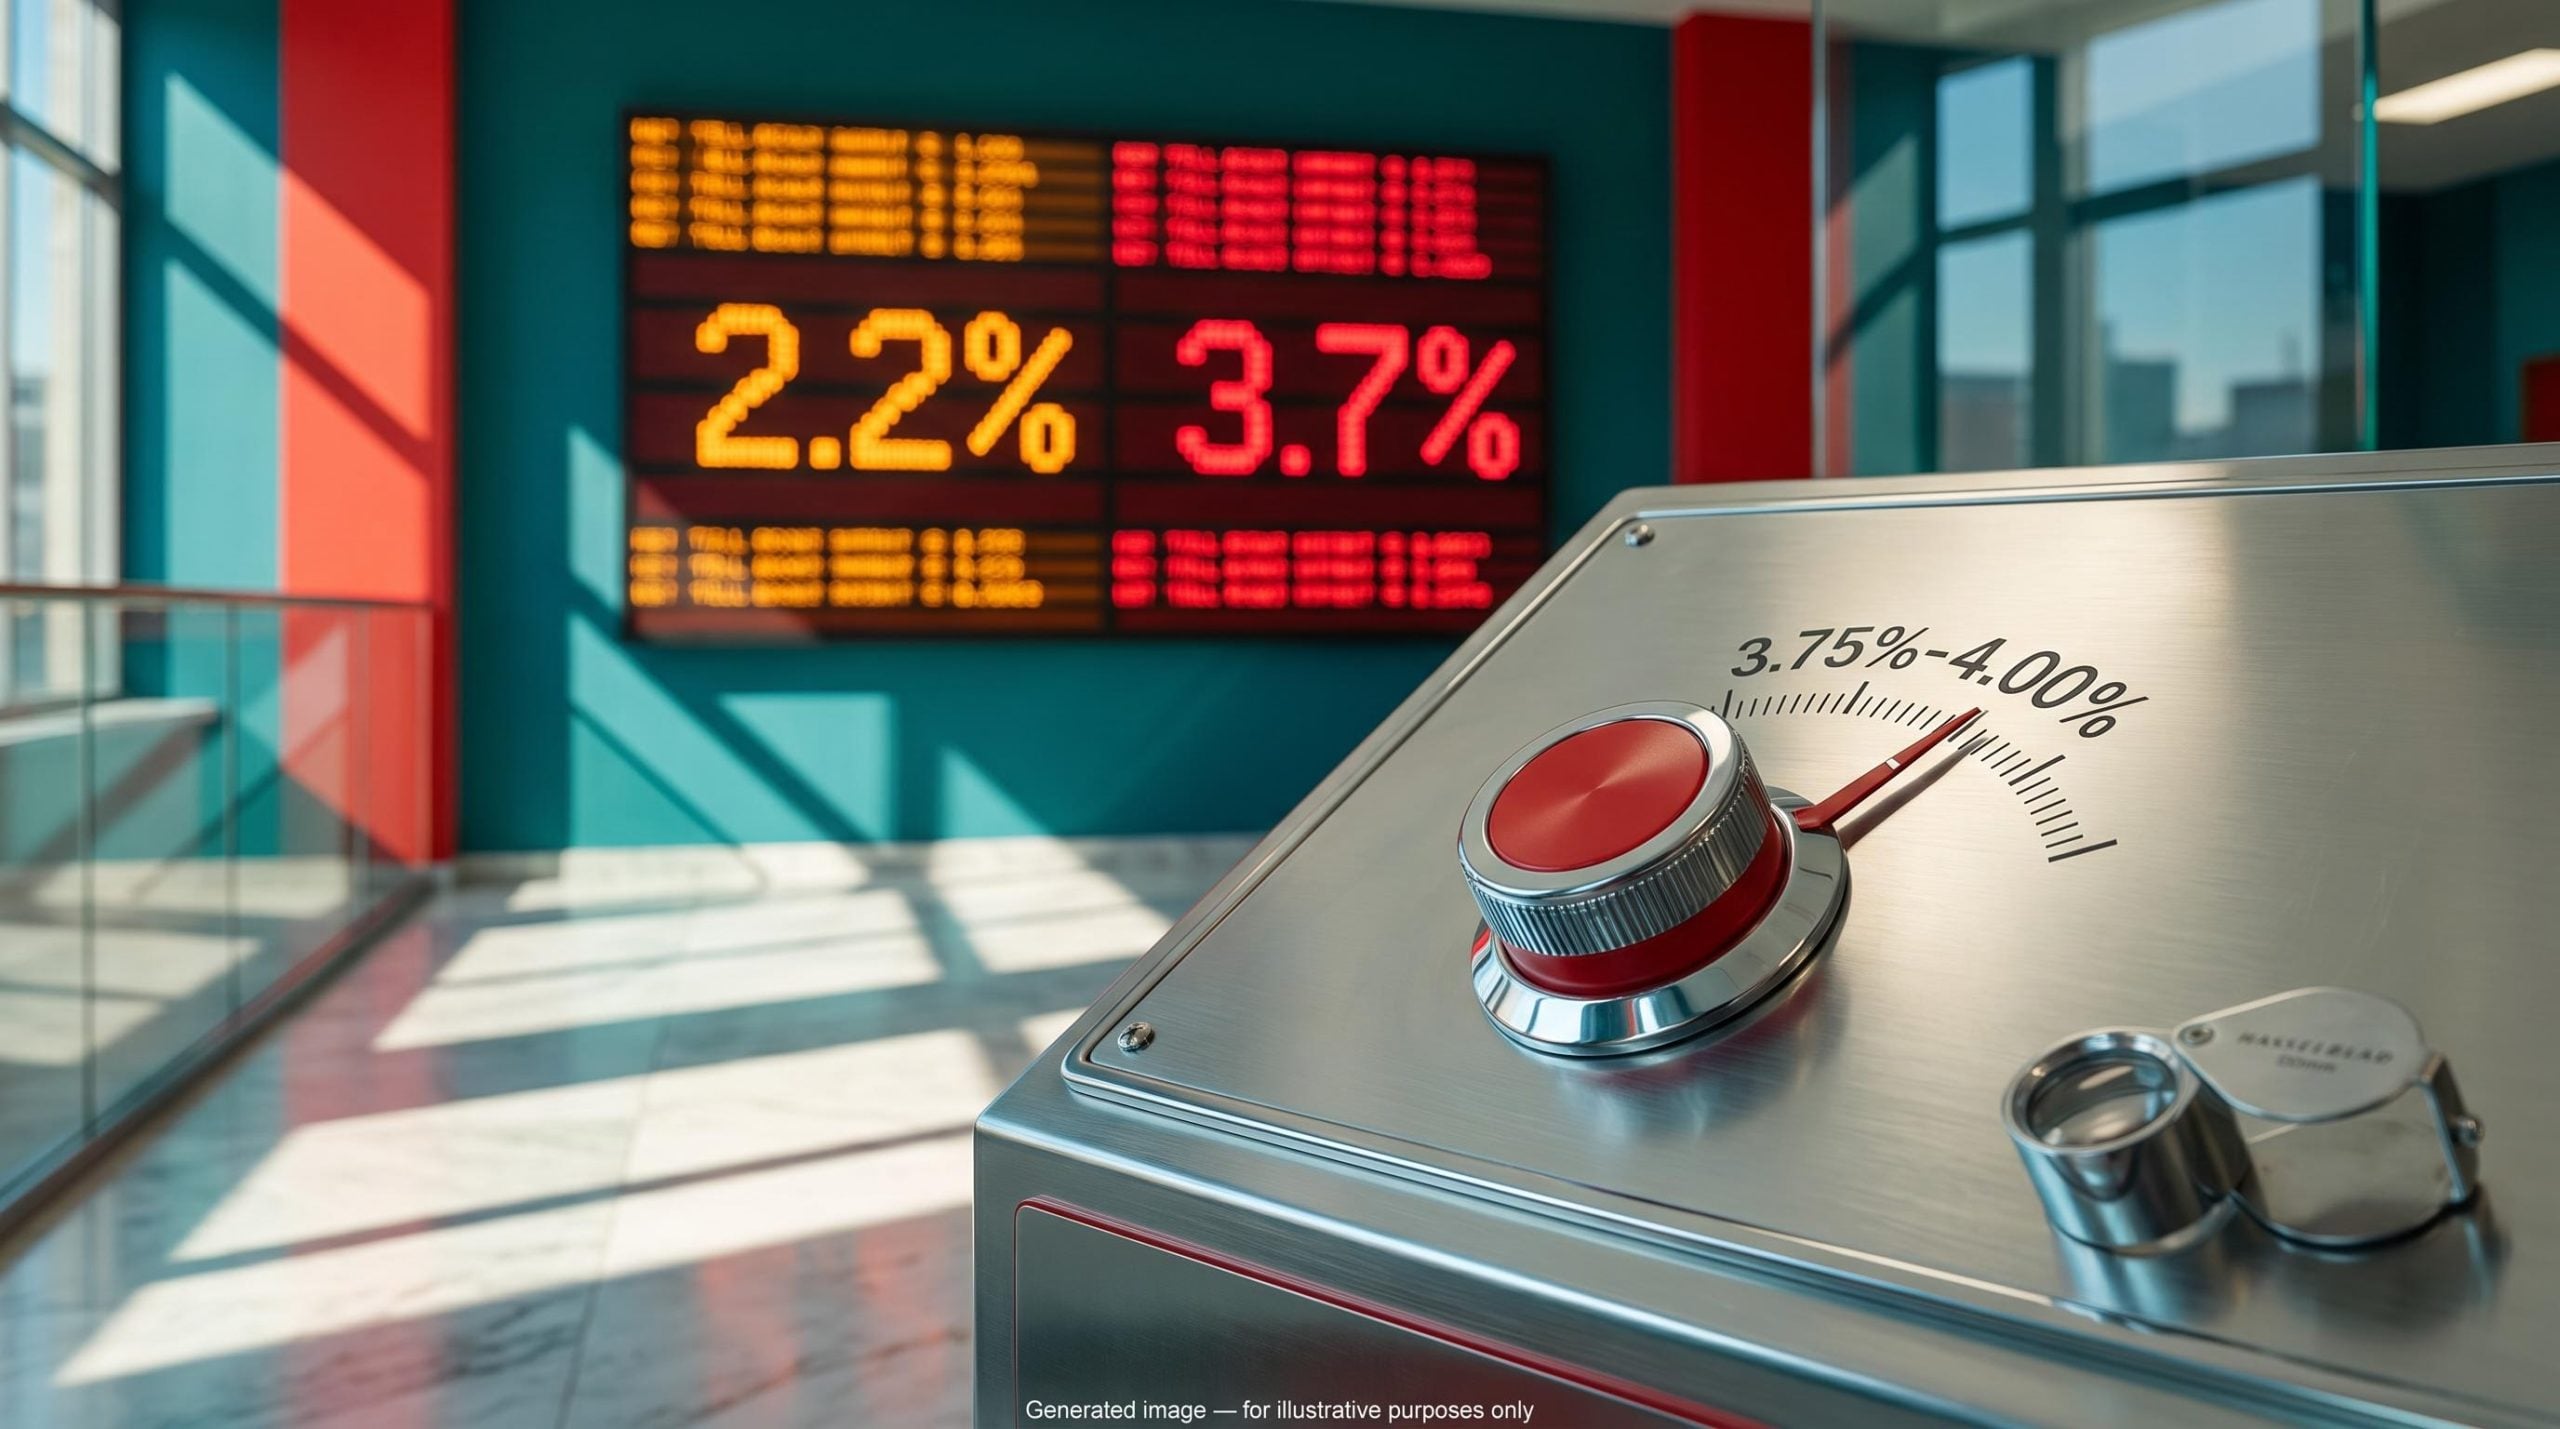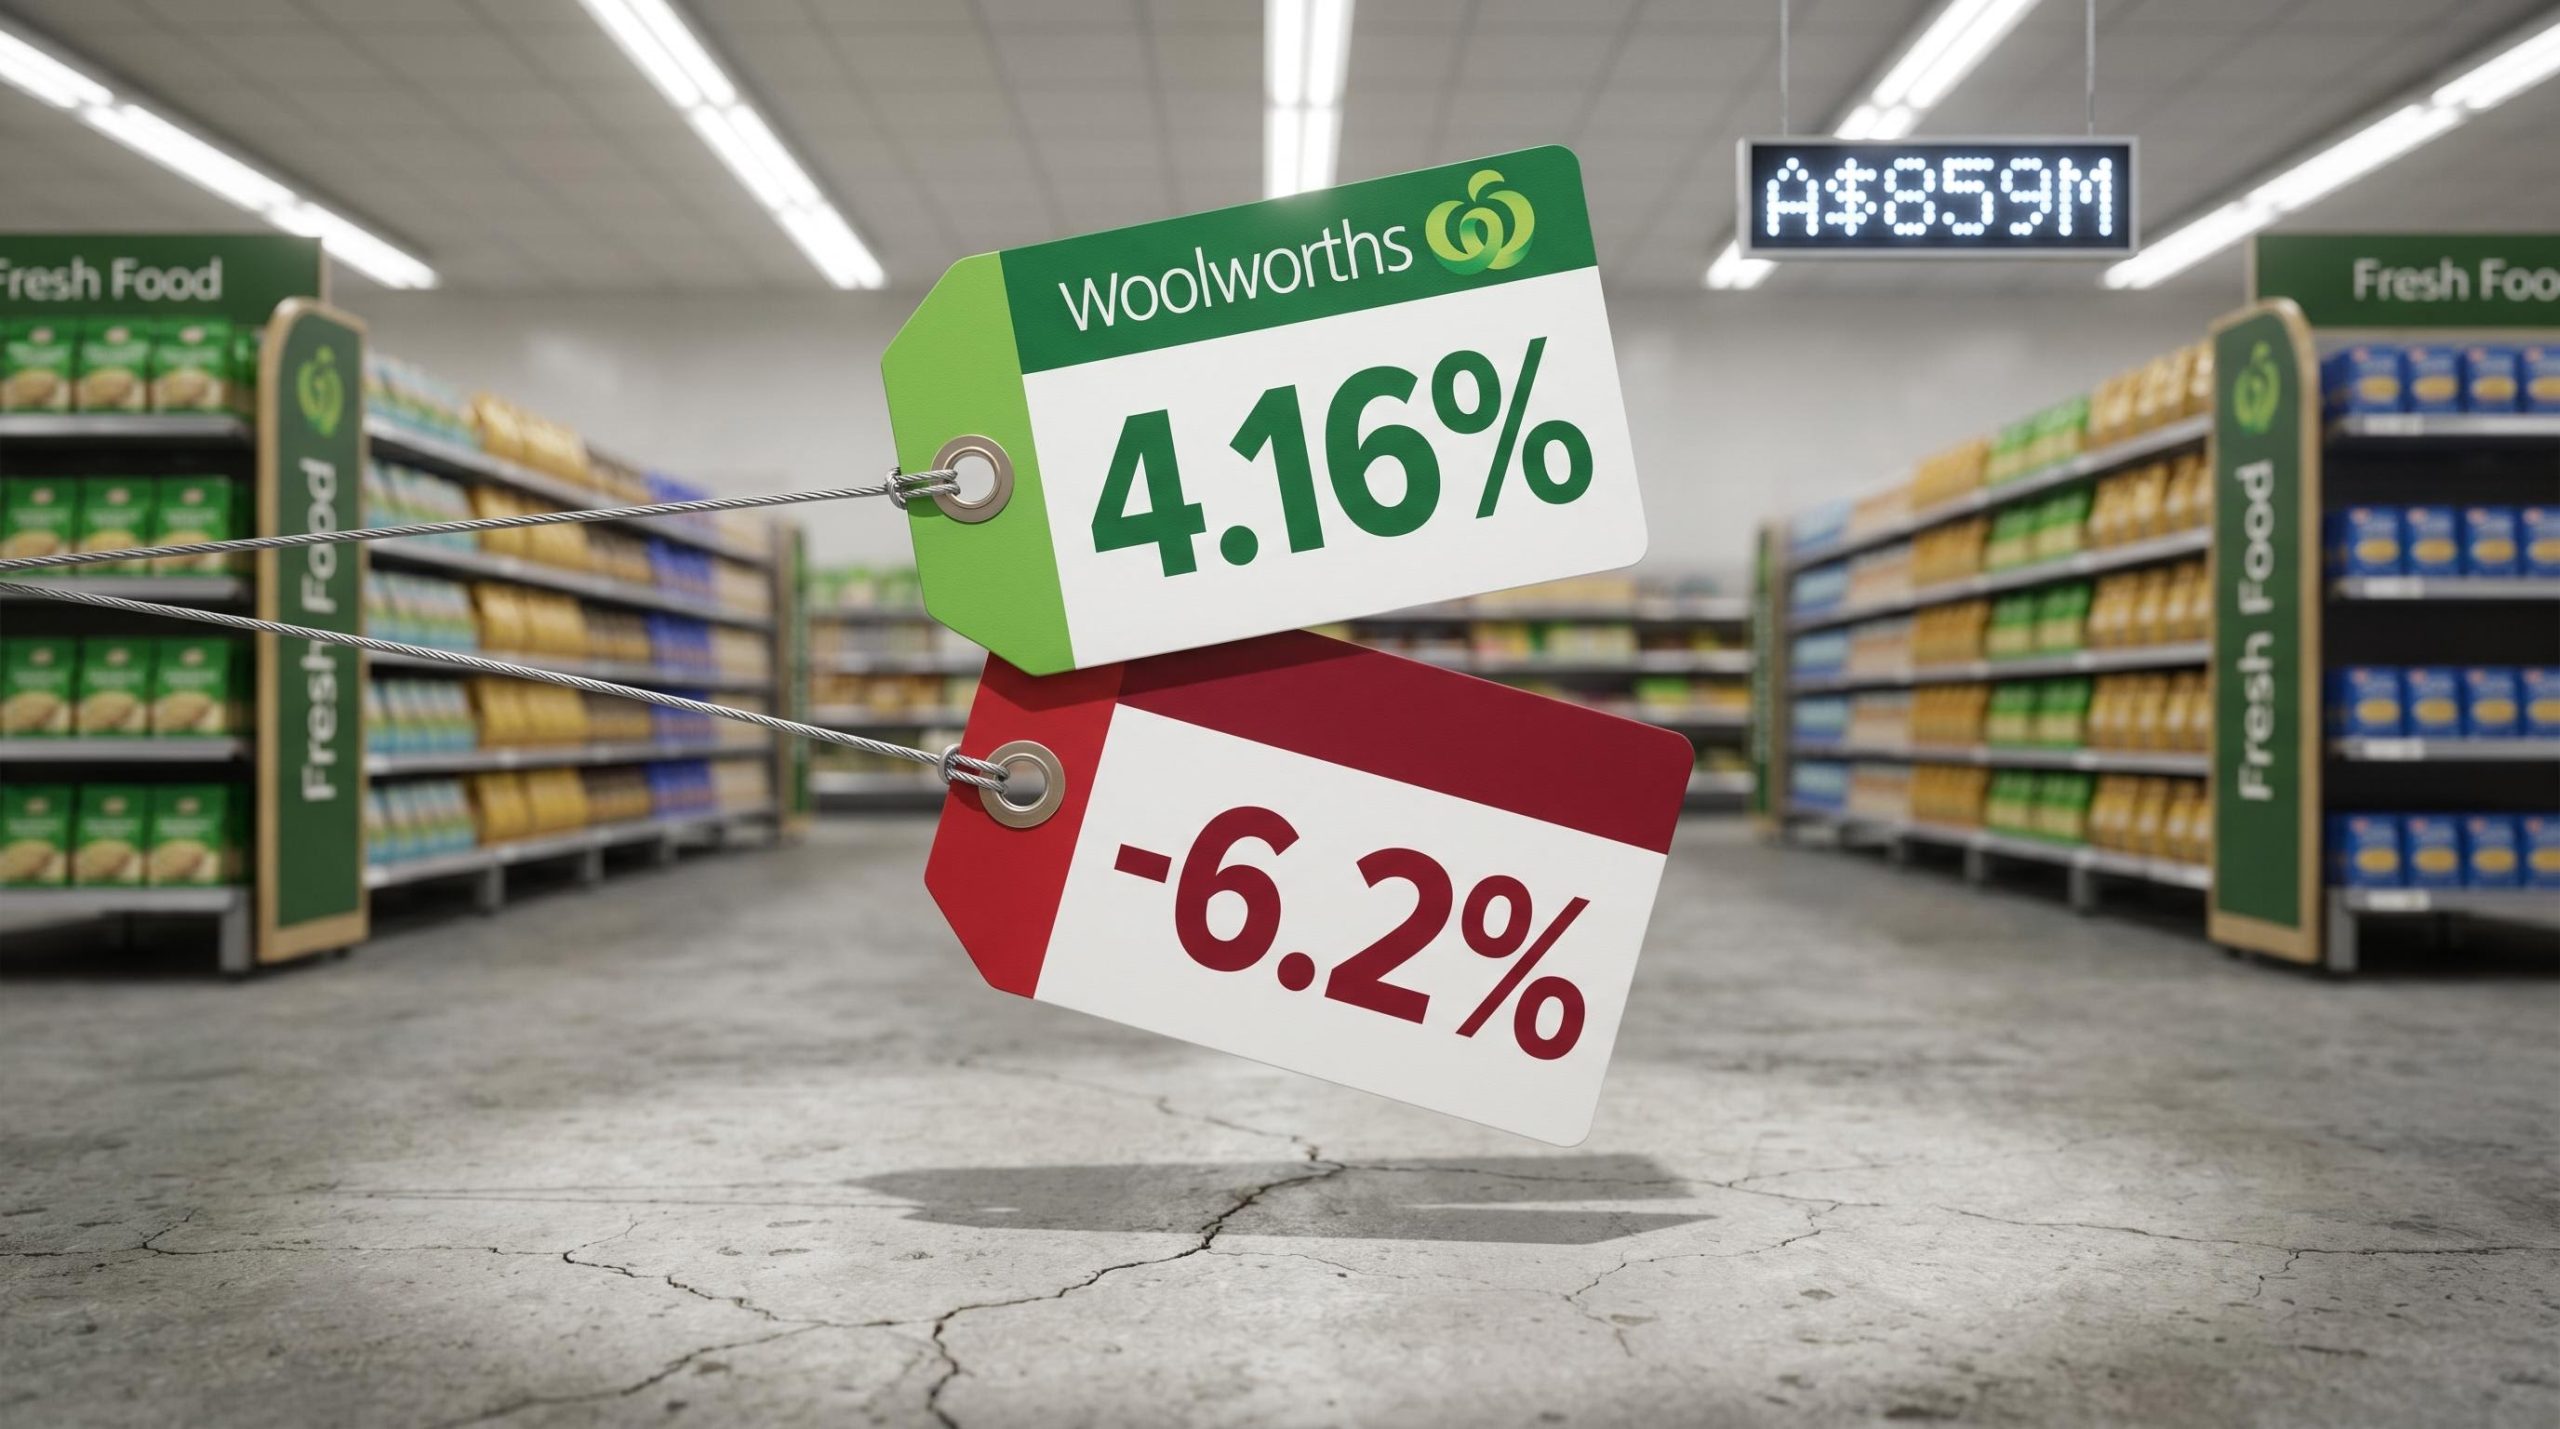
Woolworths Group shares have climbed 17.57% year-to-date in 2026, yet the company’s net profit has been shrinking at a compound annual rate of 6.2% for three years. That contradiction sits at the centre of the current investment debate around one of the ASX’s most widely held stocks.
The timing has sharpened the tension. Multiple broker upgrades from JPMorgan, Bell Potter, and Goldman Sachs arrived alongside a strong H1 FY26 earnings beat in February 2026, while the dividend yield sits 124 basis points above its five-year average. Each of these signals points toward recovery. At the same time, the balance sheet carries over A$15 billion in net debt including lease liabilities, return on equity sits at just 1.9%, and Australian Food margins have compressed meaningfully over two years.
This analysis unpacks each major financial layer of the Woolworths investment case, from the catalysts behind the rally through the earnings, leverage, yield, and competitive dynamics, so investors can assess whether the share price recovery reflects genuine fundamental improvement or has moved ahead of what the earnings trajectory supports.
The rally in WOW shares has a story behind it
The recovery has a specific starting point. In February 2026, Woolworths reported H1 FY26 results that exceeded market expectations, and the analyst response was swift.
H1 FY26 underlying NPAT came in at A$859 million, up 16% year-on-year, with the interim dividend lifted to A$0.45 per share (fully franked), a 15.4% increase.
Three broker upgrades followed in quick succession:
- JPMorgan upgraded from Neutral to Overweight (post H1 FY26 results, February 2026)
- Bell Potter upgraded from Hold to Buy (late 2025)
- Goldman Sachs initiated coverage with a Buy rating (January 2026)
The share price responded. Year-to-date gains reached 29.63% at their April 2026 peak before pulling back to 17.57% by late May 2026. The average 12-month analyst price target sits at approximately A$34.80-A$35.59, with the full consensus range spanning A$31.50 to A$39.00.
The ASX consumer staples sector returned -1.57% per year over the five years to May 2026 while the broader ASX 200 gained 3.91% annually, a gap that reframes the defensive label: staples companies protect earnings more reliably than they protect share prices, and the distinction matters when evaluating whether a recovery rally is justified.
What complicates the picture is what was happening to profits during the same period. FY25 underlying NPAT came in at A$1.39 billion, approximately 19% below the prior year. The rally, in other words, was built on a half-year earnings beat that followed a full-year earnings decline. Whether the H1 FY26 result marks a genuine inflection or a partial recovery within a deteriorating trend is the question the rest of this analysis addresses.
When big ASX news breaks, our subscribers know first
Three years of revenue growth could not stop profit from shrinking
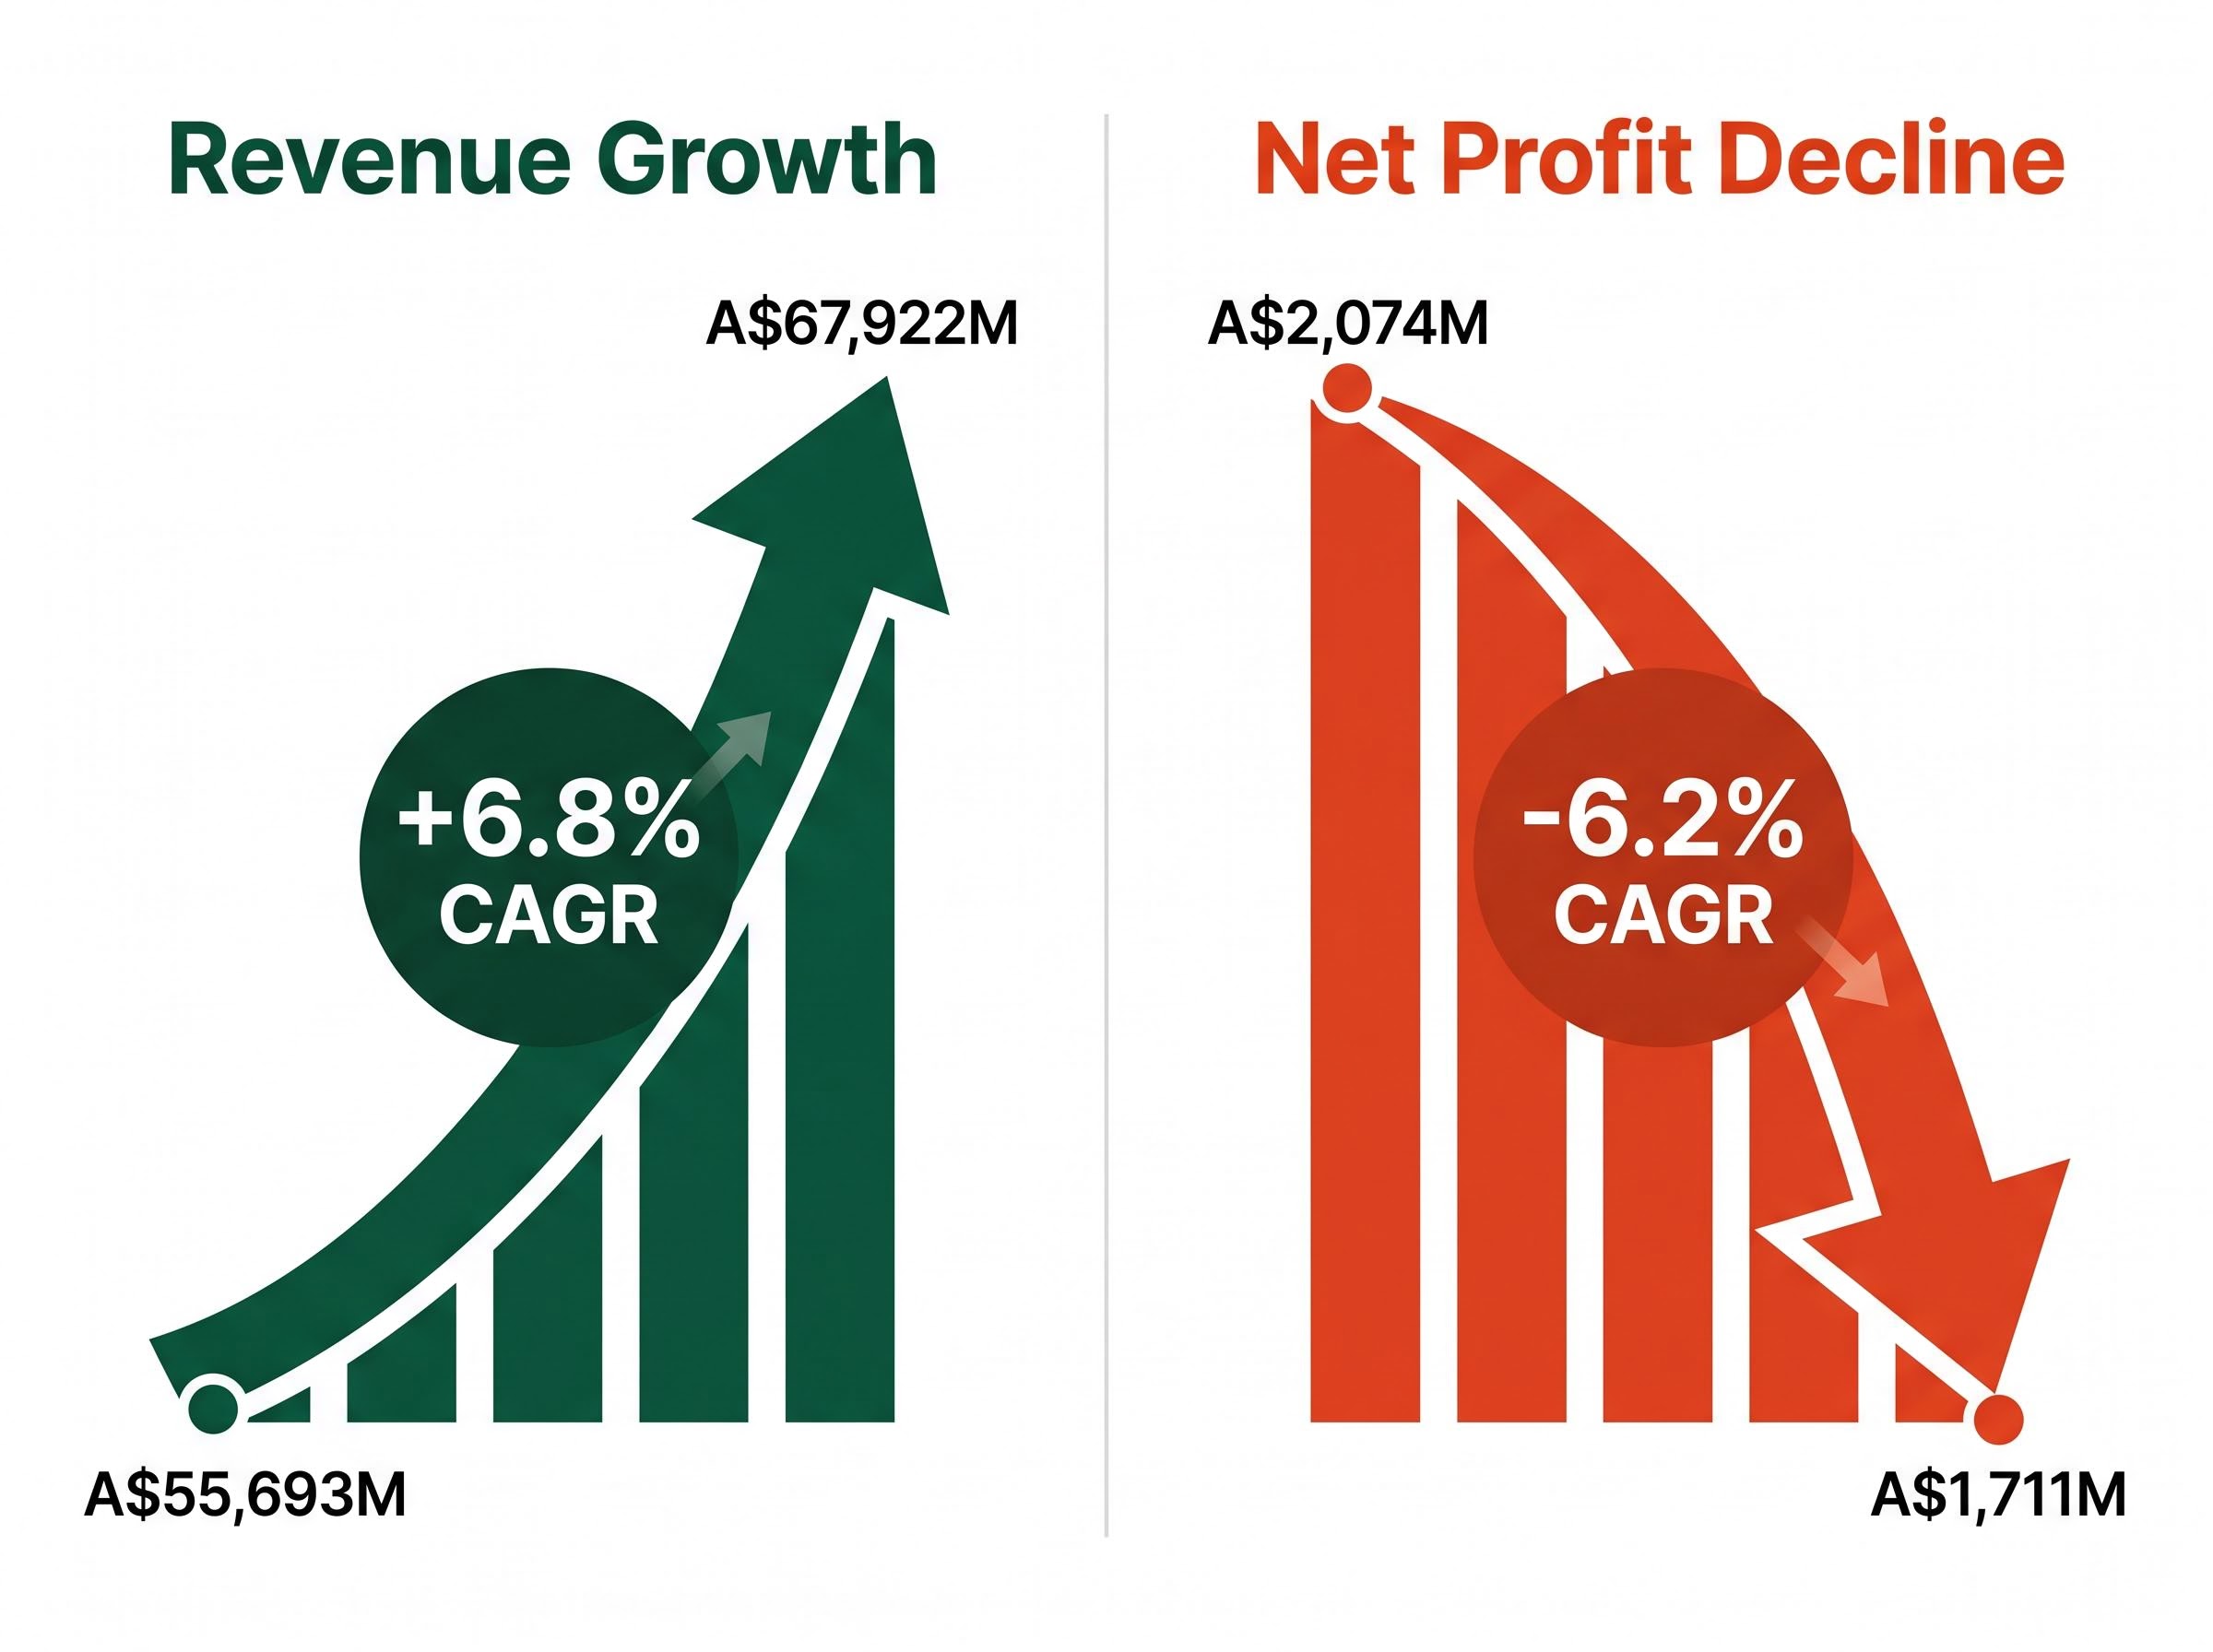
The divergence between Woolworths’ top line and bottom line over the past three years is stark. Revenue grew at a compound annual rate of 6.8%, reaching A$67,922 million in the most recent full year. Profit moved in the opposite direction.
| Metric | Three Years Prior | Most Recent Year | CAGR |
|---|---|---|---|
| Revenue | A$55,693M (approx.) | A$67,922M | +6.8% |
| Net Profit | A$2,074M | A$1,711M | -6.2% |
Revenue growth of 6.8% per year that coincides with profit declining at 6.2% per year tells a specific story: the cost structure absorbed more than the sales growth delivered. For investors, the mechanism matters as much as the outcome.
Why revenue growth did not protect margins
Three cost pressures compressed Australian Food EBIT margins from approximately 6.2% to approximately 5.4% over the period.
First, wage costs rose across the store network, reflecting both enterprise agreement increases and broader labour market tightness. Second, industrial action at distribution centres added direct costs and disrupted supply chain efficiency. Third, and most structurally significant, Woolworths invested heavily in shelf-price reductions and promotional activity to close the competitive gap with Aldi, which continues to grow its presence in Australian grocery.
That third factor is not a one-off cost. It reflects a strategic decision to defend market share through price investment, and its duration depends on how aggressively Aldi continues to expand. Management’s response centres on an A$400 million cost-savings programme targeting supply chain efficiency and operational streamlining. FY26 group revenue is forecast at A$71.6 billion (up 3.6%), with Australian Food EBIT growth guidance adjusted to the lower end of the mid- to high-single-digit range. Tobacco headwinds of A$80-100 million add a further drag.
The margin question is whether the cost-savings programme can offset the structural competitive pressures. So far, the H1 FY26 result suggests partial progress, not resolution.
What debt at this level actually means for a supermarket operator
Woolworths’ debt-to-equity ratio of approximately 370% (3.7x) and total net debt including lease liabilities of approximately A$15.99 billion are headline figures that require careful interpretation.
| Metric | Figure | Context |
|---|---|---|
| Net debt (ex-leases) | A$4.115B | Traditional borrowings and derivatives (June 2025) |
| Total net debt (inc-leases) | A$15.99B | Includes AASB 16 lease liabilities across 3,000+ stores |
| Net debt/EBITDA | 2.8x | Up from 2.6x the prior year |
| Debt-to-equity | 3.7x (370%) | Elevated by lease liabilities relative to equity base |
| Return on equity | 1.9% | FY24; reflects compressed earnings against equity base |
The distinction between the two debt figures matters. Supermarket operators structurally carry high lease-related debt because their business model depends on thousands of store locations, almost all leased rather than owned. Under AASB 16 accounting standards, these lease obligations appear on the balance sheet as liabilities. This is not debt incurred through acquisitions or capital market borrowing; it is the accounting reflection of the store network itself.
The more operationally meaningful metric is net debt-to-EBITDA at 2.8x, which remains within Woolworths’ internal leverage thresholds. The direction of travel, however, deserves attention: the ratio rose from 2.6x the prior year, and net finance costs increased approximately 11.4% on a normalised basis in FY25.
A return on equity of 1.9% means Woolworths generated less than two cents of profit for every dollar of shareholder equity, a level that raises questions about capital efficiency regardless of how the debt is structured.
For income investors holding the stock on dividend appeal, rising finance costs directly constrain the free cash flow available for distribution. A supermarket’s debt may be structural, but the interest expense is real.
EBIT decline and dividend headroom are connected more tightly than a headline yield suggests: when group EBIT falls from approximately A$3,330 million to approximately A$2,754 million in a single year, interest coverage deteriorates alongside it, and the free cash flow available to support distributions compresses even if the payout ratio is managed conservatively.
What Woolworths’ elevated dividend yield is signalling to investors
A dividend yield above historical averages can mean different things, and reading it correctly requires understanding what is driving the premium. Dividend yield is calculated by dividing the annual dividend per share by the current share price. When that yield rises above its historical average, the signal could indicate the share price has not kept pace with dividend growth, the dividend has grown faster than expected, or the market is pricing in elevated risk to the earnings that support the payout.
Woolworths’ current yield of approximately 4.16% sits 124 basis points above its five-year average of 2.92%. The most recent annual dividend exceeded the three-year average, and the interim dividend was lifted to A$0.45 per share (fully franked), up 15.4% year-on-year.
The 124-basis-point yield premium above Woolworths’ five-year average is the most direct valuation signal available to income investors, and it carries two distinct readings.
Two interpretations compete:
- The bullish reading: Dividend growth is genuine and accelerating. The 15.4% interim lift is backed by real H1 FY26 earnings improvement, and the yield premium represents an attractive entry point for income investors before the market reprices the stock higher.
- The cautionary reading: The yield is elevated partly because the share price spent much of 2025 under pressure following the FY25 earnings decline. A declining earnings base and A$15.99 billion in total net debt constrain how far dividends can grow, and the current yield may reflect risk rather than value.
Analysts recommend discounted cash flow and Dividend Discount Model frameworks for a more rigorous intrinsic value assessment. A gross margin of 56.0% provides some buffer, but the sustainability of dividend growth ultimately depends on whether the EBIT margin can recover from 5.4% toward prior levels.
The competitive and regulatory pressures that shape every WOW earnings forecast
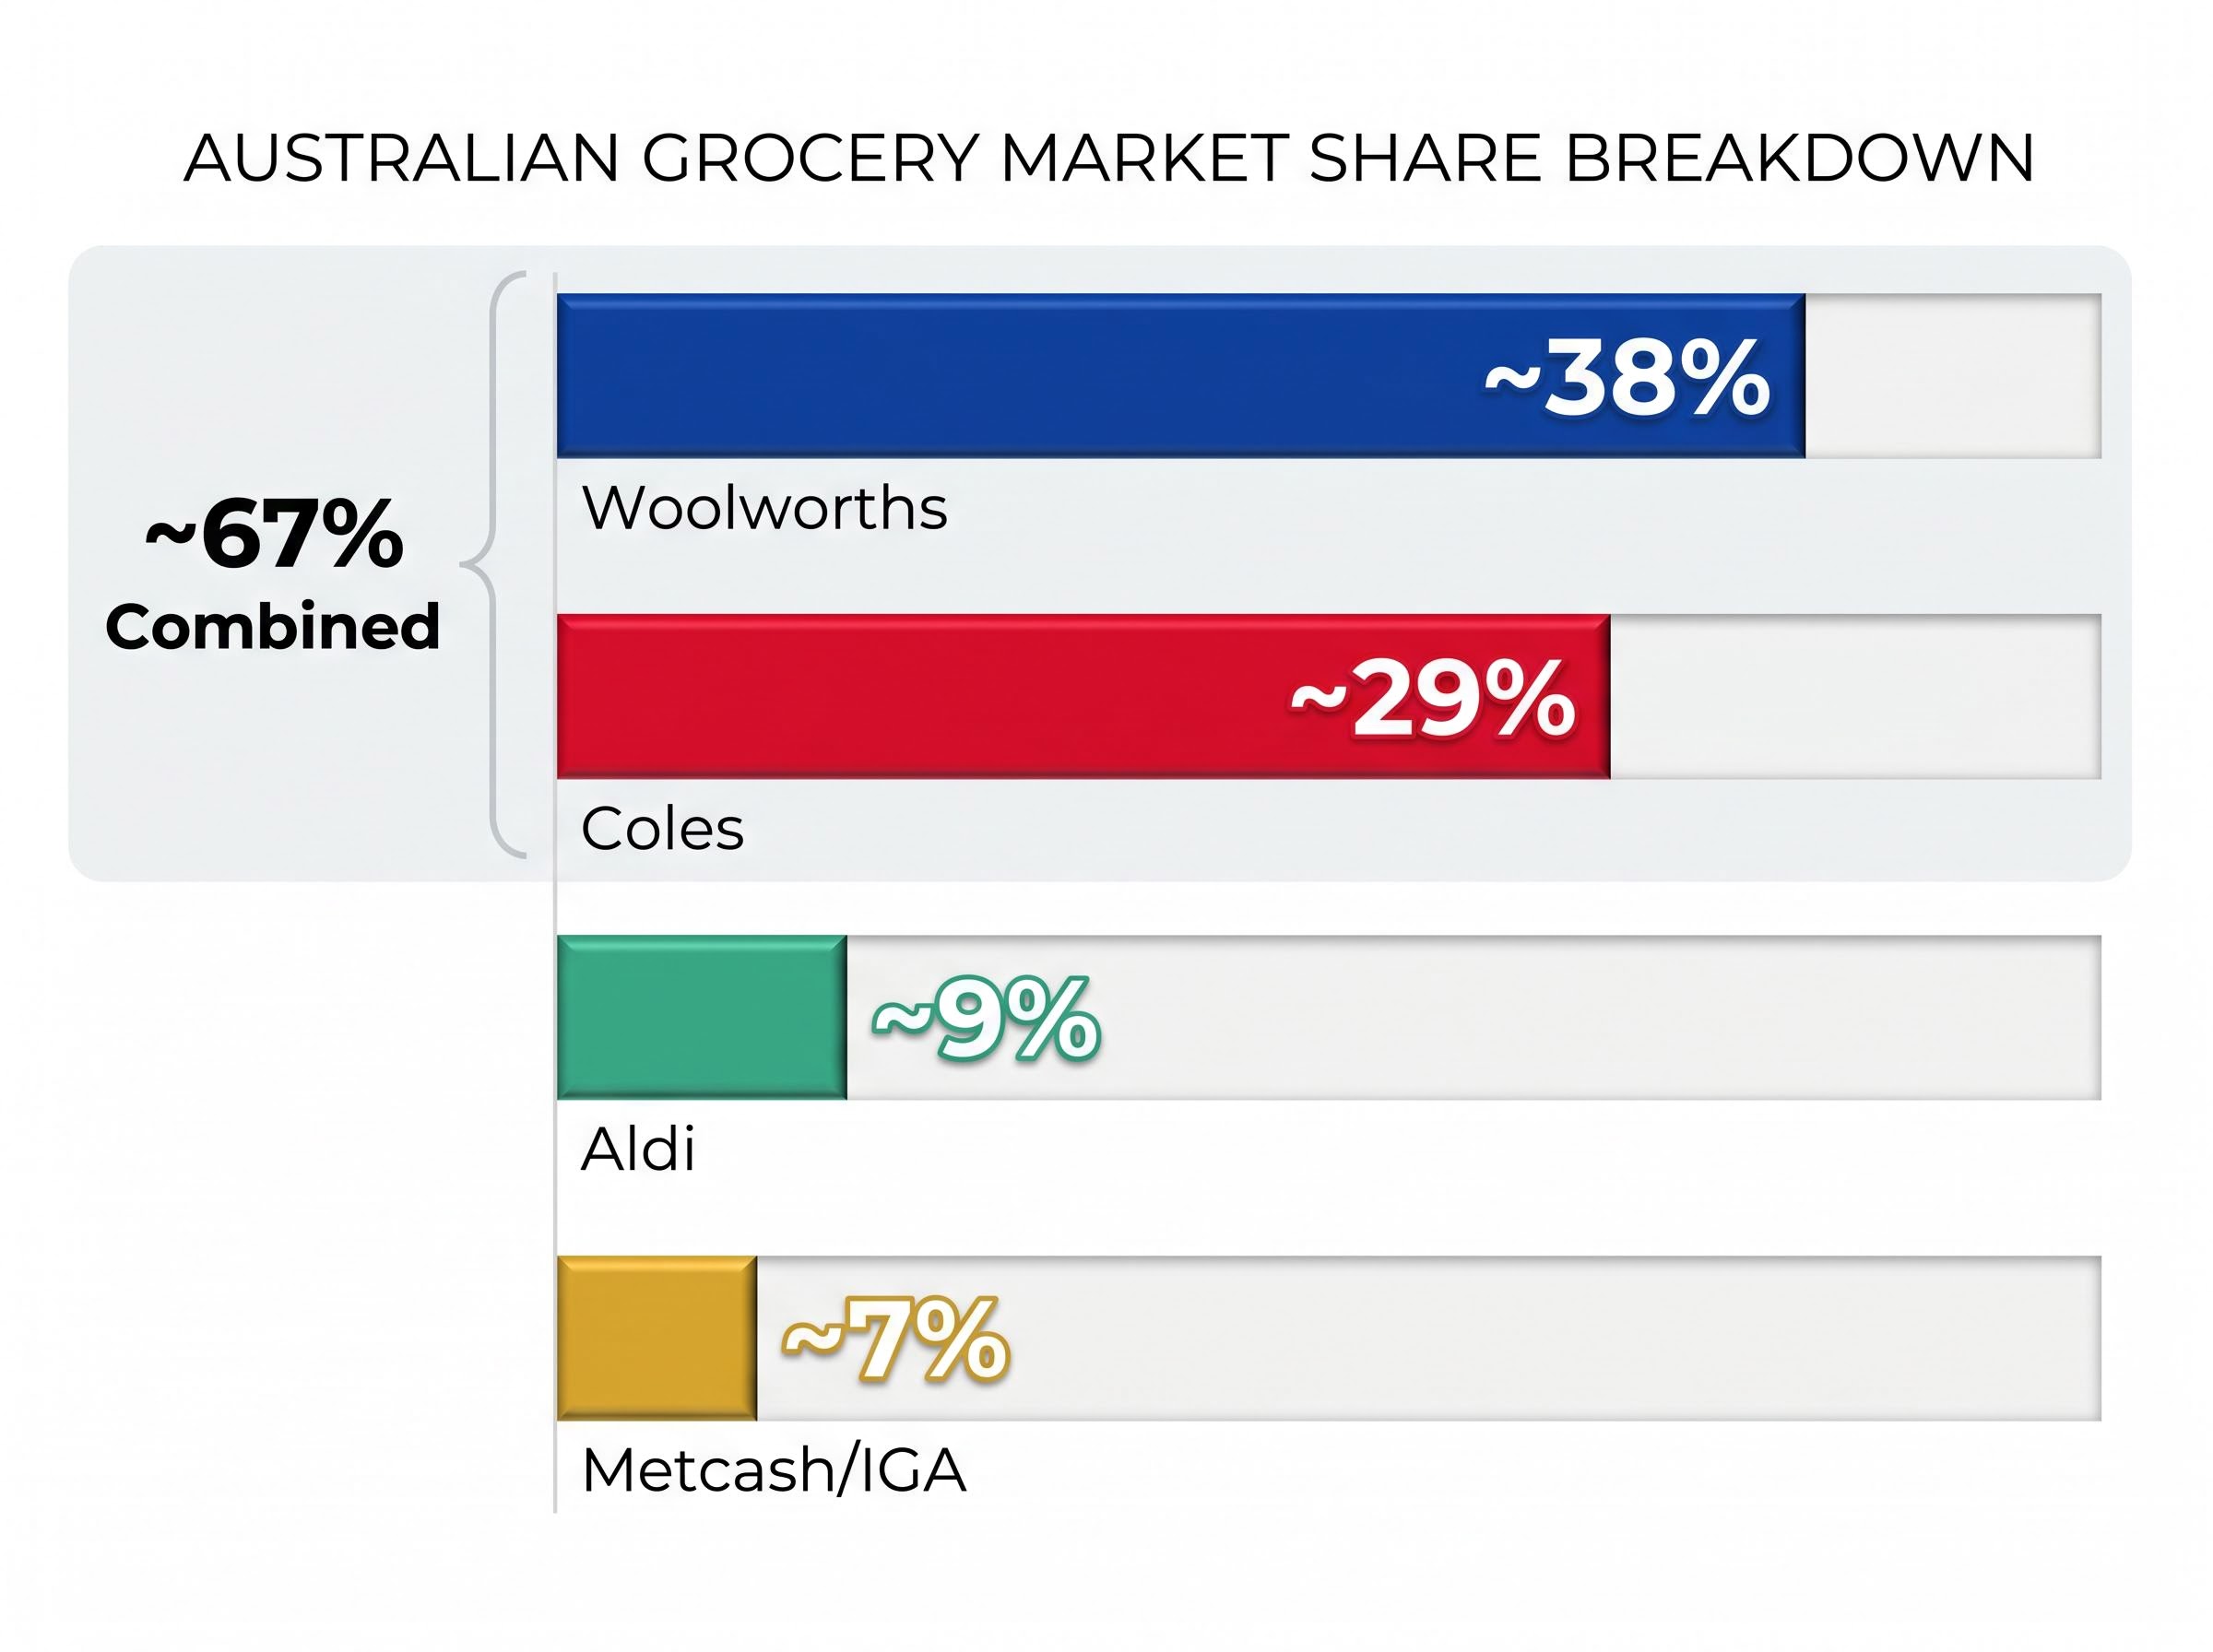
Woolworths’ margin recovery depends on more than its own cost initiatives. The structural competitive environment sets the ceiling on how much of the A$400 million savings programme can convert into bottom-line improvement.
| Player | Market Share (%) |
|---|---|
| Woolworths | ~38% |
| Coles | ~29% |
| Combined (Coles + Woolworths) | ~67% |
| Aldi | ~9% |
| Metcash/IGA | ~7% |
Both Woolworths and Coles have lowered shelf prices and increased promotional investment to close the competitive gap with Aldi through 2025 and 2026. This is a structural cost, not a temporary promotional cycle. As long as Aldi continues to expand in Australian grocery, the two majors face ongoing pressure to invest in price competitiveness, and that investment comes directly out of operating margins.
What the ACCC inquiry means for Woolworths’ operating costs
The Australian Competition and Consumer Commission (ACCC) released its final Supermarkets Inquiry report in March 2025, confirming the Coles-Woolworths duopoly’s dominance and recommending structural and regulatory reforms. This was not simply a set of findings; the report proposed ongoing regulatory scrutiny of supermarket pricing practices.
The ACCC Supermarkets Inquiry final report, released in March 2025, concluded that the Coles-Woolworths duopoly held substantial market power and recommended ongoing regulatory oversight of pricing practices, including specific scrutiny of promotional and discount mechanisms that form a core competitive tool for both majors.
Both majors face legal scrutiny over alleged misleading discount and promotional practices. The compliance costs associated with this scrutiny are real: legal, operational, and reputational. More importantly, ongoing ACCC oversight constrains the promotional flexibility that supermarkets use to compete on value, limiting one of the primary levers available to management.
The ACCC promotional conduct ruling against Coles in May 2026, which found price establishment periods were insufficient before products entered the Down Down programme, illustrates precisely the kind of compliance constraint that the current regulatory environment imposes on both majors: what supermarkets previously treated as standard promotional flexibility is now subject to minimum timing rules and civil penalty exposure.
Investors who treat the A$400 million savings target as a direct path to earnings recovery without accounting for competitive price investment and regulatory compliance costs risk overestimating the FY26 margin improvement.
The WOW investment case as it stands in May 2026: recovery priced in, or more to come?
The five analytical threads above converge on a share price that reflects a genuine but incomplete recovery story. The question for investors is whether the current price has already absorbed the good news.
| Signal | Bull Case | Bear Case |
|---|---|---|
| Earnings trend | H1 FY26 NPAT of A$859M (+16% YoY) | Three-year profit CAGR of -6.2% |
| Leverage | Net debt/EBITDA of 2.8x within internal thresholds | Rising from 2.6x; finance costs up 11.4% |
| Yield | 4.16% fully franked; interim dividend up 15.4% | Yield premium may reflect risk, not value |
| Analyst consensus | 6 Buy, 9 Hold; target implies modest upside | 1 Sell; target range as low as A$31.50 |
| Competitive environment | Defensive sector; 38% market share | Structural price investment vs Aldi; ACCC scrutiny |
The consensus 12-month price target range of A$31.50 to A$39.00 reflects a market that is itself divided on whether the recovery story has further to run.
The ratings split of 6 Buy, 9 Hold, and 1 Sell captures the ambiguity. The bull case rests on H1 FY26 earnings momentum, defensive sector characteristics, a 4.16% fully franked yield, and a cost-savings programme that could rebuild margins. The bear case holds equal weight: a return on equity of 1.9%, net debt/EBITDA trending upward, FY26 guidance adjusted to the lower end of the range, and competitive price investment with no near-term resolution.
Neither case is speculative. Both are grounded in the same financial data, read through different lenses.
For ASX investors weighing WOW, the metrics tell a story worth sitting with
The share price recovery is real, and it is grounded in a genuine H1 FY26 earnings improvement. The three-year profit trajectory and balance sheet leverage, however, mean the margin of safety at current prices is thin.
The investment question is not whether Woolworths is a quality business. A 100-year operating history and a network of over 3,000 stores across Australia provide structural durability that few ASX-listed companies can match. The question is whether Woolworths can rebuild its EBIT margin to levels that justify the current share price, and the A$400 million cost-savings programme and FY26 full-year results represent the near-term moments when that question will be answered.
Discounted cash flow and Dividend Discount Model frameworks offer more rigorous tools for assessing intrinsic value than yield or price-to-earnings ratios alone. For income-focused ASX portfolios, Woolworths remains a perennial consideration, but the analytical work of distinguishing between a recovery in progress and a rally that has outpaced its earnings support is not yet complete.
For investors wanting to apply the valuation frameworks mentioned above rather than rely on yield ratios alone, our full explainer on the Dividend Discount Model for ASX income stocks walks through the Gordon Growth Model formula, explains how franking credits affect the effective discount rate for Australian superannuation investors, and identifies the ASX sectors where the model’s assumptions hold most reliably.
This article is for informational purposes only and should not be considered financial advice. Investors should conduct their own research and consult with financial professionals before making investment decisions. Past performance does not guarantee future results. Financial projections are subject to market conditions and various risk factors.