Woolworths’ 4% Dividend Yield: Opportunity or a Warning Signal?
6 mins ago

ANZ shares trade near $35.20 as of mid-May 2026, a price that sits almost precisely on the bank’s dividend discount model (DDM) fair value estimate. That proximity raises a question worth answering with numbers rather than sentiment: does ANZ’s underlying profitability profile justify the discount to its major bank peers, or has the market mispriced the gap? The answer sits in three metrics: net interest margin (NIM), return on equity (ROE), and Common Equity Tier 1 (CET1) capital ratio. Across all three, ANZ’s positioning tells a consistent story. NIM and ROE trail every peer by material margins. Capital strength is peer-equivalent. What follows is a structured peer comparison of ANZ against CBA, NAB, and Westpac across these three dimensions, with an assessment of what the combined picture implies for investors evaluating the stock on fundamentals.
Before the peer numbers land, it helps to understand what each metric measures and why it matters for a bank’s earnings durability.
Why NIM dominates the analysis: Lending income represents approximately 78% of ANZ’s total revenue. When NIM compresses, the largest revenue line compresses with it.
Investors who focus only on share price or dividend yield without interrogating these three metrics are missing the indicators that determine whether a bank’s income stream is durable over a full cycle.
For investors who want a fuller walkthrough of how these three ratios interact in practice, our dedicated guide to valuing ASX bank shares using NIM, ROE and CET1 applies each metric to NAB’s verified H1 2026 results and benchmarks them against all four major banks, including a worked explanation of how NIM feeds through to earnings-per-share and what CET1 thresholds mean for dividend sustainability.
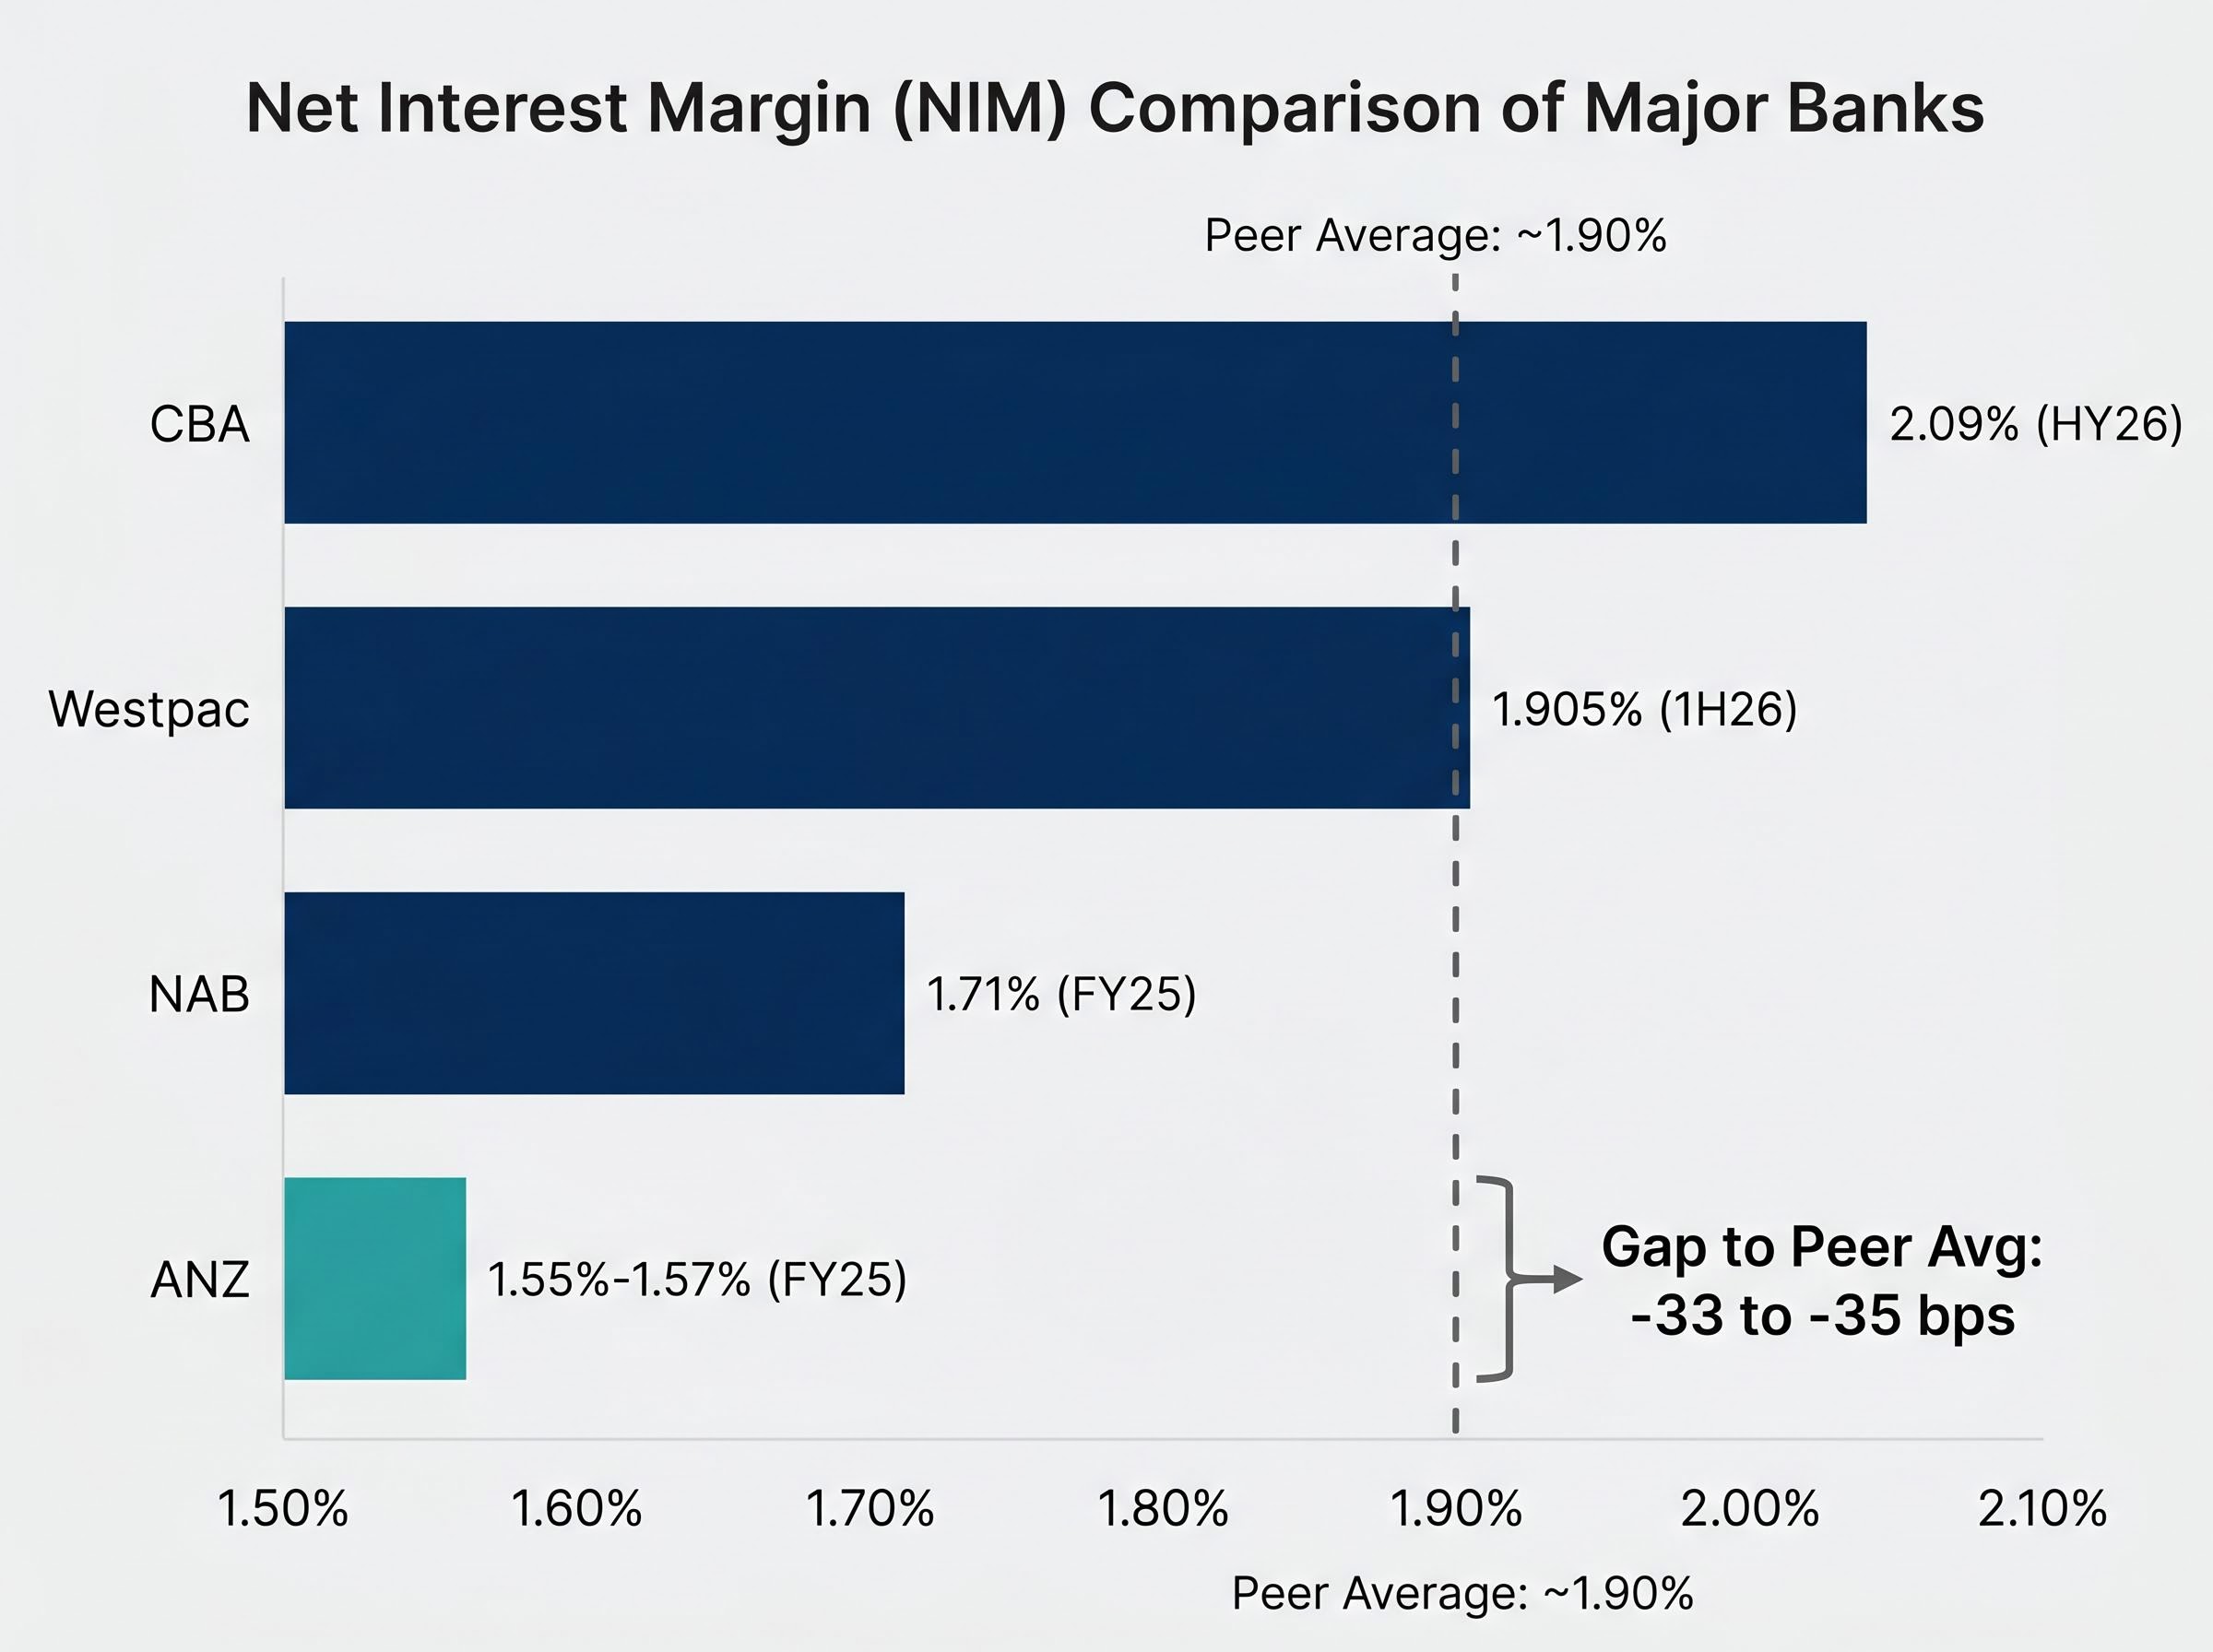
ANZ reported a group NIM of approximately 1.55%-1.57% in its FY25 full-year result (12 months ended 30 September 2025). That places it last among the four major banks by a margin that widens when the peer average is calculated correctly.
| Bank | Reporting Period | NIM (%) | Gap to Peer Avg |
|---|---|---|---|
| CBA | HY26 (6 months to Dec 2025) | ~2.09% | +19 bps |
| Westpac | 1H26 (6 months to Mar 2026) | ~1.905% | Broadly in line |
| NAB | FY25 (12 months to Sep 2025) | ~1.71% | -19 bps |
| ANZ | FY25 (12 months to Sep 2025) | ~1.55%-1.57% | -33 to -35 bps |
The corrected peer average is approximately 1.90%. The arithmetic average of CBA (~2.09%), NAB (~1.71%), and Westpac (~1.905%) produces a three-peer mean of roughly 1.90%, not the narrower ~1.78% figure sometimes cited. ANZ’s deficit is therefore approximately 33-35 basis points, not ~21.
That gap has both structural and cyclical components. On the structural side, ANZ’s deposit franchise captures lower-cost deposits less effectively than CBA, and its business mix is weighted toward lower-margin institutional and wholesale banking. On the cyclical side, central bank rate reductions, deposit repricing lags, and competitive loan pricing are compressing margins across the sector.
NAB’s NIM expansion drivers in 1H26 included improved deposit outcomes that added 3 basis points to the prior half, a contrast with ANZ’s position where deposit franchise weakness remains a structural headwind rather than a near-term tailwind.
ANZ’s 1Q FY26 trading update indicated modest NIM improvement supported by favourable funding mix shifts and growth in operational deposits, but these gains were offset by rate reductions and competitive pressure. The question the market has not resolved is whether the structural ceiling is permanent or whether business mix changes can close the gap over time.
ANZ’s ROE of approximately 9.3% in FY25 places it below all three peers.
What 9.3% means in practice: For every $100 of shareholder equity, ANZ generates approximately $9.30 in annual profit. CBA generates more than $13. That is the gap expressed in the simplest possible terms.
The sector average ROE sits at approximately 9.35%, barely above ANZ’s own result. Rather than benefiting from the sector average, ANZ is pulling it down. The bank’s strategic commentary emphasises incremental improvement through expense discipline and balance-sheet optimisation rather than a step-change re-rating. No materially more ambitious long-term ROE target has been issued.
ROE connects most directly to long-term shareholder value creation. The gap to CBA (approximately 370 basis points) reads as structural distance. The gap to NAB and Westpac (approximately 170 basis points) is more tractable but still meaningful.
On CET1, ANZ holds its own. Its ratio of approximately 12.2% in FY25 sits above the ASX banking sector average and broadly in line with all three peers.
| Bank | CET1 (%) | ROE (%) |
|---|---|---|
| NAB | ~12.4%-12.6% | ~11% |
| Westpac | ~12.3%-12.6% | ~11% |
| CBA | ~12.2%-12.3% | 13%+ |
| ANZ | ~12.2% | ~9.3% |
The differences between majors on CET1 range from 20 to 50 basis points, real but not decisive in isolation. All four sit comfortably above APRA’s regulatory minimums.
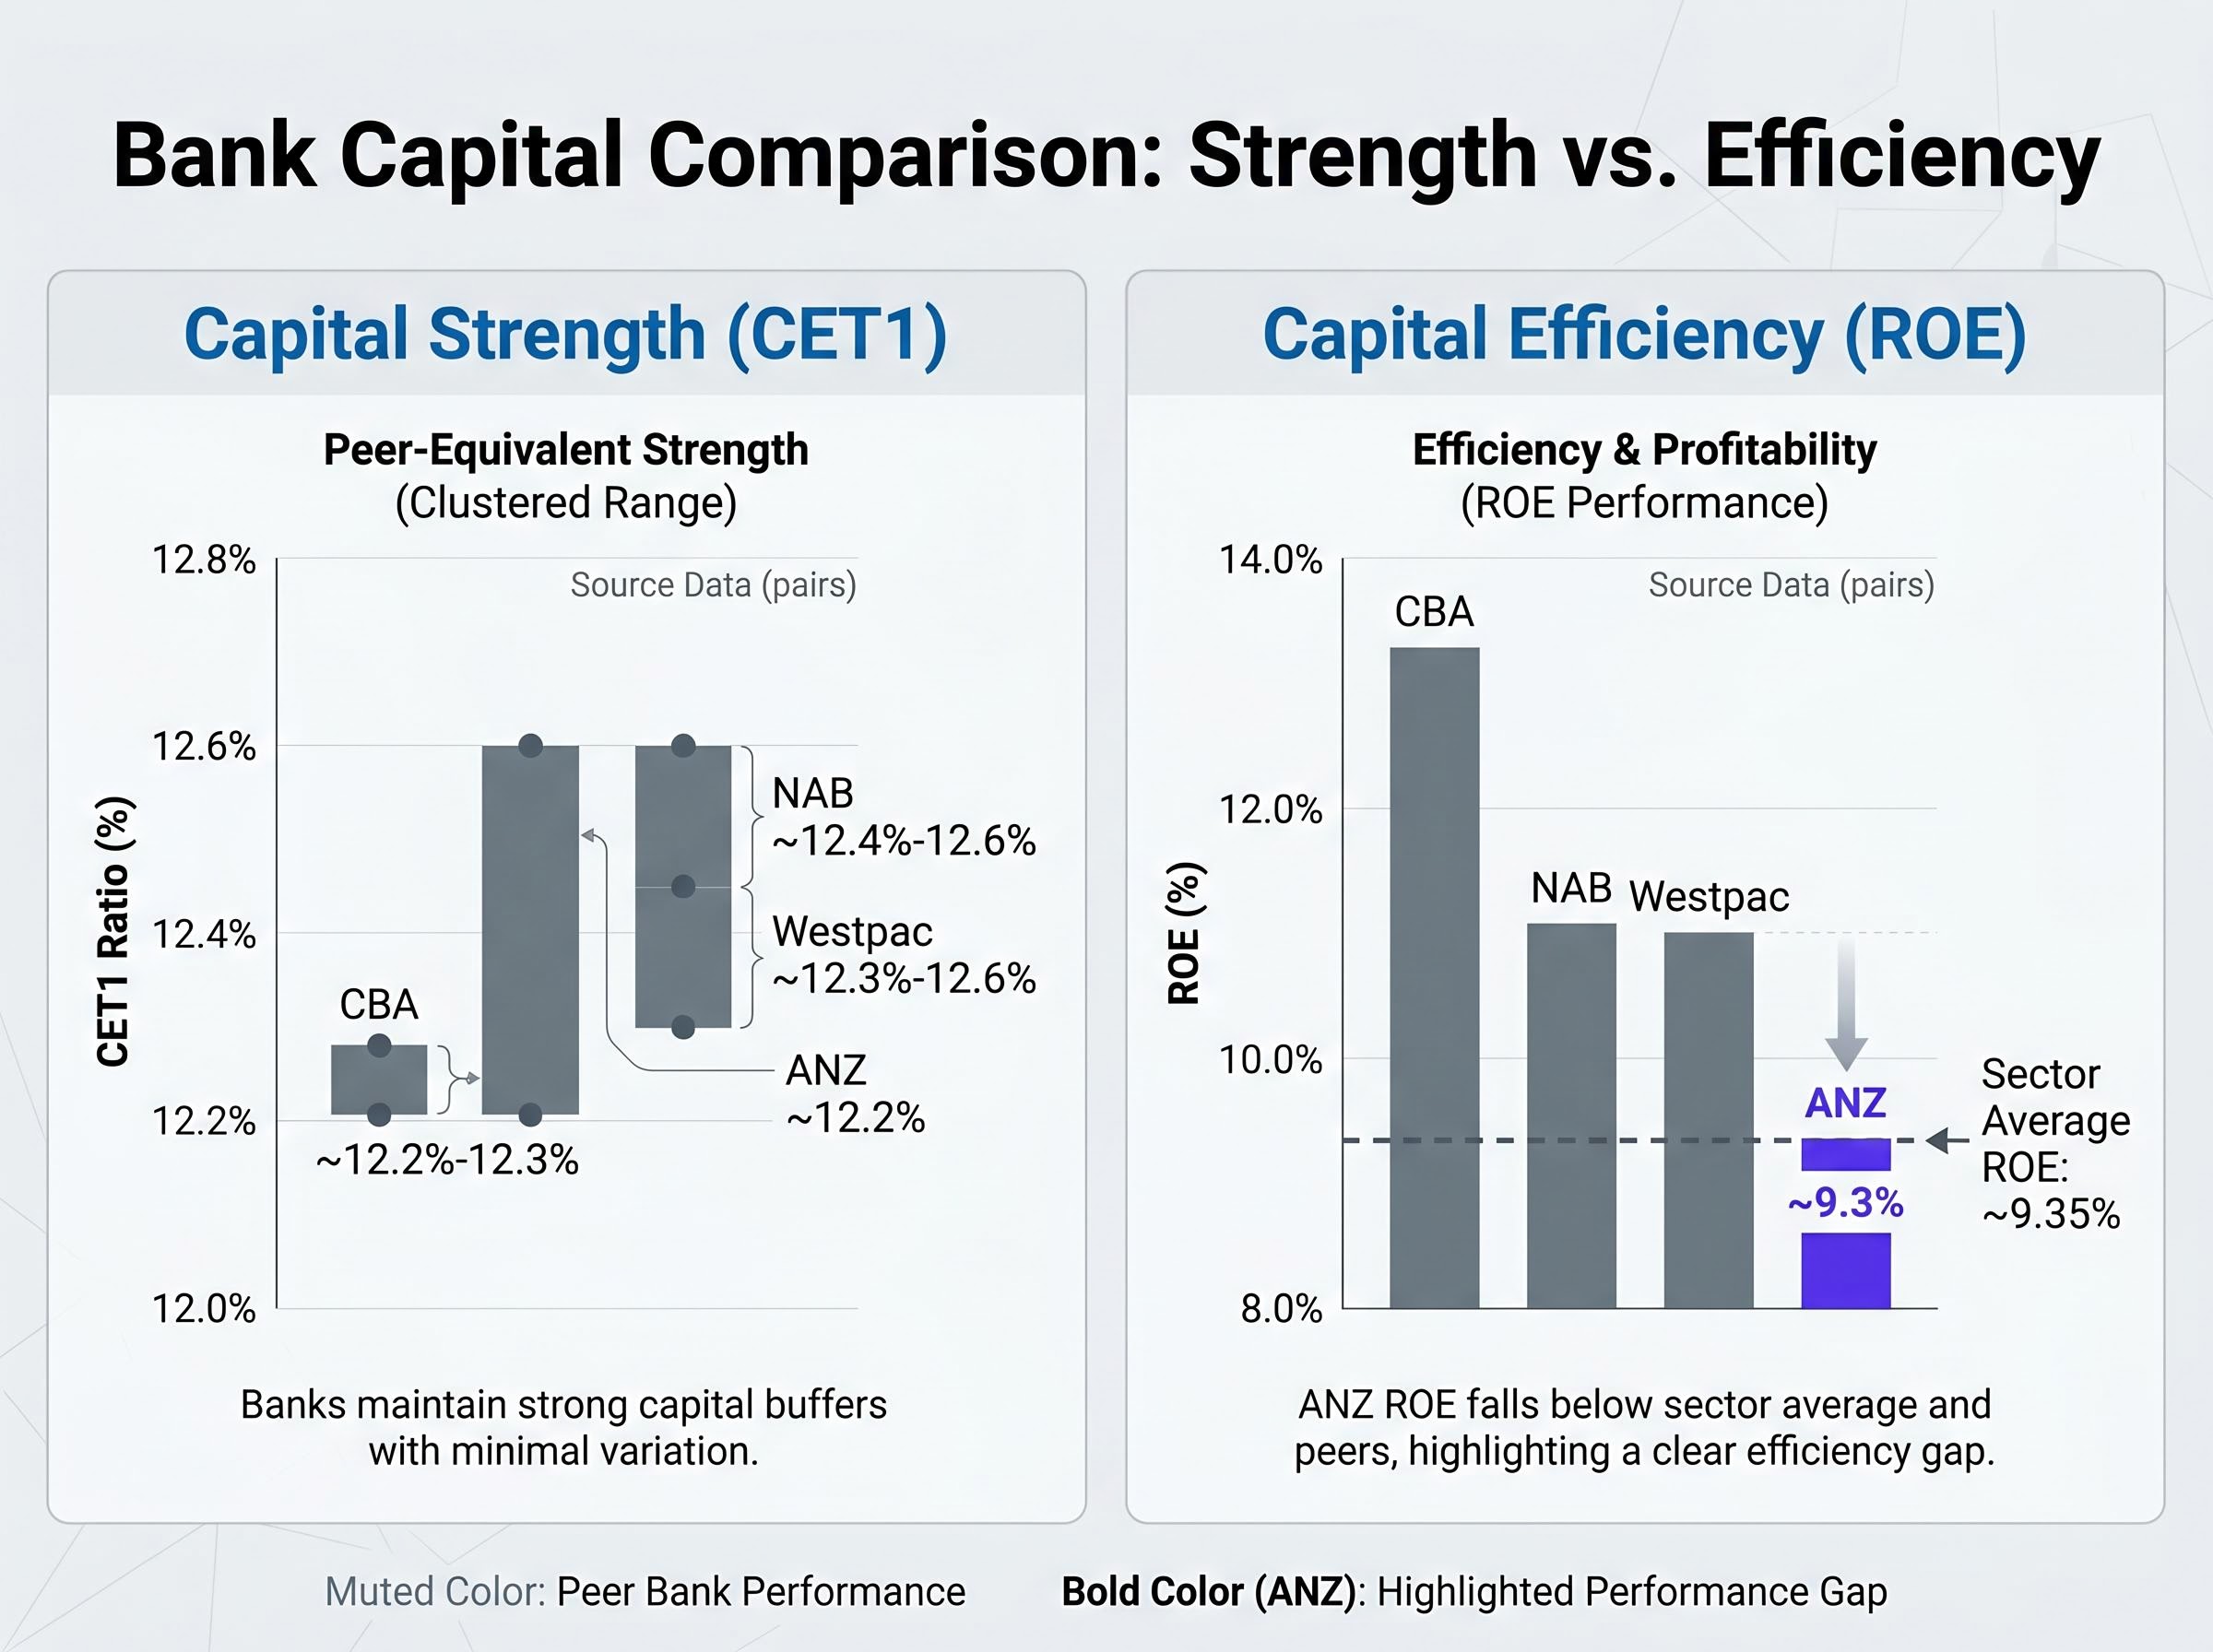
The table above makes the contrast visible in a single frame. ANZ matches peers on the capital column and trails on the return column. A bank with strong capital but weak ROE is absorbing capital it cannot deploy at the same rate of return as higher-ROE peers. Capital adequacy matters for dividend sustainability and downside resilience, both relevant considerations for income-oriented Australian investors. It does not, however, compensate for lower returns on that capital.
ANZ’s capital strategy messaging has emphasised conservative balance sheet management and preserving capital for regulatory resilience, with no signalled move toward a large special buyback.
APRA’s “unquestionably strong” benchmark remains the operative standard for the major banks, with no material reset to CET1 requirements confirmed for 2025-2026. Proposed reforms to liquidity and capital requirements remain in process and should be monitored via APRA’s published prudential standards and consultation papers. A CET1 ratio above 12% is generally interpreted as comfortably strong for the majors.
APRA’s unquestionably strong capital framework established CET1 ratio benchmarks requiring major banks to operate above 10.5% on average, with the expectation that major banks would hold ratios above 11% from 2023 onward, making the current 12%+ readings across all four majors a reflection of deliberate buffers above the regulatory floor rather than just compliance minimums.
Bringing the three metrics together produces a clear profile:
Valuation anchor: ANZ’s DDM-based fair value estimates sit at approximately $35.10 (historical dividend basis) and approximately $35.74 (forward dividend basis of $1.69 per share). The current share price of approximately $35.20 falls within this range, suggesting the market has broadly priced in the current profitability profile.
The investment case reduces to a trade-off. ANZ offers a credible dividend yield (FY2026 consensus DPS of approximately $1.60-$1.75, supported by a $1.66 full-year historical dividend) and a lower valuation multiple than CBA. It does not, however, offer near-term catalysts for ROE or NIM re-rating to peer levels. Analyst framing points to some cyclical room for NIM improvement as rate and deposit conditions normalise, but full convergence to CBA-like margins is not the market base case.
The structural versus cyclical distinction is where the investment thesis sharpens.
Structural factors (harder to remediate):
Cyclical factors (more amenable to improvement):
The Suncorp Bank integration represents a strategic variable that could affect ANZ’s retail deposit franchise and cost base over time, though verified integration progress data and disclosed synergy figures require confirmation from official ANZ investor relations materials.
On a qualitative note, ANZ’s workplace culture score of 3.3 out of 5 (Seek data, most recently available as of May 2026) sits above the sector average of 3.1, a marginal positive though secondary to the financial metric gaps.
ANZ’s culture and capital signals offer a longer-horizon lens that the three-metric framework alone does not capture: with CEO Nuno Matos less than 12 months into the role, analysts at Morningstar forecast NIM recovery toward the mid-1.6% range by FY27 as Suncorp synergies begin to flow, suggesting the current profitability gap may be measured from a cyclical trough rather than a structural floor.
Research caveat: All specific financial metrics in this analysis should be verified against official ANZ, CBA, NAB, and Westpac investor relations materials before making investment decisions.
The gap to CBA is structural, rooted in deposit franchise quality and business mix. The gap to NAB and Westpac is more mixed, partly cyclical and partly business-mix-driven, and therefore more amenable to narrowing. Whether that narrowing materialises depends on deliberate strategic action, not on passive rate cycle tailwinds alone.
The market has priced ANZ’s profitability profile with reasonable accuracy. CET1 is peer-equivalent. ROE and NIM are materially below peers. The current share price reflects a market that has absorbed this relative weakness without pricing in a re-rating.
For income-focused investors, ANZ remains a reasonable holding. Its dividend yield and lower valuation multiple relative to CBA provide compensation for the earnings quality gap. The question that defines the long-term thesis is whether ANZ’s strategic levers, expense discipline, balance-sheet optimisation, and potential deposit franchise improvements via the Suncorp integration, are sufficient to shift ROE and NIM meaningfully, or whether CBA’s structural advantage is durable enough to preserve its premium position indefinitely. That is the question each investor must answer with their own risk tolerance and time horizon.
CBA’s structural premium over peers is increasingly a function of P/E multiple expansion rather than earnings growth acceleration, with forward earnings forecasts of only 5-6% annually suggesting the premium requires the current 26x multiple to hold, a constraint that shapes how durable the ROE and NIM gap to ANZ actually is if CBA’s own margin of safety narrows.
This article is for informational purposes only and should not be considered financial advice. Investors should conduct their own research and consult with financial professionals before making investment decisions. Past performance does not guarantee future results. Financial projections are subject to market conditions and various risk factors.
Net interest margin (NIM) is the spread between what a bank earns on loans and what it pays on deposits and wholesale funding. For ANZ, lending income represents approximately 78% of total revenue, so even small NIM movements have an outsized impact on profit and shareholder returns.
ANZ's return on equity of approximately 9.3% is the lowest of the four major Australian banks, trailing CBA (13%+), NAB (approximately 11%), and Westpac (approximately 11%), meaning ANZ generates around $9.30 in annual profit for every $100 of shareholder equity compared to more than $13 at CBA.
ANZ holds a CET1 ratio of approximately 12.2%, which is broadly in line with CBA (12.2%-12.3%), Westpac (12.3%-12.6%), and NAB (12.4%-12.6%), placing all four major banks comfortably above APRA's regulatory minimums.
ANZ trades at a lower valuation multiple than CBA primarily because its NIM and ROE are materially weaker, reflecting structural disadvantages including a less effective retail deposit franchise and a business mix weighted toward lower-margin institutional and wholesale banking.
The Suncorp Bank integration is a strategic variable that could improve ANZ's retail deposit franchise and cost base over time, with analysts at Morningstar forecasting NIM recovery toward the mid-1.6% range by FY27 as synergies begin to flow, though investors should verify progress against official ANZ investor relations materials.