ANZ shares are trading near their DDM-estimated fair value of roughly $35.10, yet the numbers alone tell only half the story for investors planning to hold bank stocks for a decade or more. With CEO Nuno Matos less than a year into the role and the Suncorp integration still resolving, long-term investors face a distinct analytical challenge: how to evaluate a bank when the most important signals are not yet fully visible in the income statement. What follows is an examination of what employee culture scores and CET1 capital ratios reveal about ANZ’s long-term durability, how to source these metrics independently, and where they fit alongside traditional financial analysis for investors with 5-to-20-year horizons.
What the balance sheet misses for long-term bank investors
Most investors evaluating ANZ start with the same three metrics. Each tells a useful story, but none answers the question that matters most over a decade: is this bank getting structurally better, or does it just look cheap?
- P/E ratio: Approximately 18.25x, sitting within its historical range of 10-20x
- Net interest margin (NIM): Below all Big Four peers, making ANZ the margin laggard
- Return on equity (ROE): Approximately 9.5% on a forward basis, trailing CBA’s approximately 12.2%
The consensus 12-month price target of A$36.20 sits close to current trading levels of roughly A$35-37, suggesting the market sees limited near-term mispricing on traditional measures.
Yet a 9.5% ROE does not account for structural improvements still working through the system. For investors with 5-to-20-year holding periods, the analytical question is different from that faced by traders chasing a 12-month price target. Two signals, employee culture scores and the CET1 capital ratio, offer a window into where the bank is heading rather than where it has been.
When big ASX news breaks, our subscribers know first
How the CET1 ratio works as a bank’s capital buffer
The risk every bank investor intuitively understands is a downturn severe enough to threaten their dividend or, worse, their capital. The Common Equity Tier 1 (CET1) ratio measures how much of that risk a bank can absorb before either outcome materialises. Specifically, it is the proportion of a bank’s risk-weighted assets covered by its highest-quality capital: common equity.
APRA’s “Unquestionably Strong” benchmark stands at approximately 10.5%. Banks holding CET1 comfortably above this level demonstrate surplus capital available for dividends, buybacks, and absorbing unexpected losses.
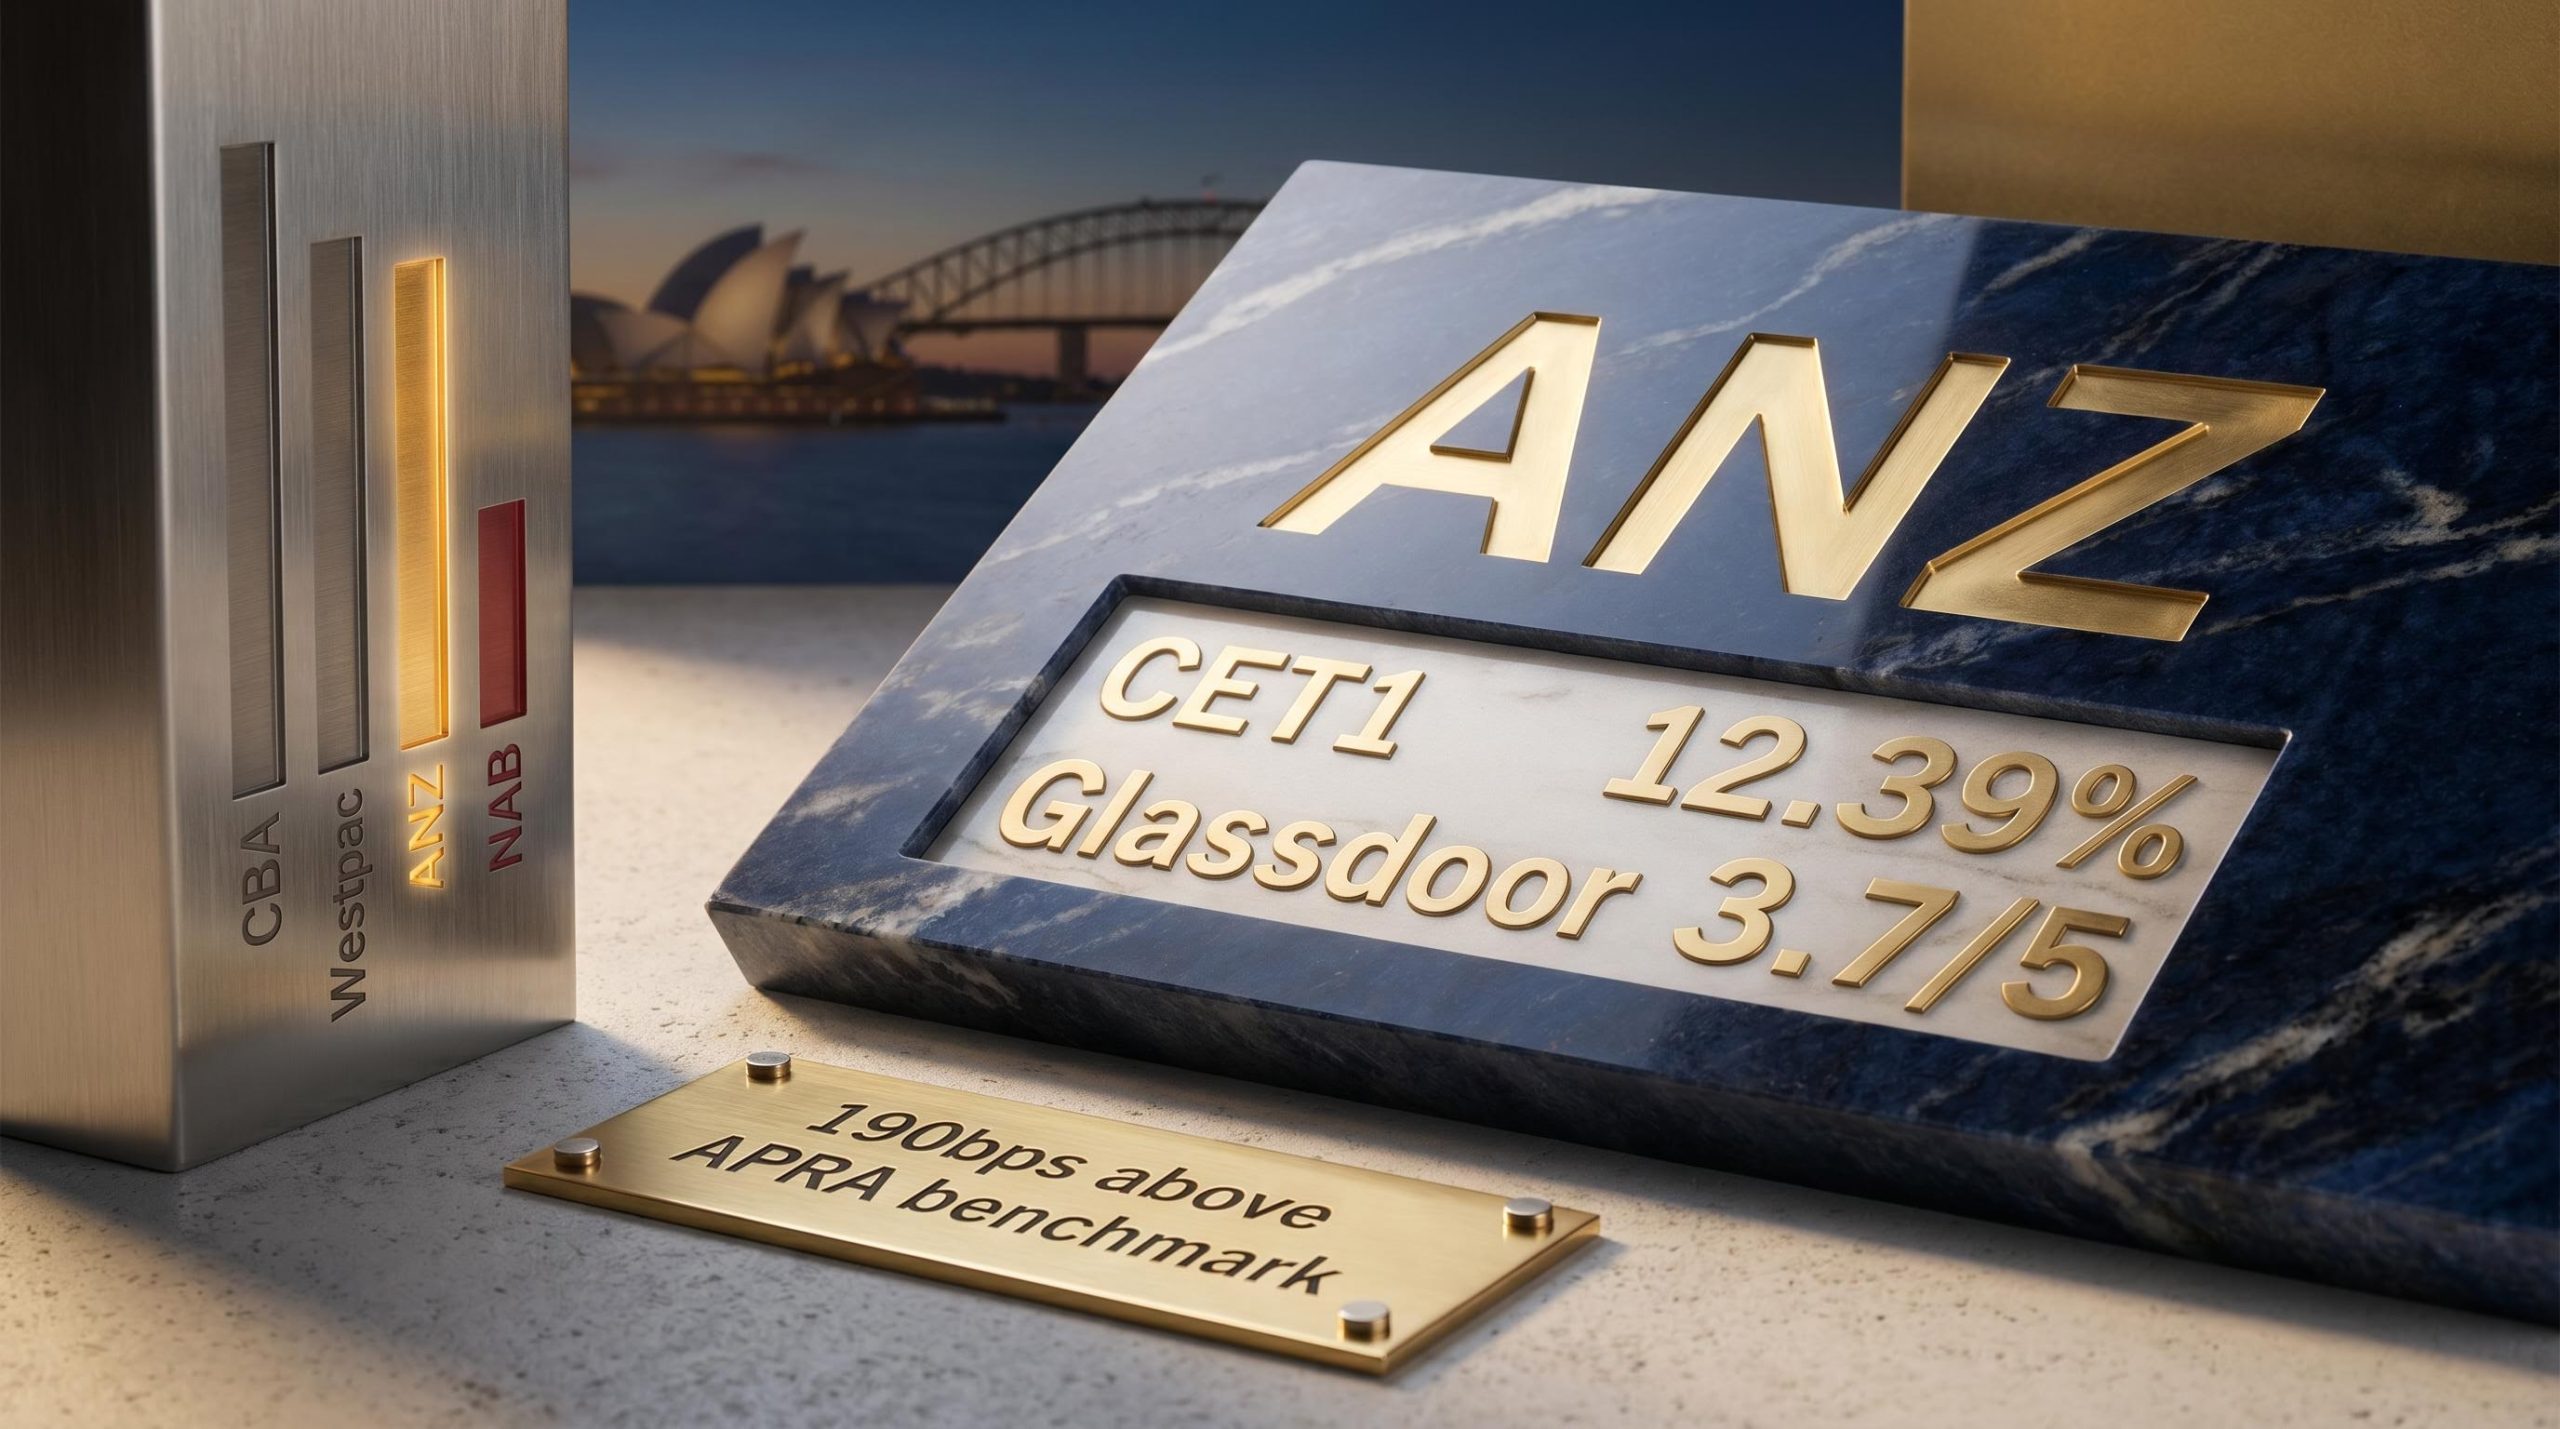
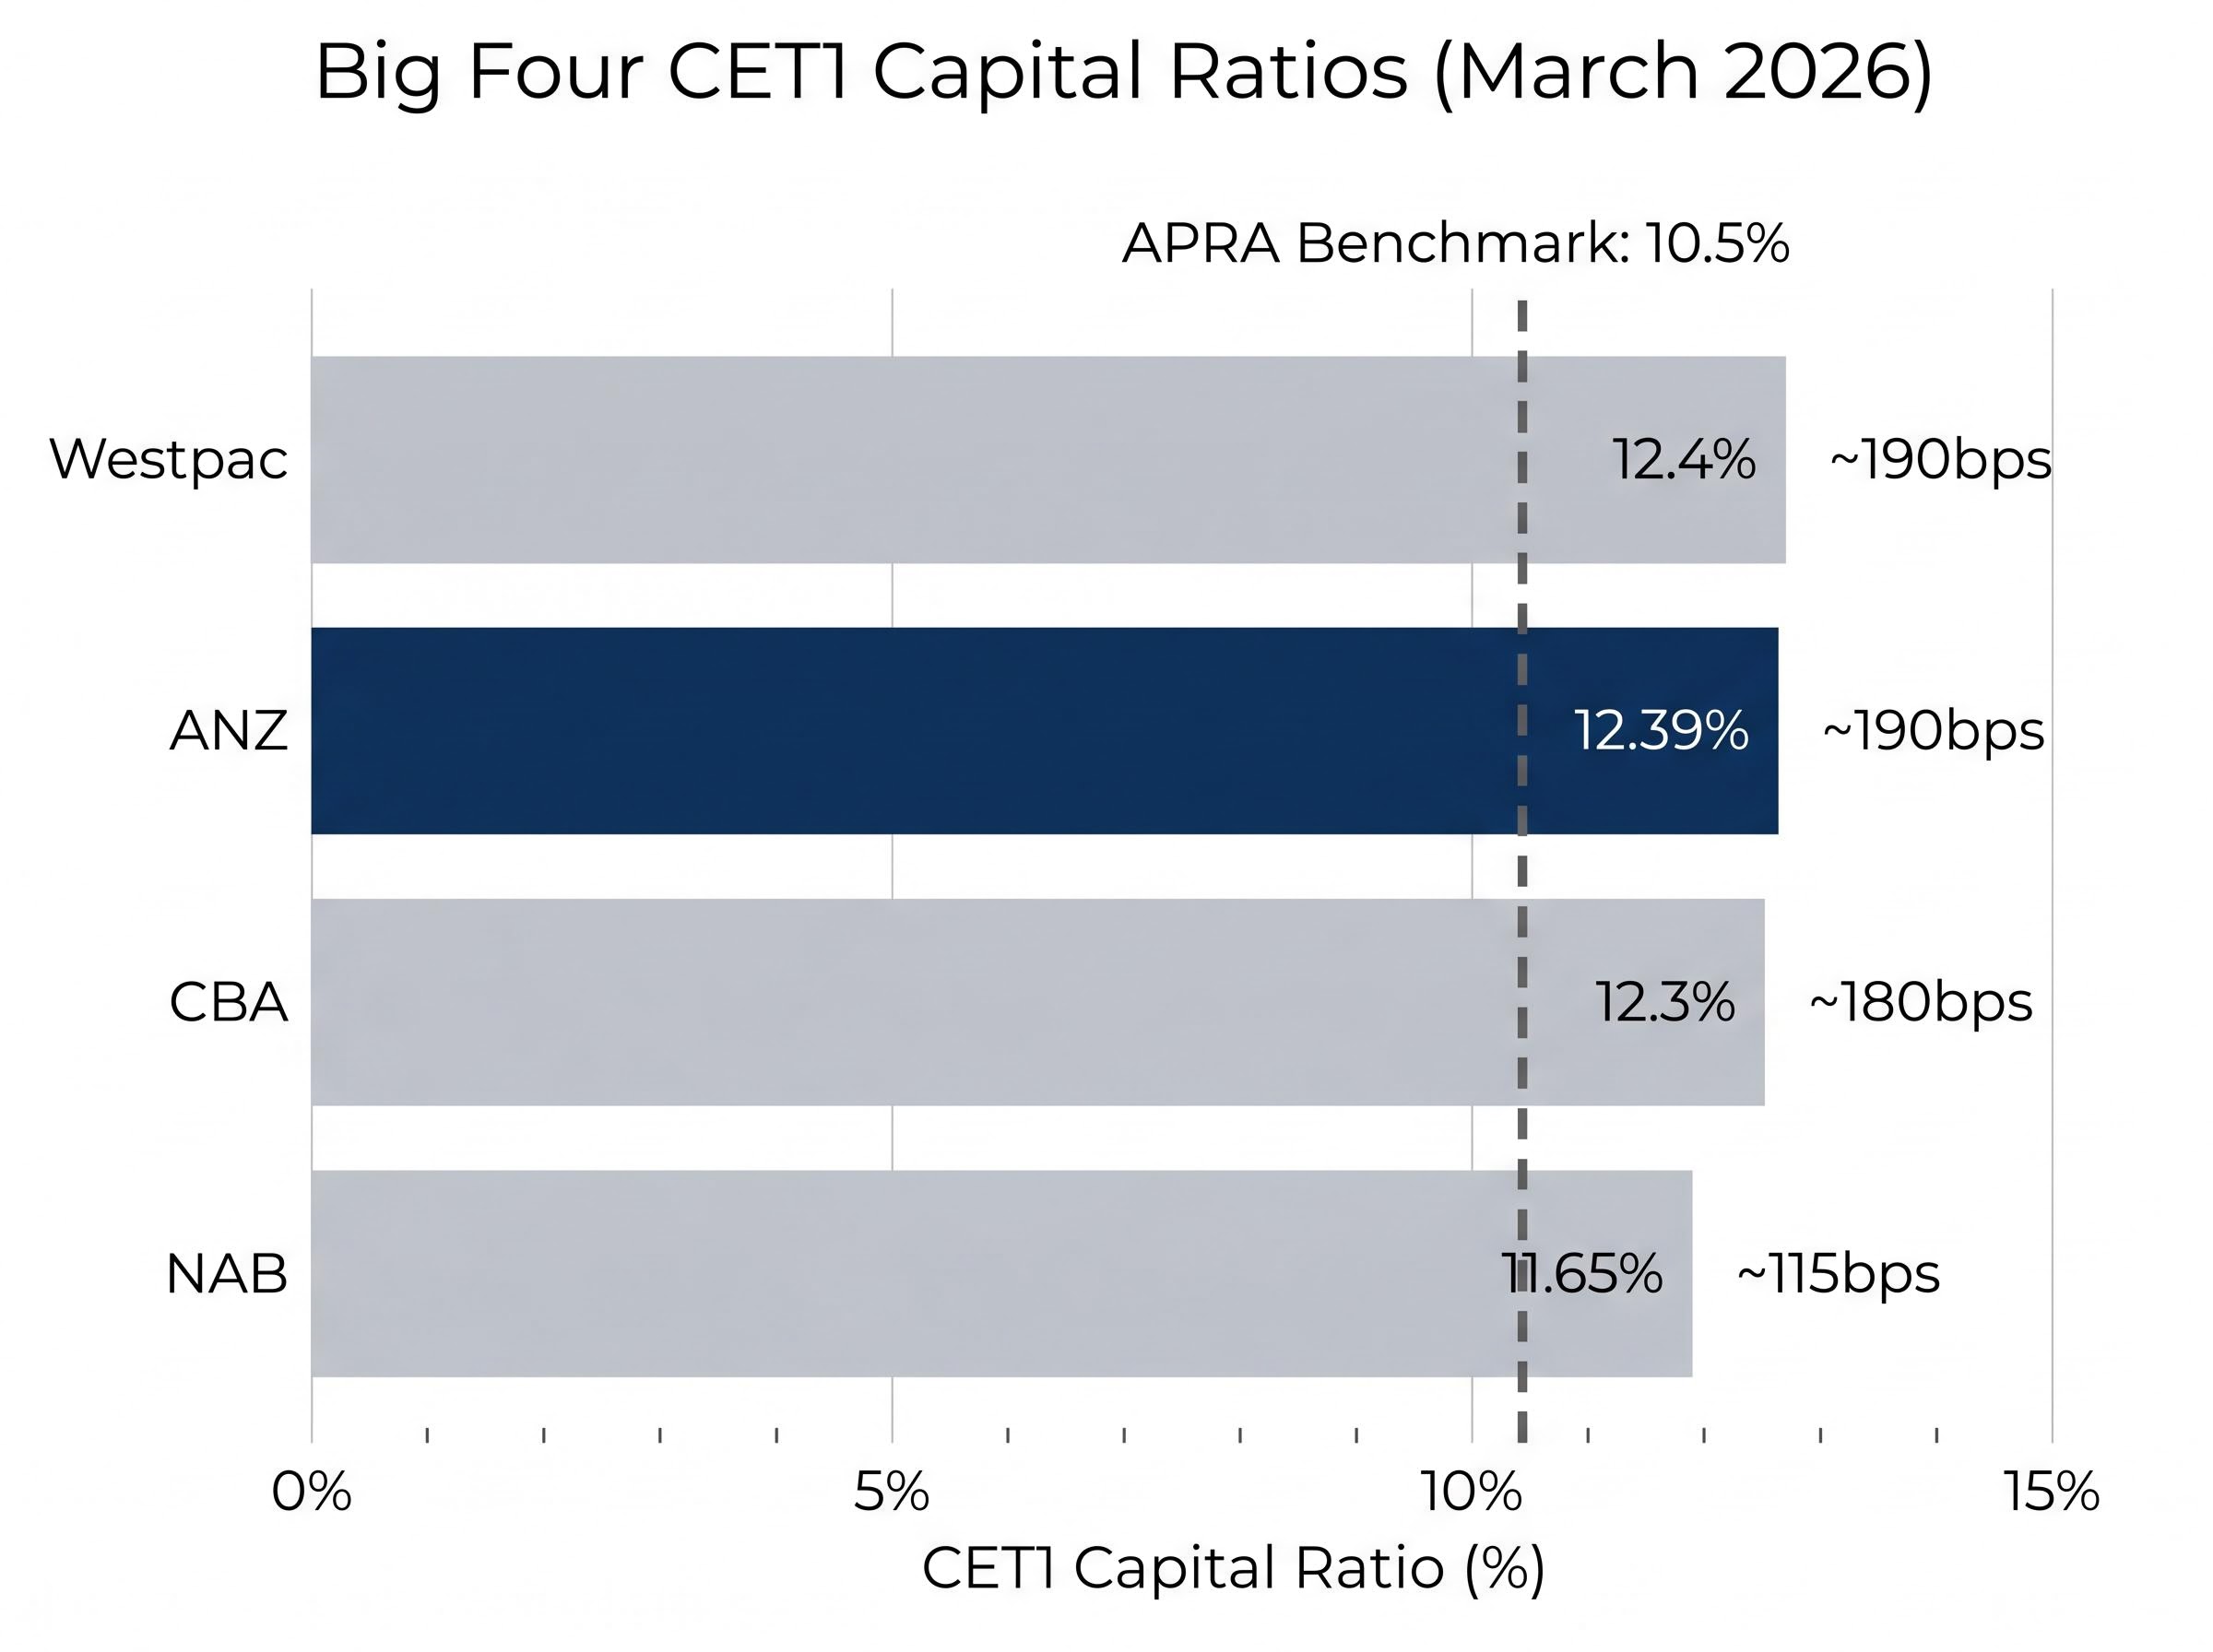
ANZ’s CET1 of 12.39% as at March 2026 represents approximately 190 basis points of surplus above that regulatory floor. In practical terms, this buffer means the bank could absorb material credit losses before its capital position approached the minimum threshold.
| Bank | CET1 Ratio | Buffer Above 10.5% Benchmark |
|---|---|---|
| Westpac | 12.4% | ~190bps |
| ANZ | 12.39% | ~190bps |
| CBA | 12.3% | ~180bps |
| NAB | 11.65% | ~115bps |
For many long-term Australian investors, particularly SMSF holders, the franked dividend stream is a primary reason to hold bank stocks. ANZ’s interim dividend of 83 cents per share, partially franked at 75%, is supported by a historical payout ratio of approximately 68%. The 190bps CET1 surplus provides concrete, independently verifiable evidence that the dividend has room to absorb stress. APRA has flagged commercial real estate exposure as a sector-wide risk requiring ongoing vigilance, but ANZ’s capital position places it among the best-buffered of the Big Four to manage that risk.
Rising sector-wide provisions are the risk that sits beneath the capital buffer discussion: Morgans forecasts total Big Four provisioning to climb from approximately $2.4 billion in FY25 to approximately $5.5 billion by FY27, a trajectory that tests every bank’s CET1 buffer and makes the 190bps surplus ANZ holds above the APRA benchmark a more consequential number than it might appear in a benign credit environment.
Reading culture ratings: what employee scores reveal about execution risk
Culture scores are among the few leading indicators that any investor can access for free, yet most retail investors do not systematically track them. The process for sourcing and interpreting this data takes minutes.
- Visit Seek or Glassdoor and search for the company by name.
- Filter by review volume to assess reliability. A rating based on several thousand reviews carries more statistical weight than one drawn from a few hundred.
- Compare the trend direction over 12-24 months rather than fixating on the absolute score. A bank moving from 3.3 to 3.7 under new leadership tells a different story from one stuck at 3.7 for five years.
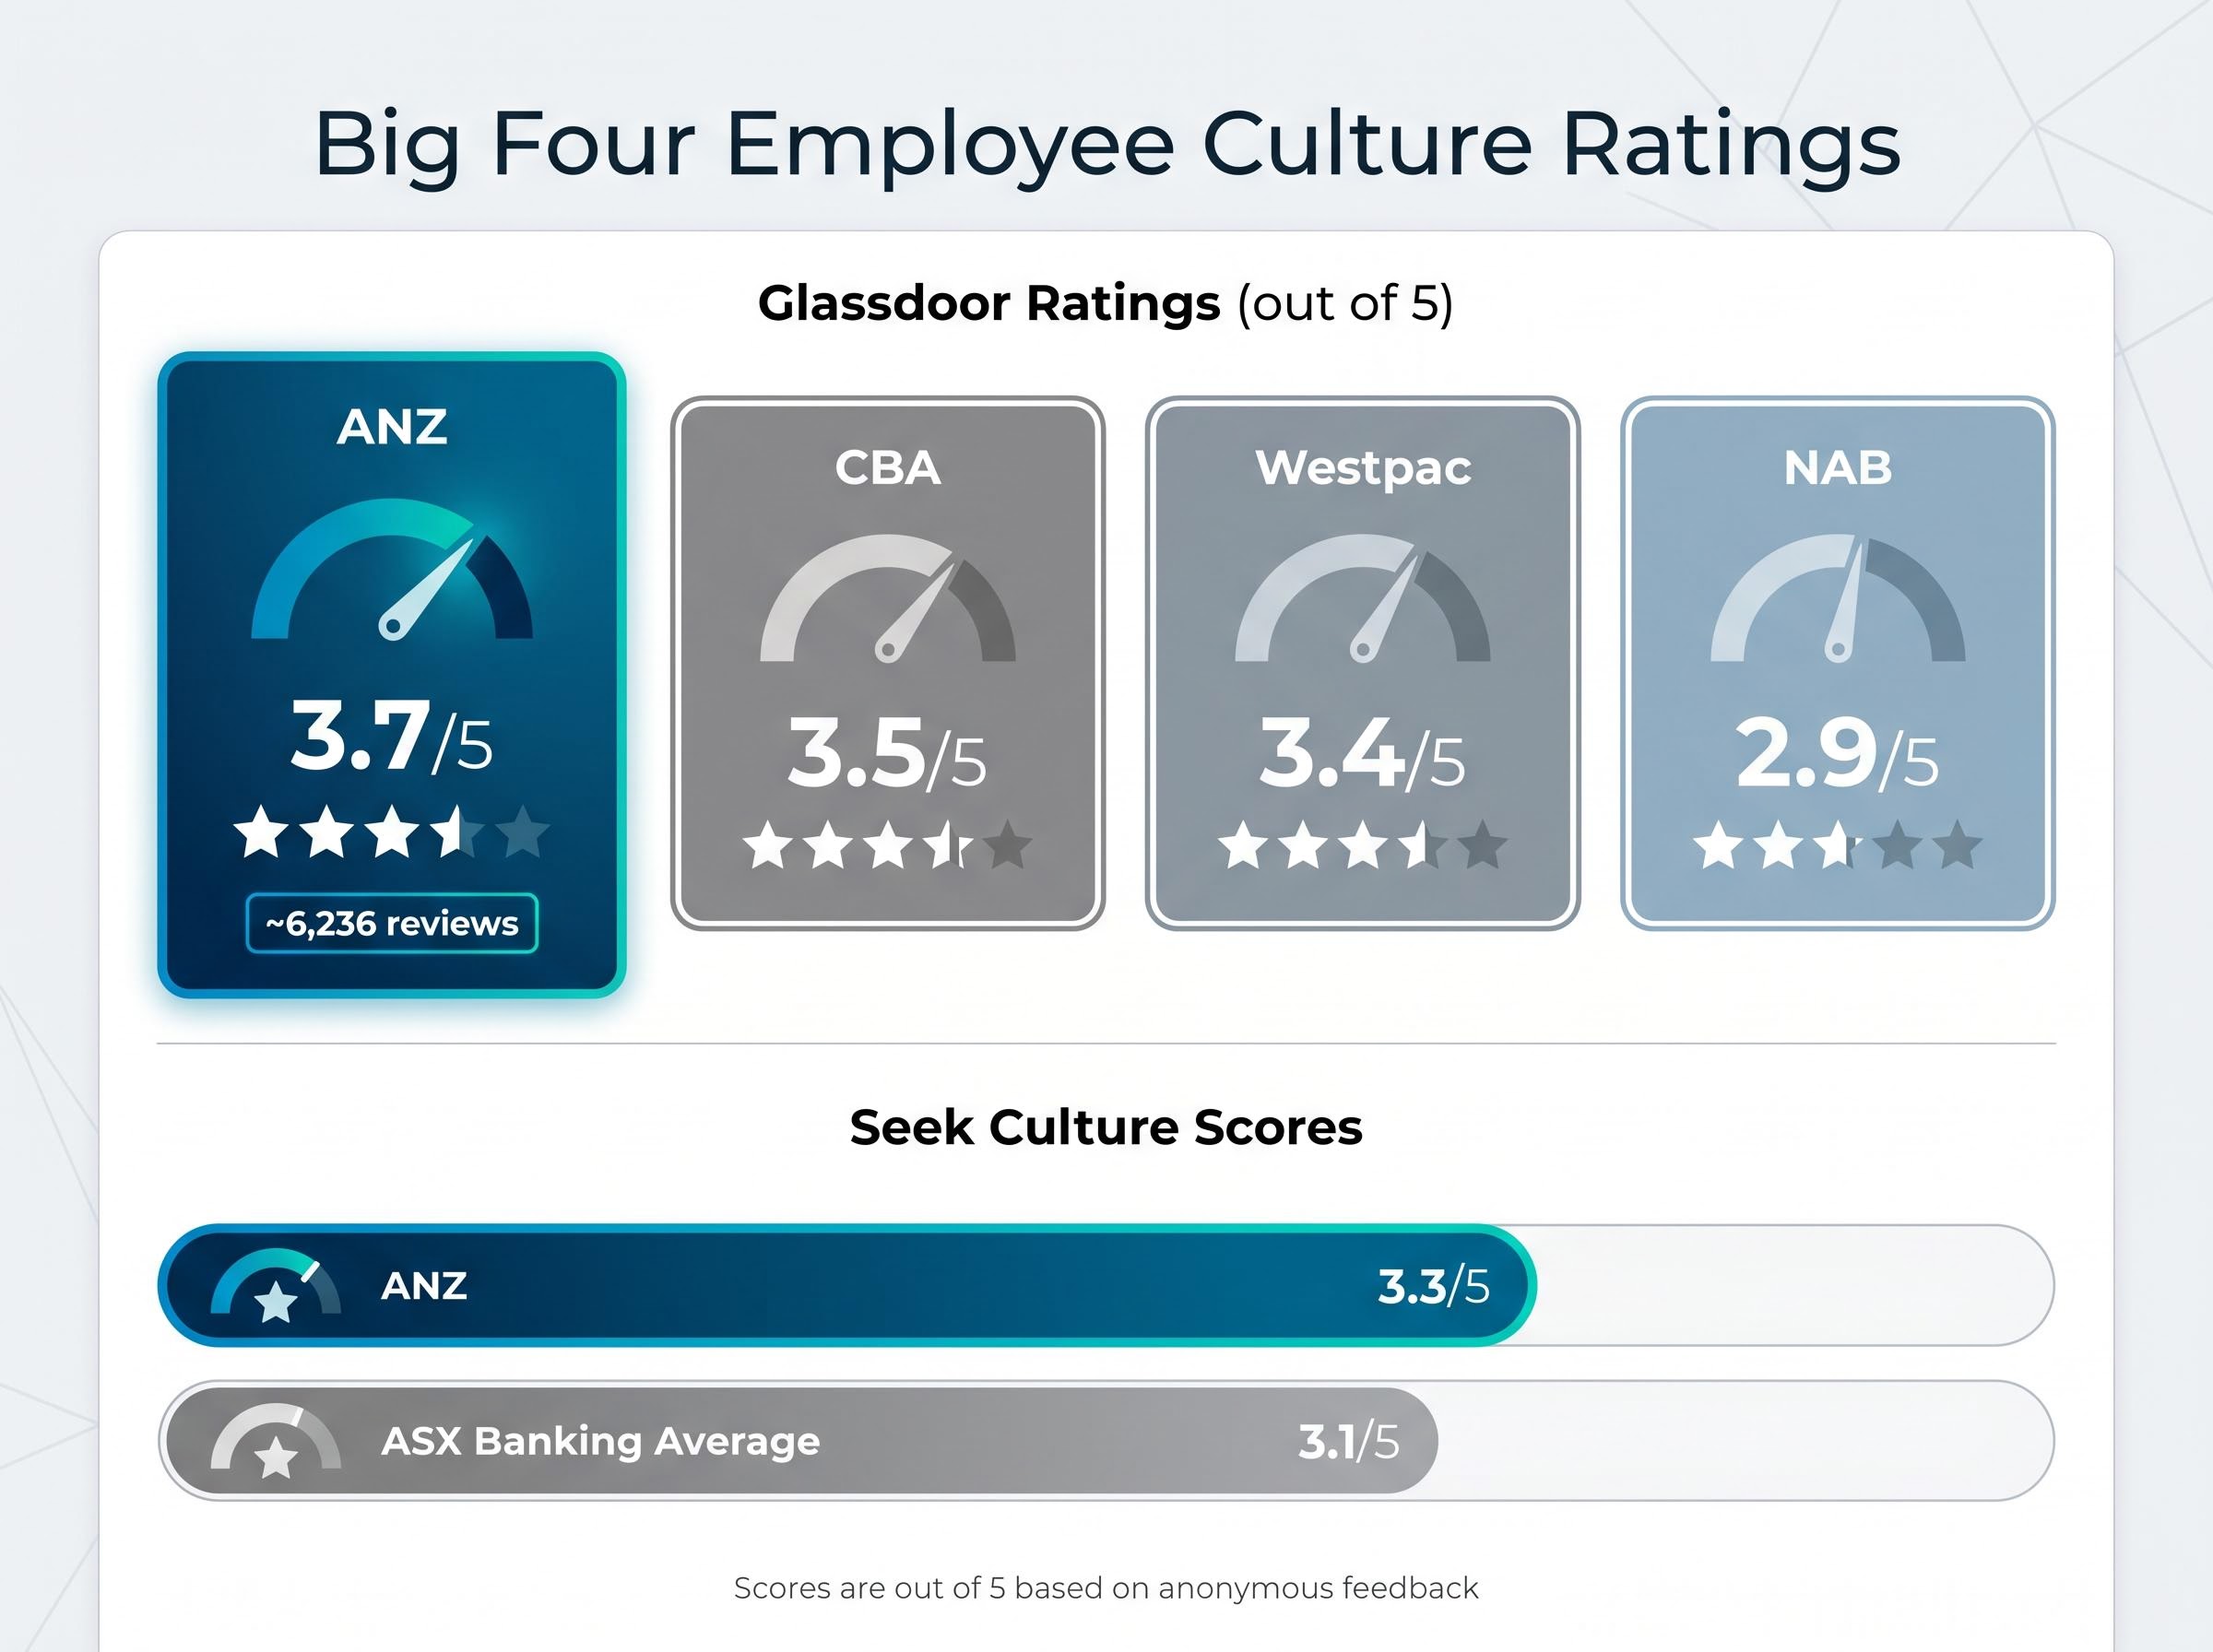
ANZ currently holds a Glassdoor rating of 3.7 out of 5 based on approximately 6,236 reviews. Seek platform data shows a culture score of 3.3 out of 5, above the ASX banking sector average of 3.1.
| Bank | Glassdoor Rating (Approx.) | Seek Culture Score (Approx.) |
|---|---|---|
| ANZ | 3.7/5 | 3.3/5 |
| CBA | 3.5/5 | N/A |
| Westpac | 3.4/5 | N/A |
| NAB | 2.9/5 | N/A |
Ratings are approximate and subject to revision as new reviews are submitted.
Why does this matter for a stock holding decision? High staff turnover and low engagement translate directly to higher operating costs, slower product delivery, and weaker customer retention, all of which pressure NIM and ROE over multi-year periods. Gallup’s engagement research consistently finds that top-quartile employee engagement firms demonstrate higher ROE and lower attrition costs over time. Bell Potter’s January 2026 note observed ANZ gaining retail market share through a technology and cultural reset under Matos, suggesting the culture improvement is beginning to show up in competitive positioning.
Gallup’s employee engagement meta-analysis links top-quartile workforce engagement to measurably higher productivity, lower turnover, and stronger profitability across thousands of business units, providing the empirical foundation for treating culture scores as financially material inputs rather than soft qualitative extras.
For long-term holders, a consistently improving culture rating under new leadership is one of the earliest observable signals that operational execution is gaining traction, often before it appears in earnings.
ANZ’s NIM and ROE gap: what the numbers can and cannot tell you
The financial shortfall is real and should not be minimised. ANZ is the NIM laggard among the Big Four, and its forward ROE of approximately 9.5% trails every major peer. Lending activity accounts for approximately 78% of total income, underscoring how central NIM recovery is to any earnings uplift.
| Bank | NIM (2026 Half-Year) | Forward ROE | CET1 Ratio |
|---|---|---|---|
| CBA | ~2.04% | ~12.2% | 12.3% |
| Westpac | ~1.89% | ~11.0% | 12.4% |
| NAB | ~1.81% | ~10.1% | 11.65% |
| ANZ | Below peers | ~9.5% | 12.39% |
The structural reasons for these gaps are identifiable. Deposit mix composition remains less favourable than CBA’s dominant franchise. Integration costs from the Suncorp acquisition are still flowing through. And Matos’s cultural transformation, which commenced in May 2025, is less than 12 months old.
Analyst views on recovery are split. Morningstar forecasts NIM recovery toward the mid-1.6% range by FY27 as Suncorp synergies materialise and deposit mix improves. JPMorgan takes a more cautious stance, flagging execution risk around that timeline.
UBS rated ANZ “Neutral” in April 2026, versus “Overweight” on CBA and Westpac. The rationale: strong capital buffers support buybacks, but slower earnings growth constrains near-term upside.
ANZ’s buy-skewed analyst consensus, the only such positioning among the Big Four as of April 2026, is built on a combination of post-Suncorp scale benefits and a dividend yield of approximately 4.5-5%, which sits at the more attractive end of the sector range precisely because the market has not yet priced in a full NIM recovery.
The qualitative signals from the previous two sections reframe this picture. A 190bps CET1 buffer means the balance sheet can absorb integration friction without threatening capital returns. An improving culture trajectory under new leadership suggests the execution gaps may narrow as operational efficiency builds. The NIM and ROE shortfall is where the bank has been; the CET1 and culture data point to where it may be heading.
Putting it together: how qualitative signals complement a long-term investment framework
Four signals, tracked together, give long-term investors a more complete picture than any single metric in isolation:
- CET1 ratio (floor check): Is the dividend safe? At 12.39%, ANZ holds approximately 190bps above the APRA benchmark.
- Culture score (directional signal): Is execution improving? A Glassdoor rating of 3.7 leads all Big Four peers.
- NIM (lagging profitability measure): Has margin improvement arrived? Not yet; ANZ remains the NIM laggard, with recovery contingent on Suncorp synergies from FY27.
- ROE (lagging return measure): Are returns closing the gap? At 9.5%, the gap to CBA remains wide, but it reflects the current state, not the trajectory.
CET1 and culture scores function as leading indicators: they signal balance sheet resilience and operational momentum before those qualities appear in the income statement. NIM and ROE are lagging indicators that confirm whether the improvement has arrived. SMSF adviser commentary has positioned ANZ as preferred over NAB for 5-to-10-year horizons when qualitative factors are incorporated, while CBA remains the consensus high-quality choice.
Compounding across long holding periods creates a mathematical asymmetry that makes the distinction between leading and lagging indicators especially consequential: the second decade of an investment generates nearly double the dollar gains of the first on the same initial capital, meaning an improvement in culture trajectory and capital efficiency that takes three years to show up in earnings can still be worth capturing if it compounds through a 15-year hold.
Matos commenced in May 2025, meaning the cultural transformation is less than 12 months old. Multi-year metrics are not yet reflected in results. The Suncorp synergy timeline of FY27 aligns with a medium-to-long holding period, offering patient investors a catalyst horizon that shorter-term holders may not wait for.
The case for and against weighting culture scores
A segment of retail investors, well-represented in forums and online commentary, argues that dividends and franking credits matter more than culture ratings. This view is not unreasonable: for income-focused portfolios, the franked yield is the primary return driver.
The counterargument, more common among advisers, is that culture scores are early-execution signals with compounding effects. Lower attrition reduces hiring costs. Higher engagement accelerates product delivery. Both feed through to operating efficiency and, eventually, to the NIM and ROE that drive sustainable dividends. Neither view is wrong. The question for each investor is how much weight they assign to leading versus lagging indicators over their specific holding period.
The signals worth watching as ANZ’s recovery unfolds
Rather than a verdict, what follows is a concrete monitoring checklist for investors who want to track the recovery thesis themselves:
- Half-year results (twice annually): Check NIM trajectory and CET1 ratio. The May 2026 half-year result is the most current data point; the next full-year result is the next major check-in.
- Annual culture rating review: Visit Seek and Glassdoor once a year and compare the trend direction over 12-24 months rather than reacting to a single quarter of reviews.
- Post-earnings analyst consensus check: Review whether sell-side ratings and NIM forecasts are converging or diverging after each earnings season.
- APRA QADIS (quarterly): APRA’s Quarterly ADI Statistics are freely available and track CET1 on an ongoing basis, providing the most frequent independent capital check.
The NIM recovery target from Morningstar, the mid-1.6% range by FY27, should be treated as a sell-side estimate rather than a guarantee. The CET1 monitoring benchmark remains APRA’s 10.5% floor plus the current approximately 190bps buffer.
Key risk reminder: APRA has flagged commercial real estate exposure as a sector-wide concern. CRE provisioning, NIM recovery execution, and CEO tenure at an early stage remain the primary risks for long-term holders to monitor.
This article is for informational purposes only and should not be considered financial advice. Investors should conduct their own research and consult with financial professionals before making investment decisions. Past performance does not guarantee future results. Financial projections referenced are subject to market conditions and various risk factors.
The long-term investor’s edge in bank stock selection
Most investors evaluate bank stocks on short-term financial metrics alone. Yet long-term durability, the quality that determines whether a bank compounds wealth over a decade, is better predicted by capital buffer adequacy and culture trajectory than by a single quarter’s NIM or a 12-month price target. ANZ is not the obvious high-quality choice among the Big Four; that remains CBA by most measures.
What ANZ offers is a stock where qualitative signals are doing meaningful analytical work that price screens alone cannot replicate. A CET1 of 12.39% (approximately 190bps above the APRA benchmark) and a Glassdoor culture rating of 3.7 (leading the Big Four) provide two independently verifiable data points that traditional valuation metrics miss. The consensus hold rating and A$36.20 price target reflect the market’s current reading; what they do not capture is whether the structural improvements underway will change that reading over time.
The sector-wide valuation tension visible across the Big Four in 2026, where price momentum has outpaced earnings growth for most names, helps explain why a consensus hold rating on ANZ at A$36.20 can coexist with qualitative signals pointing to improving fundamentals: the market is pricing relative value against a backdrop where even the best-capitalised banks are trading ahead of their medium-term earnings trajectory.
The framework is freely available to any investor willing to apply it. Check ANZ’s Seek and Glassdoor ratings. Download the most recent APRA QADIS for CET1 data. Revisit both alongside the next half-year result. The edge belongs to those who track the signals before they arrive in the earnings.