Cochlear Falls 63%: Generational Discount or Falling Knife?
1 hr ago

ANZ Group Holdings trades at roughly 16.5x earnings. The Australian banking sector average sits near 21x. That gap implies either the market is discounting ANZ for good reason, or a mispricing exists worth investigating. With ANZ shares currently around A$35.50 and the big four banks collectively accounting for approximately 30% of the ASX by market capitalisation, getting the valuation right matters not just to individual shareholders but to anyone holding a diversified Australian equities portfolio. The question of whether ANZ looks cheap relative to peers is actively debated among retail investors and in Australian financial media. What follows is a sector-adjusted price-to-earnings (PE) valuation and a Dividend Discount Model (DDM) analysis using ANZ’s actual FY24 figures, layered with the qualitative considerations that determine whether the numbers hold up. By the end, readers will have a structured framework for evaluating whether the apparent discount is an opportunity or a warning signal.
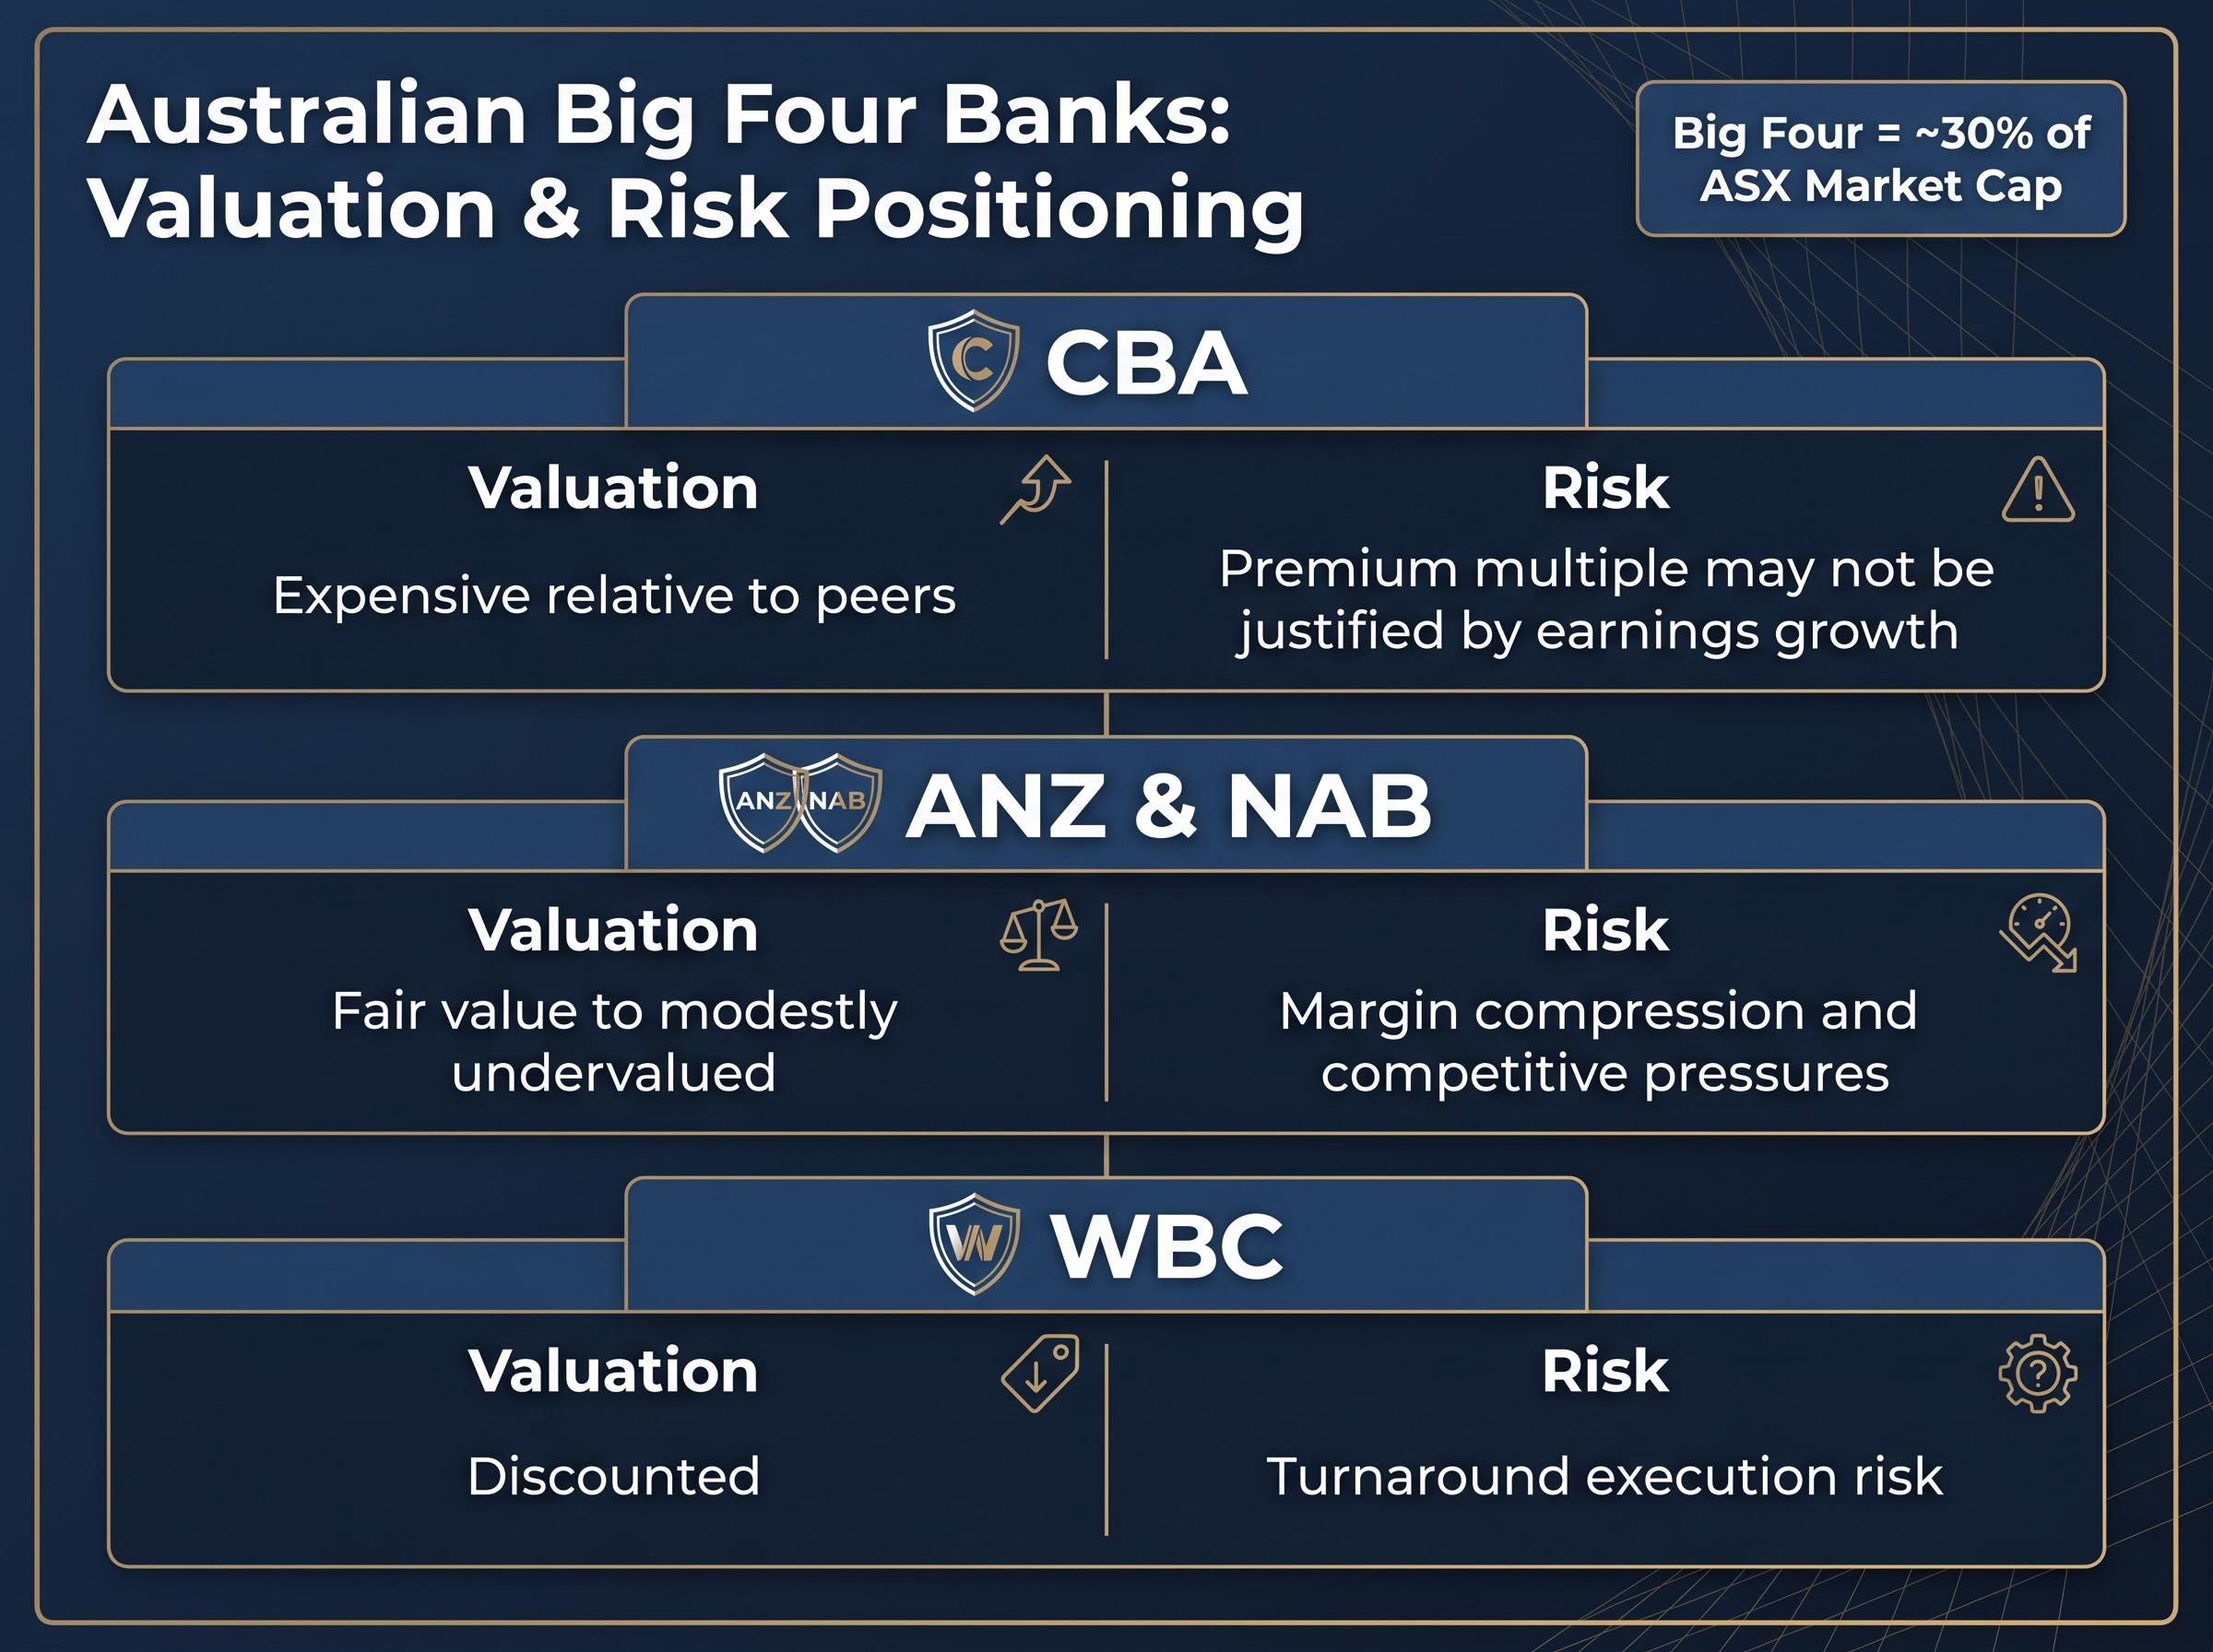
Before any valuation model can produce a meaningful number, the relative positioning of the stock needs to be clear. ANZ shares at approximately A$35.50 as of May 2026 sit in the middle tier of the big four, a group that collectively represents around 30% of ASX market capitalisation.
The broad characterisation across Australian financial commentary has been consistent:
| Bank | Valuation characterisation | Key risk framing |
|---|---|---|
| CBA | Expensive relative to peers | Premium multiple may not be justified by earnings growth |
| ANZ / NAB | Fair value to modestly undervalued | Margin compression and competitive pressures |
| WBC | Discounted | Turnaround execution risk |
Investors who skip this contextual layer risk misreading whether a low multiple reflects genuine value or a structural discount the market is consciously applying. That distinction shapes every calculation that follows.
Analyst consensus on ANZ versus peers as of April 2026 places ANZ as the only big four bank with a buy-skewed rating, a positioning that aligns with the valuation gap this analysis identifies, though the bullish price target of approximately $43 also implies the upside from current levels is modest rather than dramatic.
The PE ratio measures how much investors pay per dollar of annual profit. The formula is straightforward: share price divided by earnings per share (EPS). At a share price of A$35.50 and FY24 EPS of $2.15, ANZ’s PE sits at approximately 16.5x.
That number only becomes useful in context. For banks specifically, the PE ratio carries more weight than it does in high-growth sectors because banking earnings are relatively predictable, built on net interest income and fee streams that do not swing as violently as, say, technology revenue. This predictability makes the sector average PE a reasonable benchmark for comparison.
Two sector-average figures are worth noting. Earlier research placed the Australian banking sector average PE at approximately 18x, while more recent mid-2026 data from industry analysis sources including Simply Wall St puts the figure in the 21x range (21.2x to 21.4x). The difference reflects methodology, timing, and a period of multiple expansion across the sector. Both figures are useful, but investors should understand which baseline they are applying and why.
The PE ratio is a starting point, not a verdict. It should always be used alongside other methods, including DDM, to build a layered view.
The valuation methods for ASX bank stocks extend beyond PE and DDM to include price-to-book ratios and discounted cash flow approaches, each of which captures a different dimension of bank earnings quality; knowing when to apply each method is what separates a superficial screen from a complete analytical picture.
The sector-adjusted approach takes ANZ’s EPS and applies the industry-average multiple to produce an implied value. Using the 18x baseline:
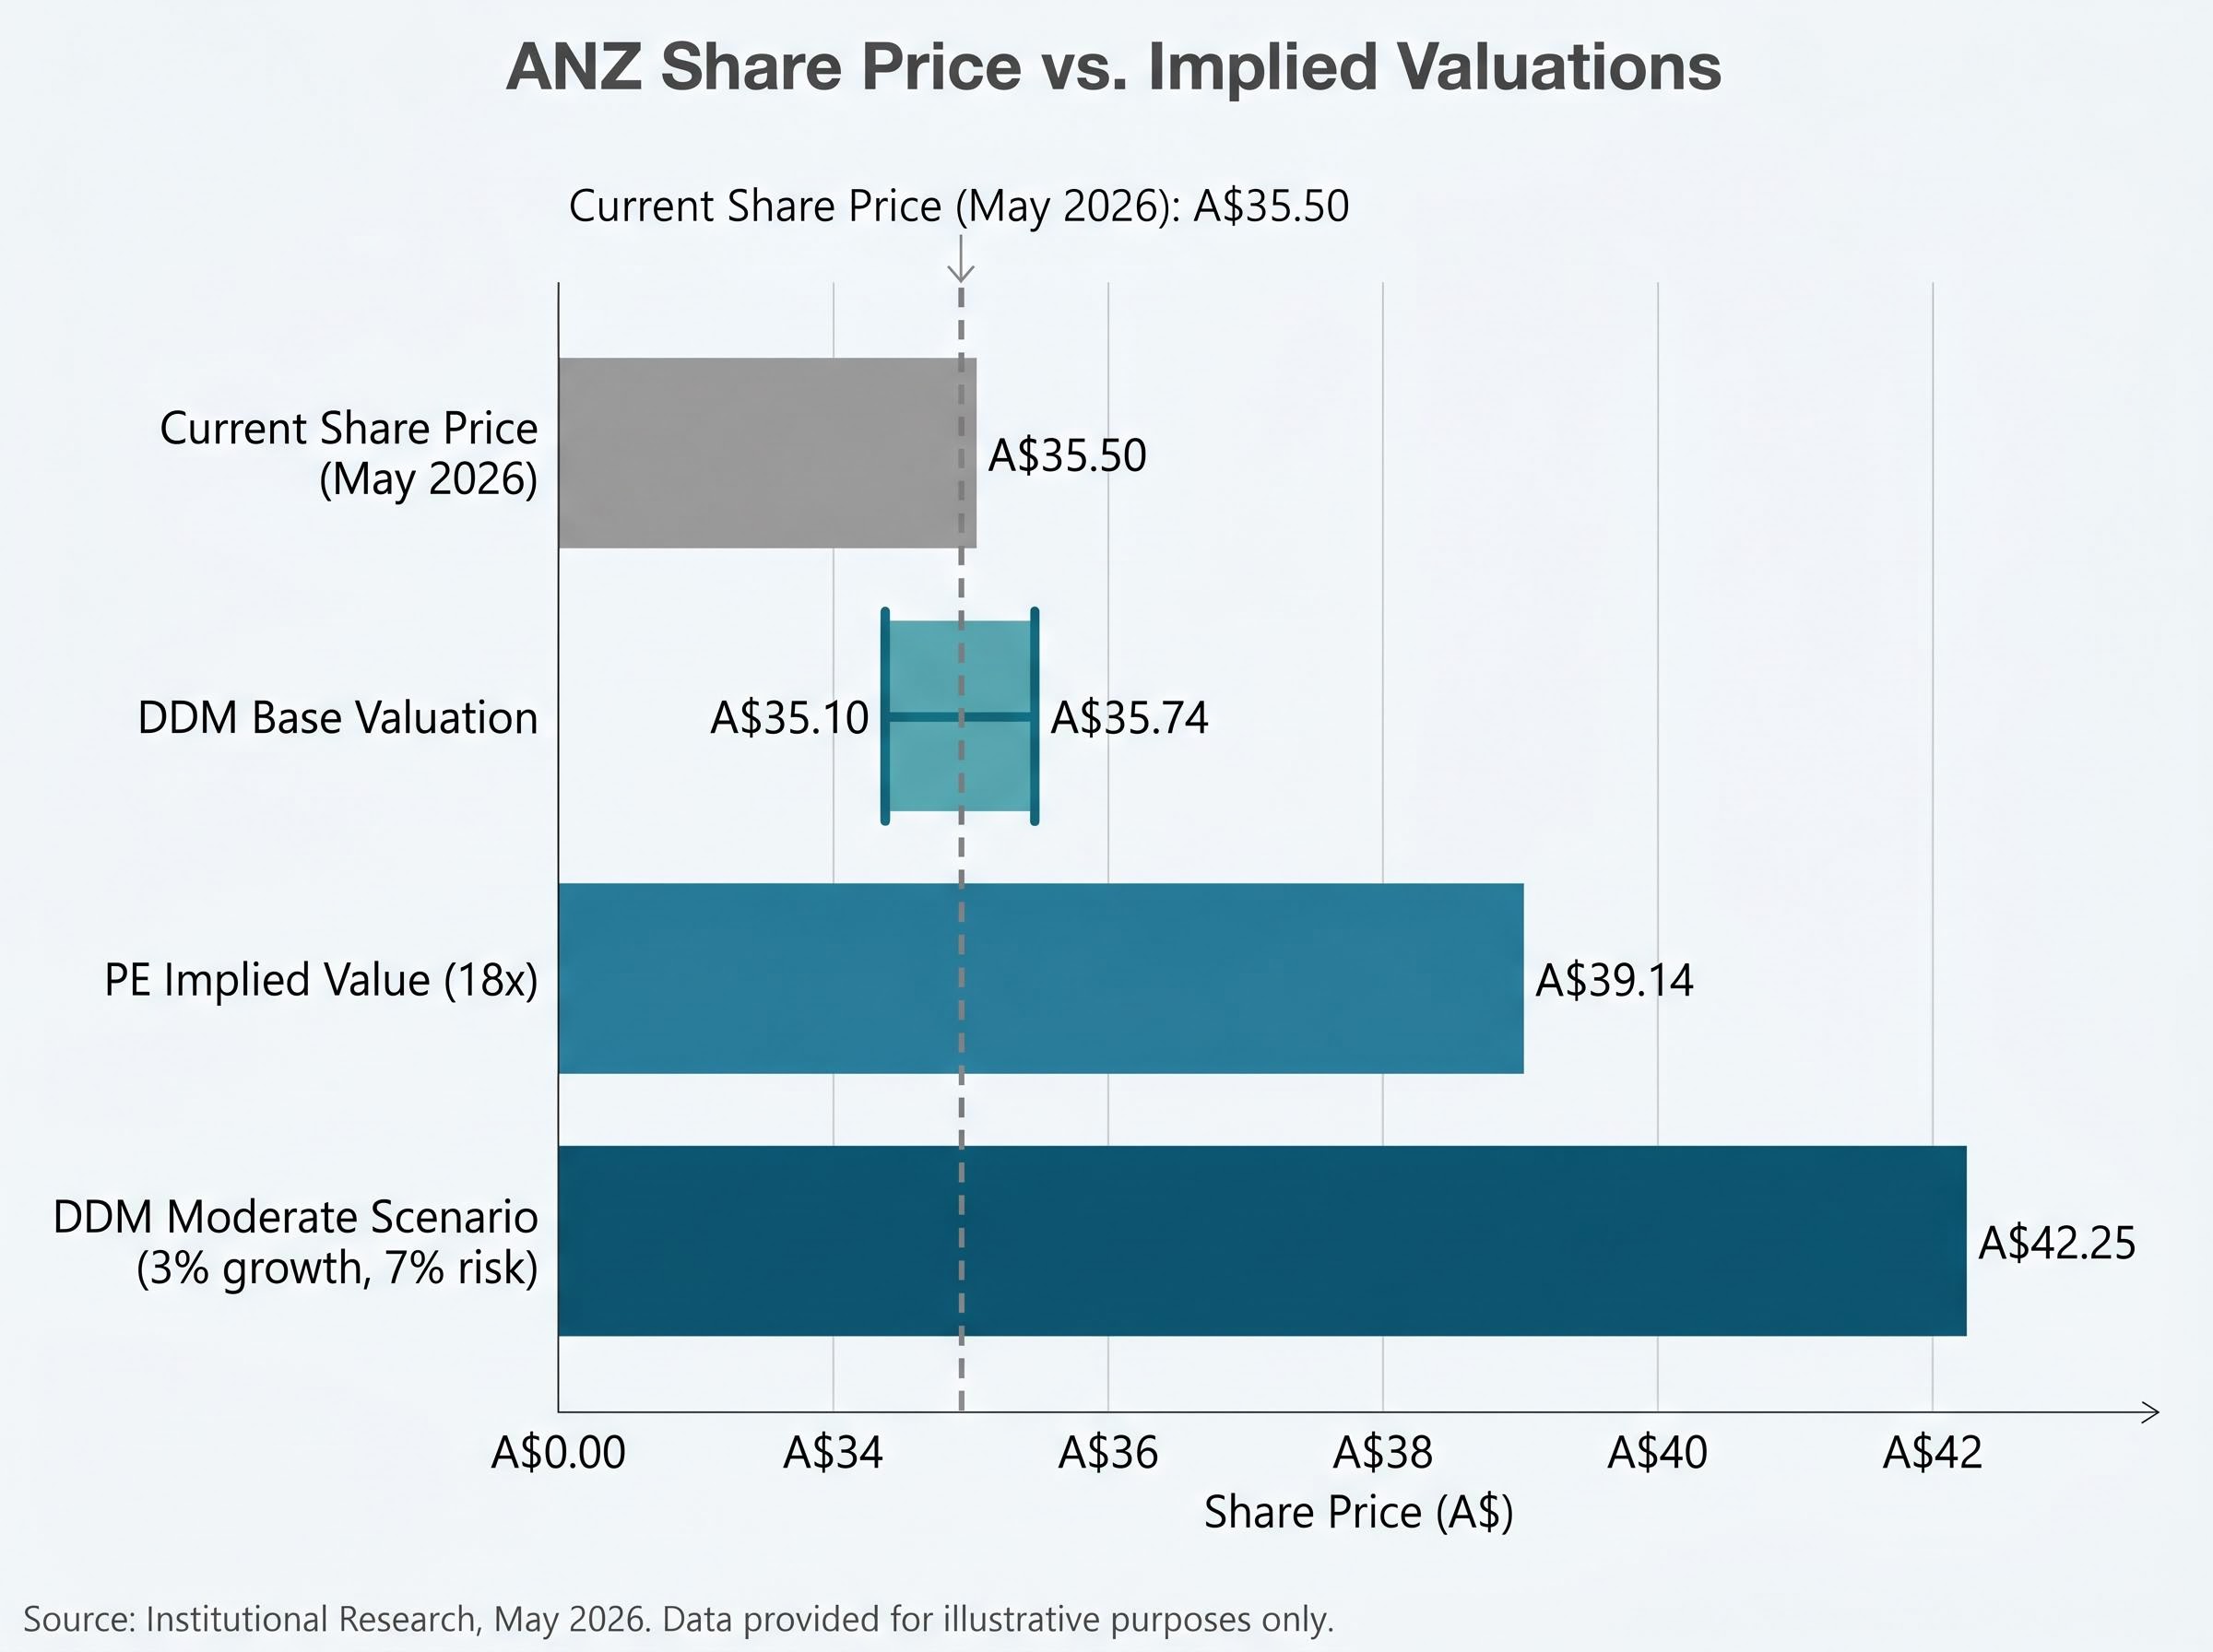
$2.15 EPS multiplied by the sector average PE of 18x produces an implied value of approximately $39.14 per share.
Against a current market price of A$35.50, that calculation surfaces an apparent discount of roughly $3.64 per share, or approximately 10%.
Using the more recent sector PE of approximately 21x would widen the implied discount further, producing an implied value above $45. However, that figure also reflects a more stretched sector average that investors should scrutinise carefully. A higher sector multiple does not automatically make ANZ cheaper; it may simply mean the broader sector has become more expensive.
The DDM values a stock based on the present value of its future dividend payments. For bank stocks with a history of relatively consistent distributions, it functions as a natural complement to the PE approach.
The formula: annual dividend divided by the difference between the required return rate and the expected dividend growth rate. ANZ’s last twelve months (LTM) base dividend per share is $1.66, with an adjusted figure of $1.69 used in secondary calculations.
At moderate assumptions, the DDM base valuation comes to approximately $35.10, with the adjusted figure at approximately $35.74. The current share price of A$35.50 sits almost exactly at the midpoint.
That alignment is itself a data point. It suggests the market is pricing ANZ roughly in line with its income-generating capacity under realistic conditions.
Where the DDM becomes most instructive is in revealing how sensitive the output is to small changes in assumptions. The table below shows how the implied value shifts across a range of growth and risk rate combinations.
| Dividend growth rate | Risk rate 6% | Risk rate 7% | Risk rate 8% | Risk rate 9% |
|---|---|---|---|---|
| 2% | $42.25 | $33.80 | $28.17 | $24.14 |
| 3% | $56.33 | $42.25 | $33.80 | $28.17 |
| 4% | $84.50 | $56.33 | $42.25 | $33.80 |
At 2% growth and a 9% risk rate, the output falls to $24.14, well below the current price. At 3% growth and 7% risk, it reaches $42.25, materially above A$35.50. The spread from the most conservative to the most optimistic combination is more than $60.
At moderate assumptions (3% growth, 7% risk), the DDM produces a valuation of $42.25, sitting materially above the current $35.50 price.
The lesson is not that one number is correct. It is that DDM outputs are only as reliable as the growth and discount rate assumptions behind them, and investors should run the model across a range rather than anchoring to a single scenario.
Numbers from both models rely on inputs that are themselves moving targets. Three qualitative dimensions deserve scrutiny before treating any implied price as reliable.
NIM trajectory and PE reliability are tightly linked: a PE multiple calculated on peak-cycle net interest margins embeds an earnings figure that may not be sustainable, meaning the multiple looks lower than it effectively is once the rate environment normalises and margin compression flows through to reported EPS.
For investors considering a holding period of 10 years or more, management decisions on capital allocation, culture, and strategic direction compound in ways that short-term earnings multiples cannot capture. The culture assessment result is one input among several. Over a decade, the quality of capital deployment decisions and the ability to retain talent tend to matter more to total returns than any single quarter’s NIM reading.
Any valuation analysis is incomplete without considering what the same capital could do elsewhere. For Australian retail investors, the structurally relevant comparison is VAS (Vanguard Australian Shares Index ETF, ASX:VAS), a low-cost, dividend-paying ETF covering the broad Australian sharemarket.
The trade-off is straightforward. ANZ offers franked dividend income and targeted bank exposure. VAS offers diversification, lower maintenance, and exposure to sectors beyond financials. Since banks represent approximately 30% of the ASX, VAS still carries meaningful bank exposure while spreading risk across the remainder of the market.
| Attribute | ANZ individual shares | VAS (ASX:VAS) |
|---|---|---|
| Income appeal | Franked dividends, higher yield concentration | Dividend income with broader base |
| Diversification | Single-sector concentration | Broad market exposure across sectors |
| Complexity | Requires ongoing company-level analysis | Low maintenance, set-and-forget |
| Suitable investor type | Income-focused, active participants | Long-term growth, passive investors |
Commentary from sources including The Motley Fool Australia and mainstream financial media has noted an observable shift in retail sentiment toward ETF adoption alongside traditional bank holdings. Neither option is universally superior. For income-focused investors, the franking credit advantage may tip the balance; for long-term growth investors, the diversification case for VAS may dominate.
For investors weighing whether to hold ANZ directly or redirect capital to a broad index product, our comprehensive walkthrough of ETF selection costs and hidden exposures covers total cost of ownership beyond the headline management expense ratio, including tracking difference, bid-ask spreads, and the concentration risk that arises when domestic equity ETFs already carry 25–30% bank weighting.
Both valuation methods produce implied figures above or near ANZ’s current market price under moderate assumptions. The PE analysis at an 18x sector multiple implies approximately $39.14. The DDM midpoint at moderate inputs sits at approximately $35.10 to $35.74, with a 3% growth and 7% risk scenario reaching $42.25. The current price of approximately $35.50 falls below the PE-implied figure and sits right at the DDM baseline.
The qualifications prevent a clean verdict. NIM pressure threatens the EPS input. DDM outputs swing dramatically with small assumption changes. Qualitative factors including regulatory constraints and management quality sit outside both models entirely.
The analytical process matters more than any single number:
Both models imply ANZ trades below a fair-value estimate under moderate assumptions, but the margin of safety depends heavily on whether earnings inputs remain stable.
The RBA Financial Stability Review published in April 2025 confirms that Australian banks hold capital well above regulatory minimums, a structural buffer that supports the earnings predictability underpinning sector-based PE comparisons and dividend growth assumptions in DDM analysis.
This article is for informational purposes only and should not be considered financial advice. Investors should conduct their own research and consult with financial professionals before making investment decisions. Past performance does not guarantee future results. Financial projections are subject to market conditions and various risk factors.
A sector-adjusted PE valuation takes a company's earnings per share and multiplies it by the average price-to-earnings multiple across its industry peers, producing an implied fair value that can be compared to the current share price. For ANZ, applying an 18x sector average PE to FY24 EPS of $2.15 produces an implied value of approximately $39.14 per share.
The Dividend Discount Model values a stock by dividing the annual dividend by the difference between the required return rate and the expected dividend growth rate. Using ANZ's base dividend of $1.66 per share at moderate assumptions of 3% growth and a 7% risk rate, the model produces an implied value of approximately $42.25 per share.
ANZ trades at approximately 16.5x earnings while the broader Australian banking sector average sits near 21x, with the gap reflecting factors including net interest margin compression, regulatory constraints on diversification, and the persistent premium applied to CBA that lifts the sector average. Whether that discount represents mispricing or a justified structural adjustment is the central question in any ANZ share analysis.
DDM outputs can swing dramatically with small input changes; for ANZ, the implied value ranges from $24.14 at 2% dividend growth and a 9% risk rate to $84.50 at 4% growth and a 6% risk rate, a spread of more than $60. This sensitivity means investors should run the model across a range of scenarios rather than anchoring to a single figure.
ANZ offers concentrated franked dividend income and direct bank exposure, while VAS (Vanguard Australian Shares Index ETF) provides broad market diversification with lower maintenance requirements, though VAS still carries roughly 25-30% bank sector weighting due to banks making up approximately 30% of the ASX. Income-focused investors may favour ANZ's franking credit advantage, while long-term growth investors may prefer the diversification that VAS provides.