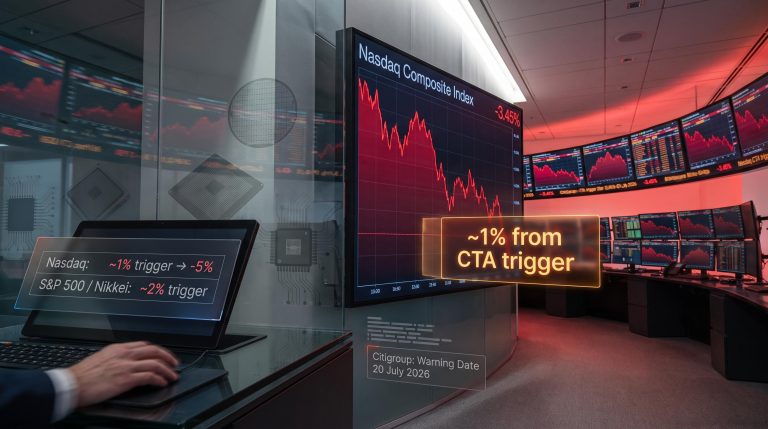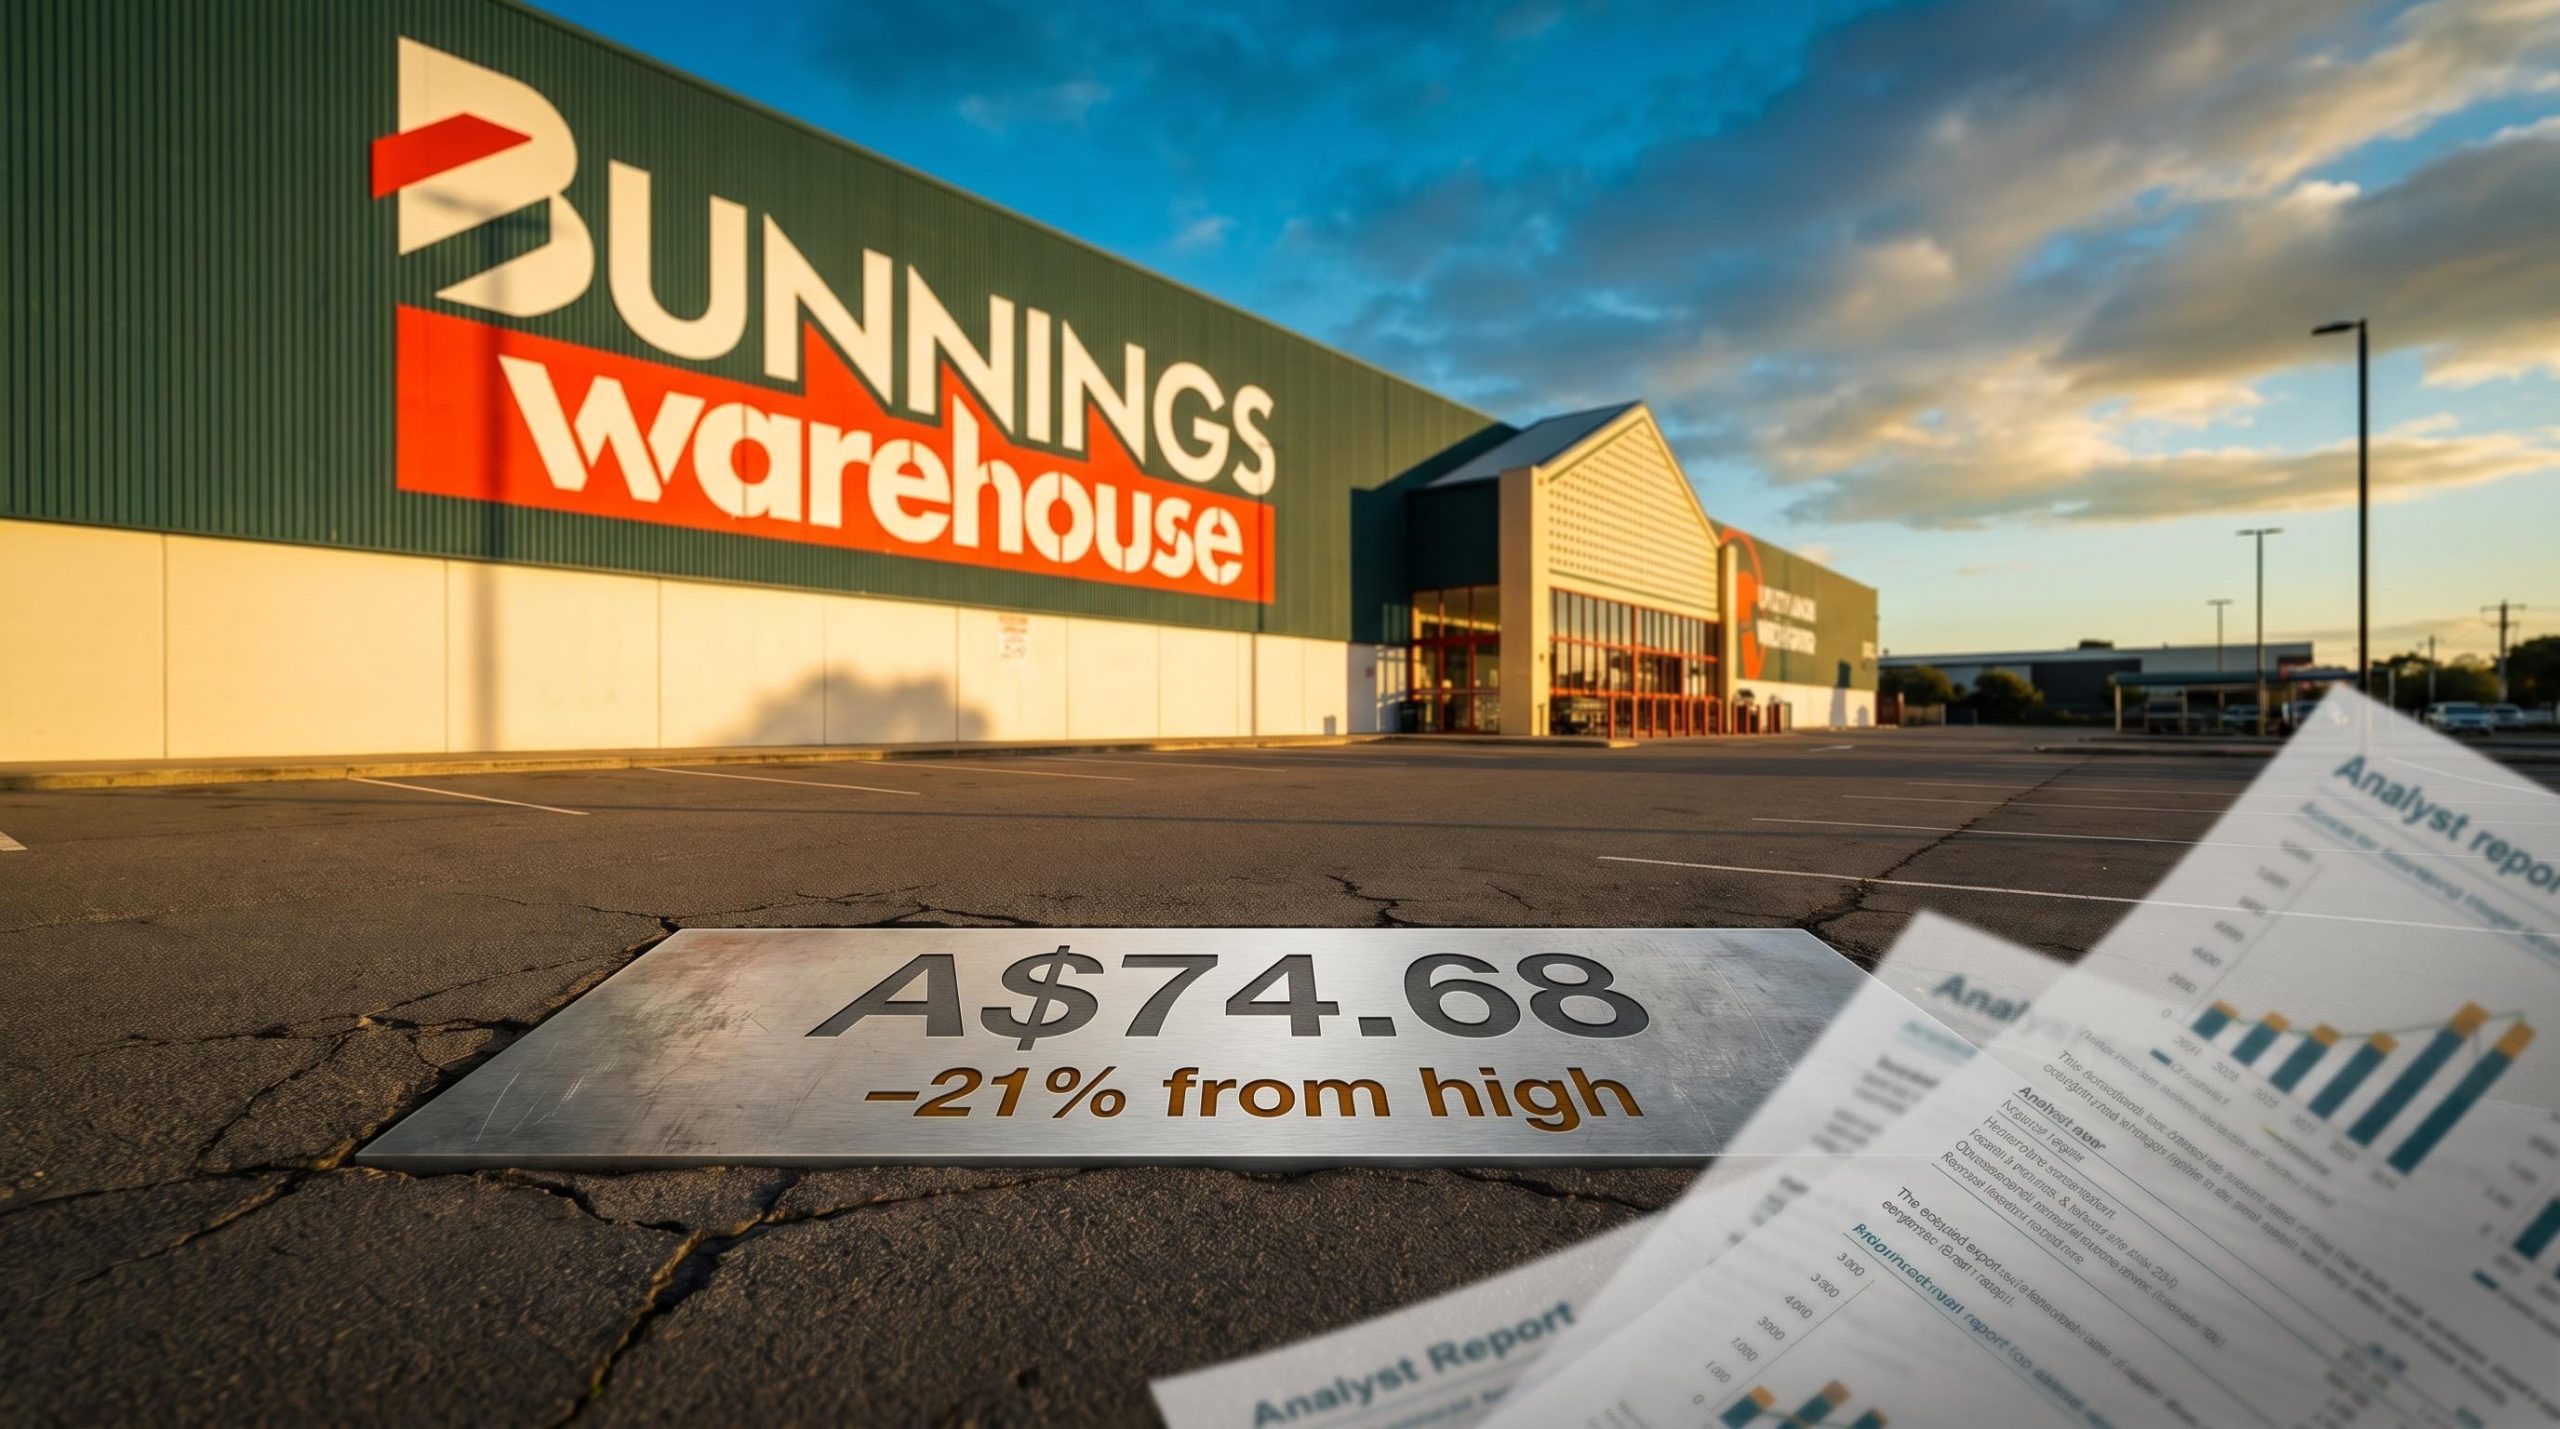
Wesfarmers closed at A$74.68 on 22 May 2026, sitting roughly 21% below its 52-week high. That gap has placed one of Australia’s most widely held blue-chip stocks back on the shopping list of fund managers and income investors alike. The pullback comes as Australian consumers remain under pressure from elevated interest rates and cost-of-living stress, raising a legitimate question: does the share price decline represent a genuine entry opportunity, or a warranted repricing of a business carrying elevated gearing and ambitious capital commitments in lithium and health? What follows is a structured walk through Wesfarmers’ business composition, its core financial metrics, what analysts currently make of the valuation, and where the real risks sit, giving income and value-focused ASX investors a current, data-grounded picture of the stock at this specific price point.
How Wesfarmers makes its money: the Bunnings-anchored conglomerate structure
Analysing Wesfarmers is, in large part, analysing Bunnings. The hardware and home improvement division contributes more than half of total group operating profit and anchors the conglomerate’s earnings, cash generation, and premium multiple. Wesfarmers acquired its initial Bunnings stake in 1987 and completed full ownership in 1994 for $594 million. Bunnings was subsequently recognised as Australia’s most trusted brand in both 2023 and 2024.
The remaining portfolio is best understood as a deliberate diversification strategy rather than a loose collection of assets:
- Bunnings: Hardware, home improvement, and building supplies (consumer and trade).
- Kmart Group (including Target): Discount general merchandise and apparel.
- Officeworks: Office supplies, technology, and education products.
- Wesfarmers Health (Priceline, API): Pharmacy retail, wholesale pharmaceutical distribution, and digital health.
- Blackwoods / Industrial: Workplace supplies and industrial distribution.
- WesCEF: Chemicals, energy, fertilisers, and lithium.
| Division | Primary role within the group |
|---|---|
| Bunnings | Core earnings engine; dominant home improvement retailer |
| Kmart Group (incl. Target) | Value-focused general merchandise |
| Officeworks | Office, tech, and education supplies |
| Wesfarmers Health | Pharmacy retail, wholesale distribution, digital health |
| Blackwoods / Industrial | Workplace and industrial supplies distribution |
| WesCEF | Chemicals, fertilisers, lithium, and energy transition |
Management’s capital recycling discipline reinforces the structure. The Coles acquisition in 2007 and subsequent demerger in 2018 demonstrated a willingness to buy, build, and divest at disciplined valuations. H1 FY26 results, released 18 February 2026, showed group revenue growing at a mid-single-digit percentage and net profit after tax (NPAT) rising at a high-single-digit percentage versus the prior corresponding period. Investors buying Wesfarmers shares are primarily buying a bet on Bunnings’ sustained dominance, with optionality on the supporting divisions.
When big ASX news breaks, our subscribers know first
What the financial metrics reveal about a mature blue-chip at a discount
Several metrics shape the risk and reward profile of Wesfarmers at this price point. Taken individually, each functions as a lens rather than a verdict; read together, they build a composite picture that is genuinely mixed, spanning capital efficiency, balance sheet positioning, income generation, and valuation.
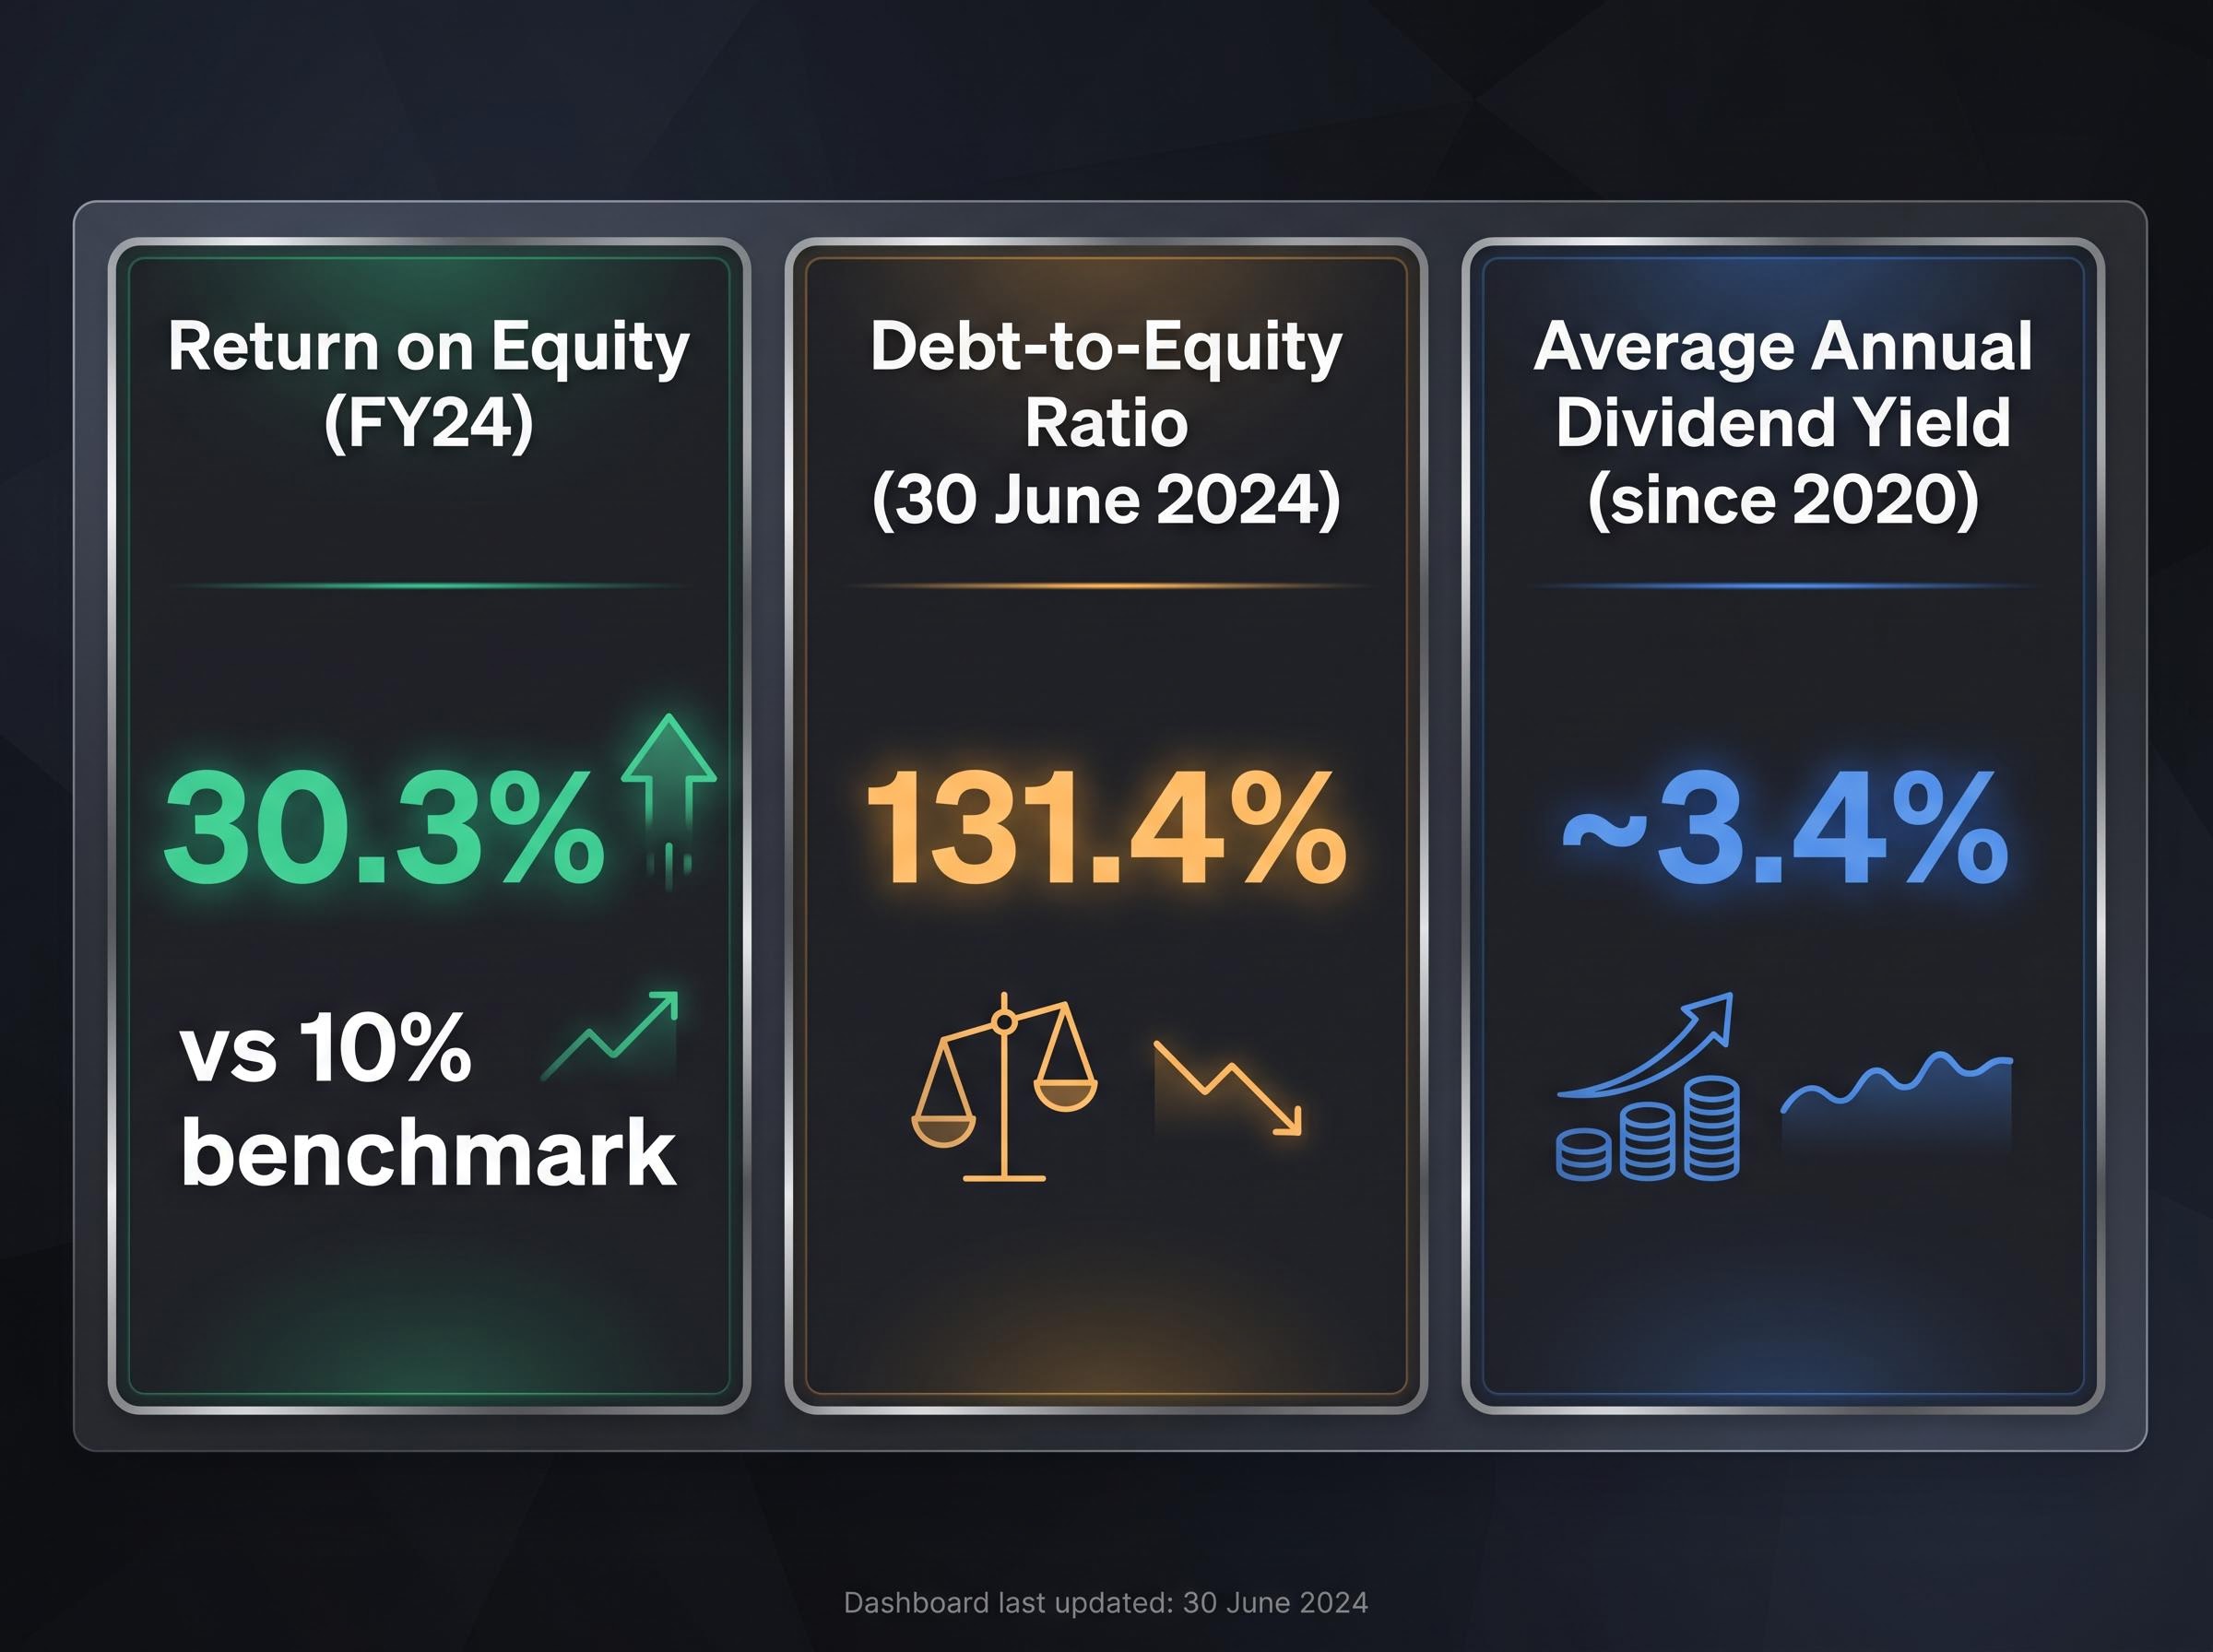
“Wesfarmers posted a return on equity of 30.3% in FY24, more than three times the 10% benchmark commonly applied to mature blue-chip businesses.”
Return on equity (ROE) measures how effectively a company generates profit from the capital shareholders have invested. At 30.3% in FY24, Wesfarmers’ ROE is a standout figure for a mature conglomerate, signalling that management is deploying capital at a rate of return well above the cost of that capital. For context, a 10% ROE is widely used as a benchmark for well-run blue-chip businesses.
The debt-to-equity ratio complicates the picture. At 131.4% as of 30 June 2024, gearing sits above historical norms. This ratio compares total debt to shareholders’ equity, and a higher figure means the business is funding a larger share of its operations and investments through borrowings. Wesfarmers’ elevated leverage reflects both capital return activity and ongoing investment in lithium and health.
On income, the average annual dividend yield since 2020 is approximately 3.4%, with all dividends fully franked. Franking credits, under the Australian imputation tax system, reduce the effective tax burden for Australian resident shareholders, lifting the after-tax return above the headline yield. The dividend payout policy targets approximately 70-80% of NPAT over the cycle, and the H1 FY26 interim dividend was increased modestly versus the prior-year interim.
The ATO guidance on franking credits explains how the dividend imputation system reduces the effective tax burden for Australian resident shareholders, with eligible investors able to apply excess credits against other income or receive a cash refund, meaningfully lifting the after-tax return above the headline yield.
On valuation, the forward price-to-earnings (P/E) multiple sits in the low-to-mid 20s, a figure that several brokers characterise as full rather than cheap for a business facing a period of earnings normalisation across its key divisions.
| Metric | Value | Benchmark / Context |
|---|---|---|
| Return on equity (FY24) | 30.3% | 10% benchmark for mature blue chips |
| Debt-to-equity ratio (30 June 2024) | 131.4% | Elevated vs historical norms |
| Average annual dividend yield (since 2020) | ~3.4% | Fully franked; yield near 5-year average following pullback |
The takeaway for income and value-focused investors: exceptional capital efficiency sits alongside a balance sheet that carries real leverage risk, and the yield has only reached its historical average because the share price has come down.
The same three-metric framework underpinning blue-chip ASX stock analysis, combining return on equity, debt-to-equity ratio, and dividend sustainability, applies across the conglomerate sector, though the interpretation differs materially depending on whether leverage is funding growth assets or returning capital to shareholders.
Why Bunnings’ moat matters more than most investors realise
The financial metrics are not accidents. They are products of a structural competitive position at Bunnings that is genuinely difficult to replicate. Understanding what sustains that position, and where it faces pressure, is the single most important qualitative judgment for any Wesfarmers shareholder.
The strengths of the Bunnings position
- Store network scale: Bunnings operates the largest home improvement footprint in Australia, a physical presence that functions as both a customer acquisition channel and a distribution advantage.
- Supplier relationships: Purchasing scale gives Bunnings pricing power that smaller competitors cannot match, reinforcing its value proposition to both consumer and trade segments.
- Trade-customer mix: H1 FY26 results confirmed positive comparable sales growth, with trade customers continuing to outperform DIY. This trade exposure is what brokers refer to when they describe Bunnings as “defensive earnings” within a consumer-discretionary context, because trade demand is tied to construction activity and maintenance schedules rather than purely discretionary spending.
- EBIT discipline: Bunnings’ EBIT growth ran broadly in line with or slightly ahead of sales growth in H1 FY26, reflecting cost control rather than margin erosion.
As one broker noted in a 5 March 2026 report for the Sydney Morning Herald, Wesfarmers is “better positioned than pure discretionary retailers given Bunnings’ defensive earnings.”
Risks to the moat worth monitoring
- Online specialist competition: Eli Greenblat reported in The Australian on 19 March 2026 that while Bunnings retains dominant market share, rivals are circling. Specialist online players and expanded hardware ranges at big-box competitors represent credible, if incremental, threats.
- Urban network saturation: The store rollout that built Bunnings’ scale may be approaching diminishing returns in some metropolitan markets, limiting the organic growth lever.
- Digital investment requirements: Maintaining trade-customer loyalty increasingly requires investment in digital ordering, delivery, and account management tools, a cost that does not generate new revenue so much as protect existing share.
Bunnings’ moat is the central investment thesis for Wesfarmers shares. If that moat narrows materially, the premium multiple and the dividend growth story both come under pressure simultaneously.
Where analysts disagree, and what the price target range says about valuation uncertainty
The spread of analyst views on Wesfarmers is not noise. It reflects genuine disagreement about how much weight to assign to Bunnings’ earnings durability versus cyclical headwinds and the execution risk in new growth platforms.
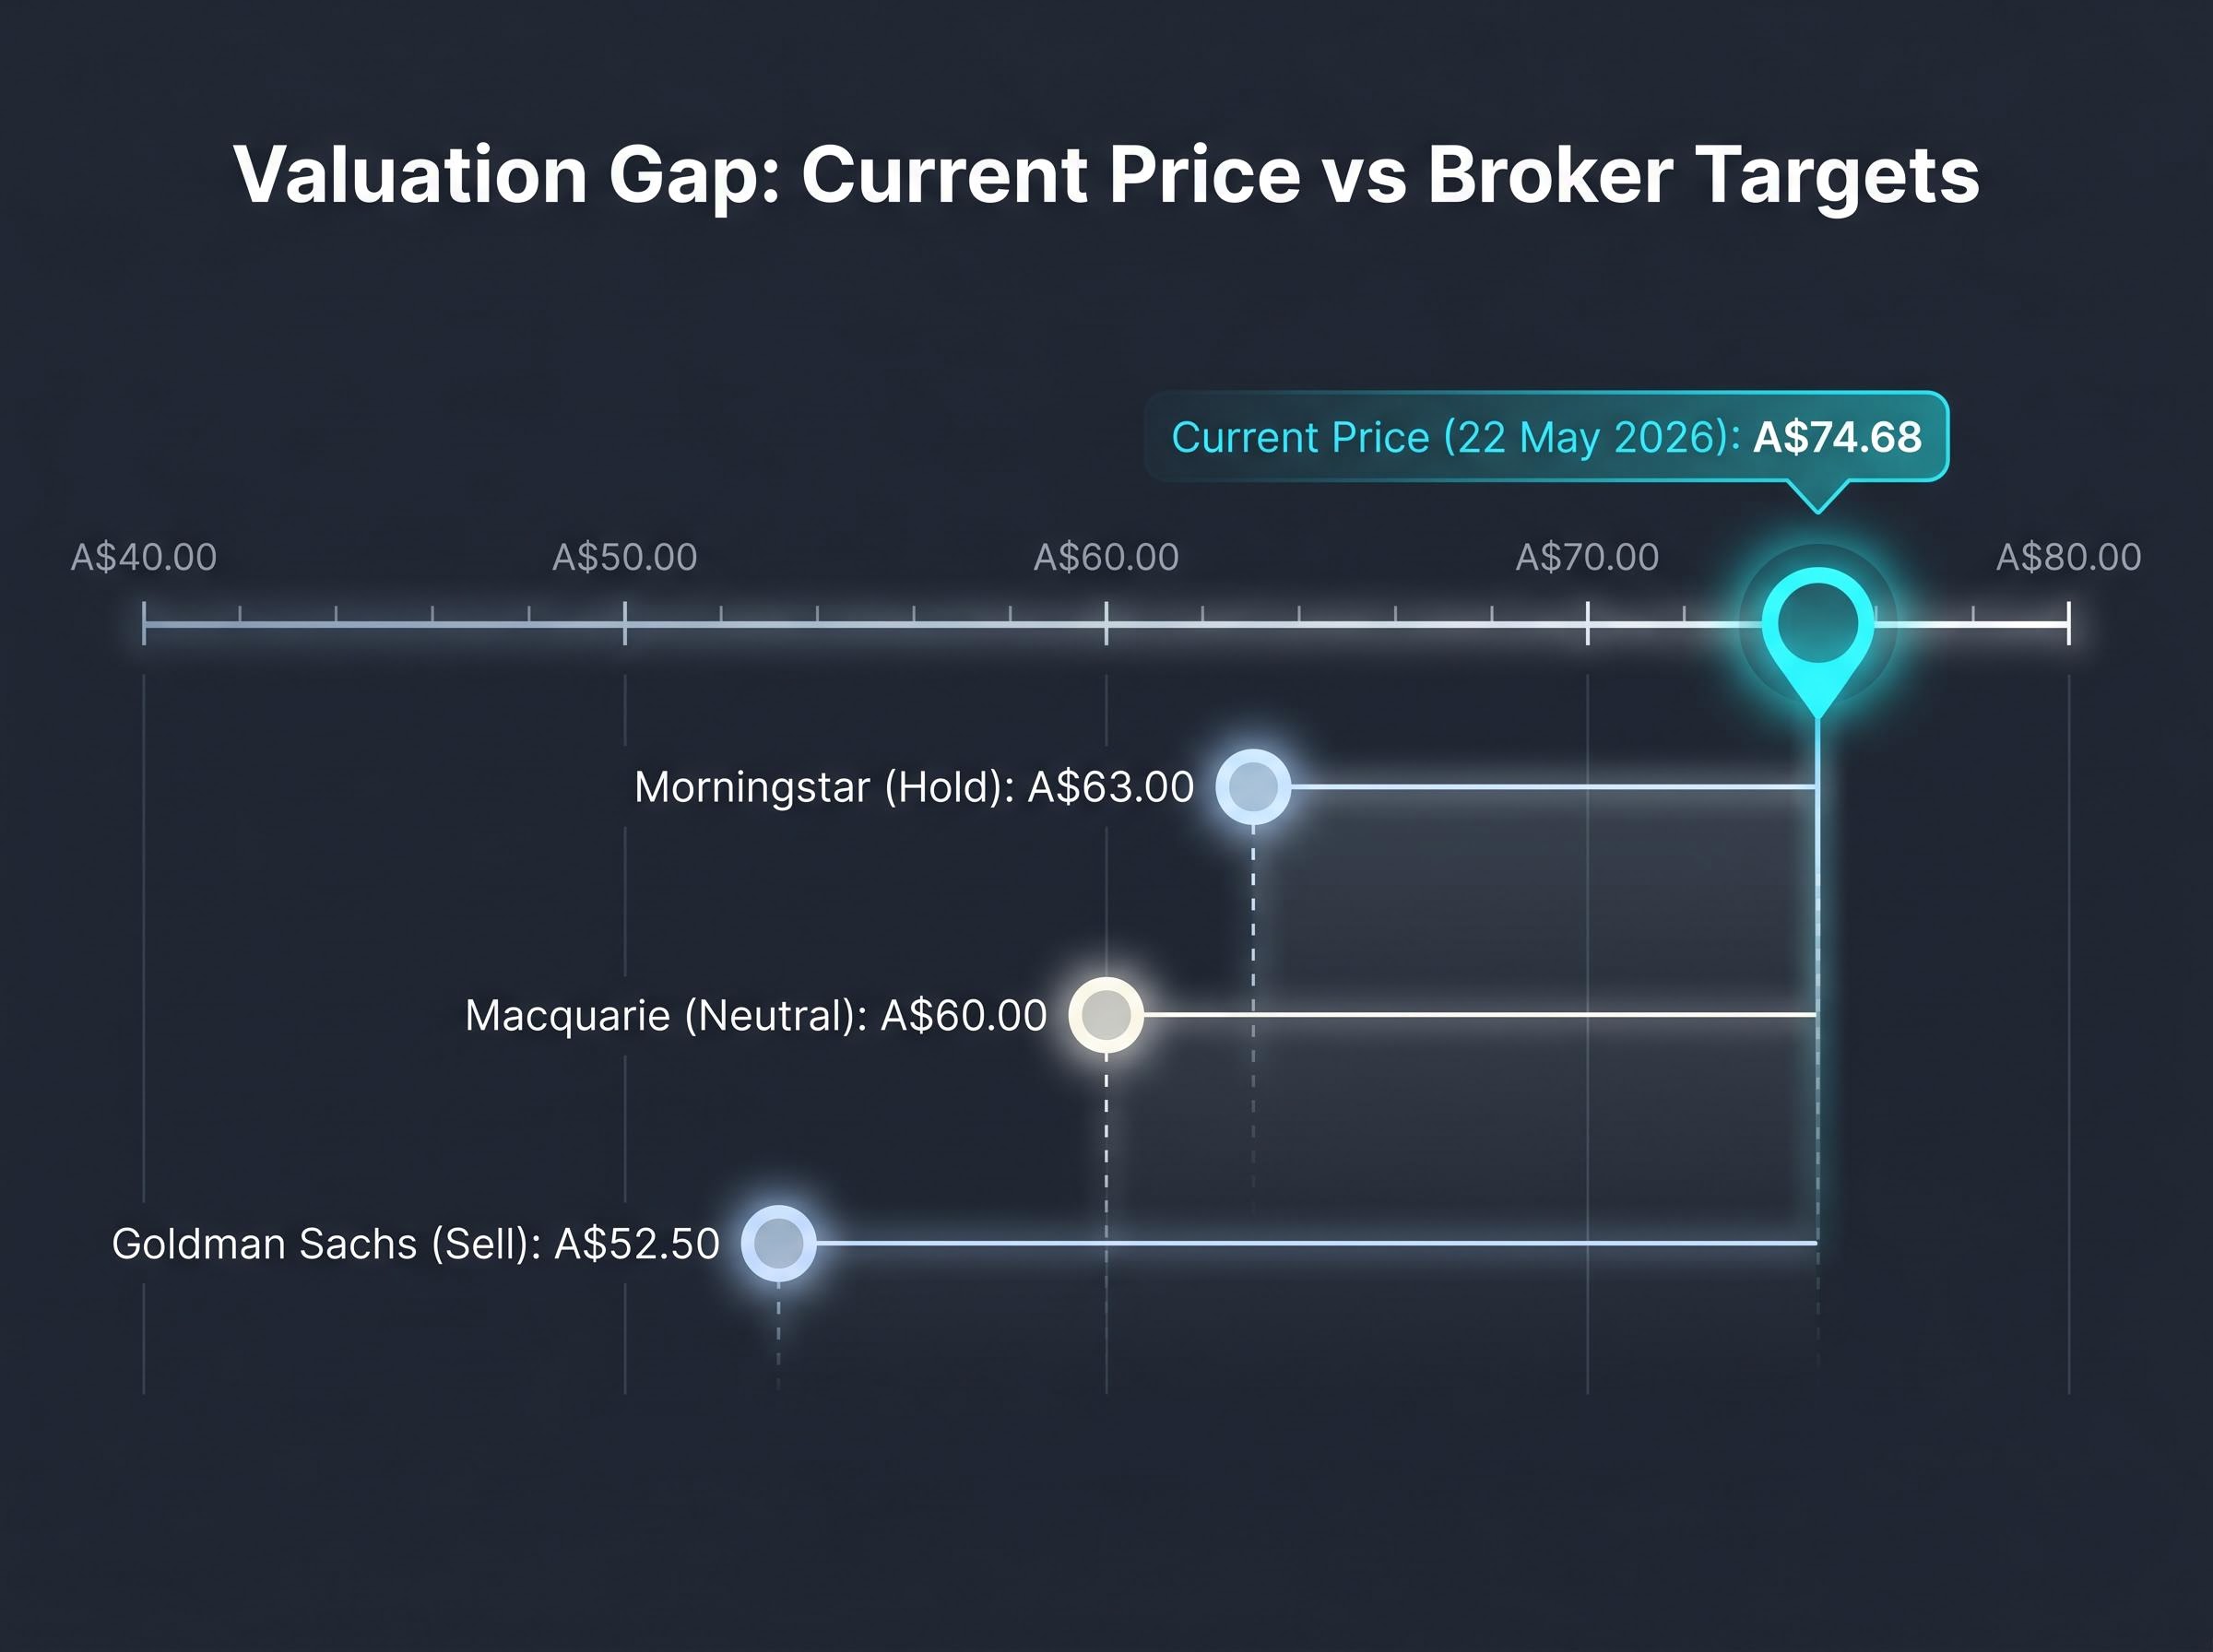
At one end, Goldman Sachs holds a Sell rating with a A$52.50 price target, arguing that Wesfarmers trades at a premium to its long-run average price-to-earnings ratio and to global retail peers, with earnings growth expected to slow as Bunnings cycles through strong prior periods and Kmart Group faces consumer headwinds. At the other end, the fund manager “buy the dip” camp, featured in Livewire Markets on 30 April 2026, views the roughly 20% pullback as a reasonable entry point for long-term investors.
“A rare combination of high-quality management, strong balance sheet and defensive cash flows from Bunnings.”
Macquarie sits in the middle with a Neutral rating and a A$60.00 target, characterising the forward price-to-earnings multiple in the low-to-mid 20s as “fair but not compelling.” Morningstar rates the stock Hold with a A$63.00 fair value estimate, noting the pullback has “improved the margin of safety” but investors are still “paying up for quality.” Morgan Stanley holds an Equal-weight rating without a stated target, flagging balance sheet risk alongside ongoing capital commitments.
| Broker / Source | Rating | Price Target (A$) | Key Rationale |
|---|---|---|---|
| Goldman Sachs | Sell | $52.50 | Premium valuation; slowing earnings growth |
| Macquarie | Neutral | $60.00 | Fair valuation; not compelling at current P/E |
| Morningstar | Hold / 3-star | $63.00 | Improved margin of safety; still paying for quality |
| Morgan Stanley | Equal-weight | Not stated | Balance sheet risk from capital commitments |
| Motley Fool | Hold / Cautious Buy | Not stated | Better entry than late 2025; demands margin of safety |
Note that the broker price targets sourced via Perplexity (Goldman Sachs, Macquarie, Morningstar) have not been independently verified and should be treated as directional views rather than confirmed figures. The spread between A$52.50 and the most constructive fund manager views reflects real uncertainty about the pace of earnings normalisation. Readers should use this range as a calibration tool, not a definitive answer.
Lithium, health, and leverage: three factors that will define Wesfarmers’ next chapter
The energy transition bet: lithium and WesCEF
The Mt Holland lithium project, a 50:50 joint venture with SQM, achieved first spodumene concentrate production in late 2023. Spodumene concentrate is the primary lithium-bearing mineral that is subsequently processed into lithium hydroxide for use in battery applications. Downstream lithium hydroxide production at the Kwinana refinery commenced in mid-2025, with ramp-up continuing into 2026.
The project’s strategic rationale has not wavered despite weaker lithium prices throughout 2025. CEO Rob Scott described it in the H1 FY26 webcast as “a long-term investment aligned with the energy transition.” WesCEF is also assessing investments in low-carbon ammonia and hydrogen projects in Western Australia, positioning the division for longer-term demand growth in lower-emissions industrial chemicals.
Spodumene concentrate prices quadrupled from approximately US$600 per tonne in mid-2025 to US$2,500 per tonne by May 2026, a recovery that directly improves the economics of the Kwinana hydroxide refinery ramp-up and provides more favourable conditions for the Mt Holland expansion decision than existed when WesCEF’s capital commitments were being debated.
Building the health platform
Wesfarmers Health combines Priceline Pharmacy retail, API wholesale distribution, and digital health initiatives including telehealth and online prescription partnerships. Bolt-on acquisitions have continued: the Hardtofind assets were acquired in June 2025 (integrated into Kmart’s online marketplace), and a majority stake in Educ8 was completed in December 2025 (via Officeworks into the learning supplies category).
Management has been frank that health will take time to materially move the earnings needle given Bunnings’ scale. Integration of Priceline and API is progressing, but competing against established healthcare players in a regulated environment introduces integration and regulatory risk.
The connective tissue between these growth bets and the dividend is the balance sheet. A debt-to-equity ratio of 131.4% means that underperformance in either lithium or health creates real, if not immediate, pressure on the financial flexibility that underwrites the dividend policy.
Livewire portfolio managers, writing in January 2026, identified three risks worth monitoring:
- Commodity price volatility in lithium, where cost overruns or delays at Mt Holland and Kwinana could materially impair returns.
- Integration and regulatory risk in health, including pharmacy ownership rules and Pharmaceutical Benefits Scheme (PBS) settings.
- Balance sheet constraint if both initiatives underperform simultaneously, potentially limiting future dividends or investment capacity.
Morgan Stanley echoed this framing, noting that while current gearing is “acceptable,” significant underperformance of new growth investments or a sharp Bunnings/Kmart downturn could constrain future dividends.
The current entry point in plain terms: what value and income investors should weigh
At A$74.68, Wesfarmers sits approximately 21% below its 52-week high. The pullback has returned the dividend yield close to its five-year average, and the fully franked nature of those dividends enhances the effective after-tax return for Australian resident shareholders. The payout policy of 70-80% of NPAT provides a structural anchor for income.
Dividend-growth strategies that screen for payout sustainability and earnings quality have historically produced stronger long-run total returns than pure high-yield approaches, which matters for Wesfarmers investors because the stock’s income case rests not on an elevated yield but on a fully franked, growing payout anchored by an expanding earnings base.
The bull case rests on:
- ROE of 30.3%, well above mature blue-chip benchmarks
- Bunnings’ durable competitive position and trade-customer resilience
- Fully franked dividends at a yield now near the five-year average
- Management’s track record of disciplined capital recycling
The bear case rests on:
- Elevated debt-to-equity ratio of 131.4%
- Execution risk in lithium and health, neither of which has yet proved its earnings contribution at scale
- Consumer spending headwinds compressing discretionary demand at Kmart and, to a lesser extent, Bunnings DIY
- A share price that still trades on a forward P/E in the low-to-mid 20s, which several brokers consider fully valued
As one fund manager told the AFR in May 2026, Wesfarmers is “reasonable, not cheap” but remains a “core quality compounder” offering a better entry than late 2025.
“A rare combination of high-quality management, strong balance sheet and defensive cash flows from Bunnings.”
Two conditions would most change the calculus from here. A material deterioration in Bunnings comparable sales would undercut the bull case directly. A significant further decline in lithium prices would sharpen the balance sheet question and test whether the dividend policy can hold alongside ongoing capital commitments.
This article is for informational purposes only and should not be considered financial advice. Investors should conduct their own research and consult with financial professionals before making investment decisions. Past performance does not guarantee future results. Financial projections are subject to market conditions and various risk factors.
Quality at a discount, or fair value for a reason?
Wesfarmers combines genuinely exceptional capital productivity, a 30.3% return on equity, with a leverage profile and growth commitments that introduce real uncertainty into the dividend and capital allocation outlook. The price pullback has improved the entry point relative to late 2025 but has not resolved the underlying question of whether the market is adequately pricing execution risk in lithium and health.
For income and value-focused ASX investors, the stock presents a familiar tension: a demonstrably high-quality business trading at a price that is better than it was, but not yet clearly cheap. The performance of Bunnings comparable sales in H2 FY26 and the ongoing lithium hydroxide ramp-up at Kwinana will be the two most closely watched data points for investors monitoring the stock through the remainder of the fiscal year.
Investors seeking additional context on reading ASX financial metrics and building blue-chip positions may find related analysis on the site a useful complement to this assessment.
For income-focused investors wanting to model the after-tax return at current prices, our dedicated guide to Wesfarmers’ grossed-up dividend yield walks through the franking credit calculation for investors on a 30% tax rate, examines how far the share price would need to fall to reach the five-year average yield, and identifies the specific catalysts, including the June 2026 Strategy Briefing Day and the FY26 full-year result, that could shift the valuation picture.