Cochlear Falls 63%: Generational Discount or Falling Knife?
1 hr ago

Woolworths Group’s (ASX:WOW) trailing dividend yield of approximately 4.15% sits roughly 42% above its five-year historical average of 2.92%. For income-focused investors, that gap demands attention. With the RBA cash rate at 4.35% as of May 2026, fully franked blue-chip dividends are competing directly with term deposits for a place in Australian portfolios. Yet Woolworths has not stood at this yield level often. The stock has spent most of the past decade priced as a growth name, keeping its yield modest and largely irrelevant to income strategies. That framing has shifted. The share price remains well off its highs, the Board raised the interim dividend 15.4% to 45 cents per share (fully franked) in February 2026, and the business just posted 14.4% EBIT growth across all segments. What follows is an assessment of what the elevated yield signals about valuation and earnings trajectory, how dividend sustainability holds up against regulatory headwinds and a high payout ratio, how Woolworths compares to Coles (ASX:COL) as an income vehicle, and how yield-versus-historical-average functions as a practical entry framework for ASX blue chips.
A trailing yield of approximately 4.15% against a five-year average of 2.92% translates to a gap of roughly 1.23 percentage points. On its own, the number looks like a dividend story. It is not.
WOW’s trailing yield of approximately 4.15% sits roughly 42% above its five-year historical average of 2.92%.
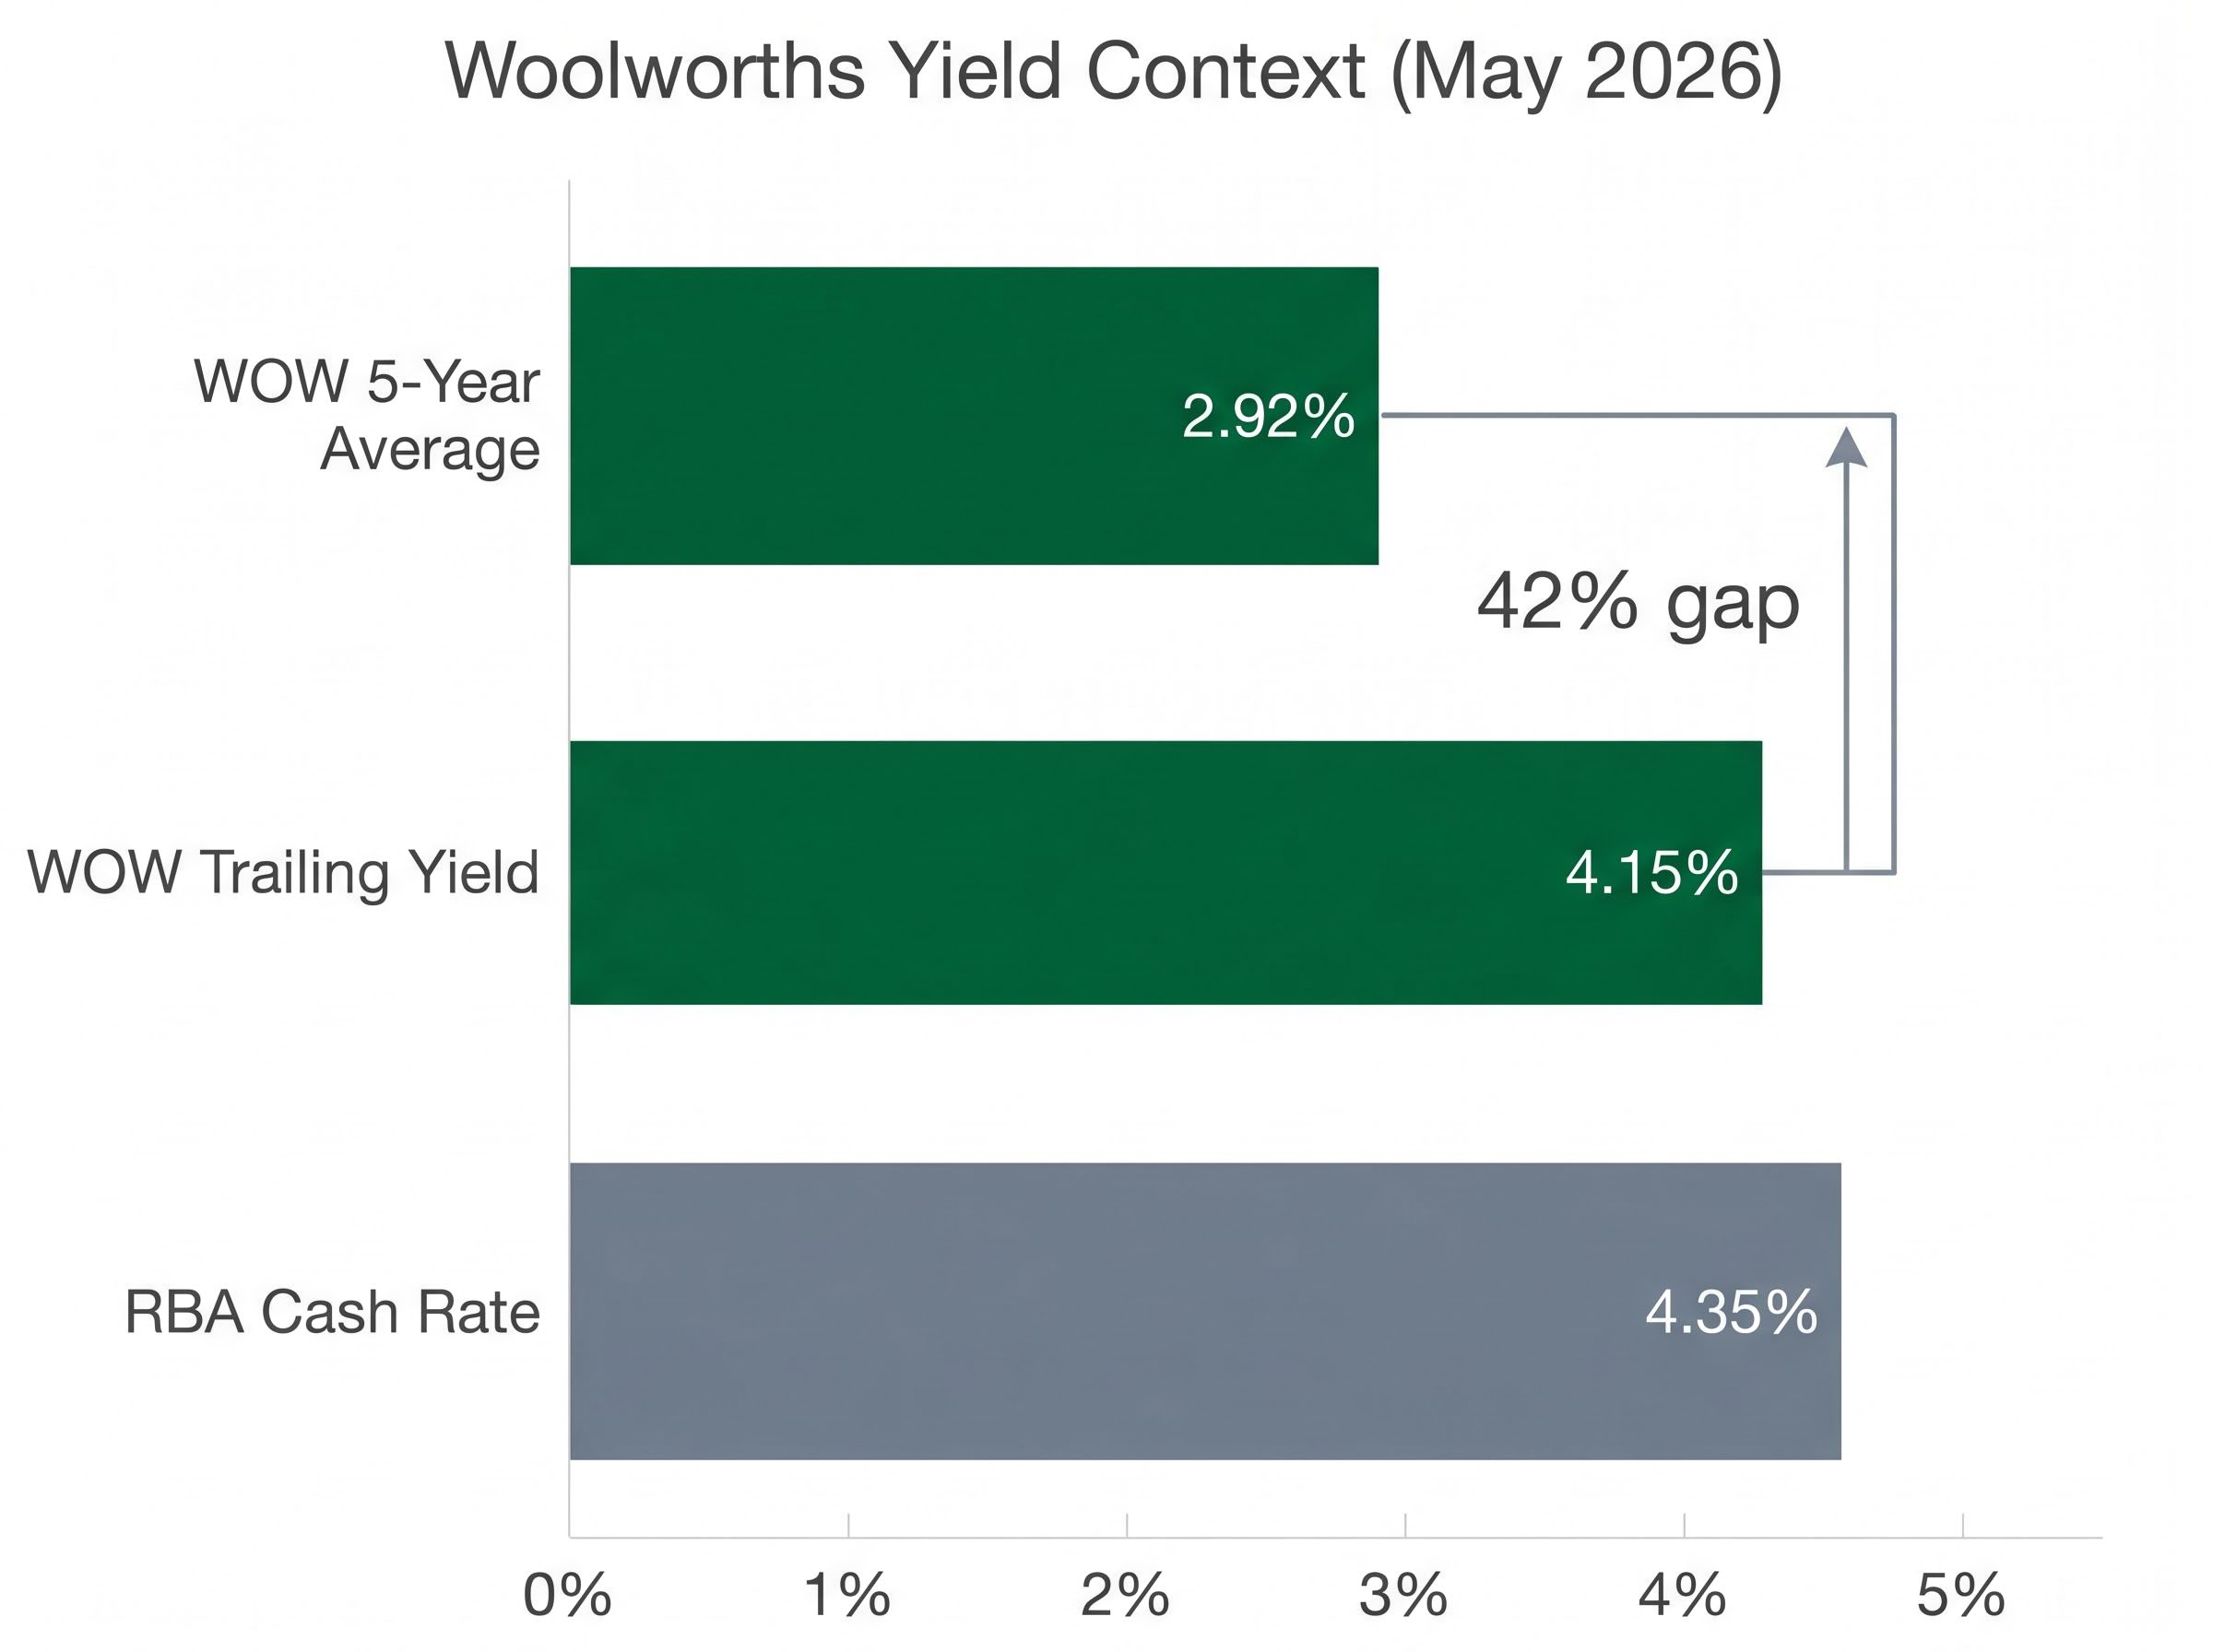
The yield is elevated primarily because the denominator has compressed. Woolworths’ share price is 35.9% above its 52-week low as of May 2026, yet it remains well below its prior highs. That price compression lifts the yield mechanically, even before accounting for the interim dividend increase. Forward yield estimates of 4.0-4.2%, per Rask Media analysis from March 2026, confirm the market expects the yield to persist near current levels rather than snap back.
For a defensive blue chip, an above-average yield carries three possible interpretations:
In Woolworths’ case, both are at work. The Board raised the payout, and the market simultaneously stopped pricing WOW for growth. That combination creates a different kind of opportunity for income-seeking investors, one rooted in relative valuation rather than momentum.
ASX consumer staples sector returns over the five years to May 2026 averaged -1.57% per year against 3.91% annually for the broader ASX 200, a gap that reframes the defensive label: consumer staples protect earnings during downturns but have not protected capital over extended growth cycles, which is the context in which Woolworths’ current above-average yield emerged.
A yield figure means little without the earnings base to sustain it. Woolworths’ operational footprint provides that base: more than 3,000 stores, over 100,000 employees, and greater than 35% grocery market share in Australia, spread across Australian supermarkets, New Zealand operations (formerly Countdown), Big W, and PFD Food Services.
The H1 FY26 results, announced 25 February 2026, put numbers behind the scale.
| Metric | Result |
|---|---|
| Group sales growth | +3.4% |
| EBIT growth (before significant items) | +14.4% |
| Interim dividend | 45 cents per share, fully franked |
| Dividend growth (vs. prior year interim) | +15.4% |
Every segment contributed to EBIT growth, including Big W and PFD Food Services. That breadth matters. A dividend funded by a single segment’s windfall carries concentration risk; a dividend covered by broad-based EBIT momentum across four operating divisions reflects genuine earnings health.
The 15.4% increase to 45 cents per share (ex-dividend 4 March 2026, payment 2 April 2026) was not a mechanical payout. The Board’s half-year results announcement explicitly tied the raise to confidence in “cash generation and balance sheet” strength, reinforced by the cleaner capital structure following the full exit from Endeavour Group in FY25.
For established, cash-generative companies with stable payout policies, the current yield relative to the long-run average functions as a proxy for relative valuation. It is to income stocks what the price-to-earnings ratio is to growth stocks: a quick measure of how the market is pricing the business compared to its own history.
The method works in three steps:
This approach has clear limitations.
“A yield above historical average is a starting signal, not a buy signal. It tells you the market is pricing caution; it does not tell you whether the caution is justified.”
A single metric cannot capture the full picture. Yields can be distorted by temporary earnings spikes, one-off dividend specials, or structural business change. Income investors should treat the yield-versus-average signal as a screening tool, then stress-test it using complementary frameworks such as discounted cash flow (DCF) analysis or a Dividend Discount Model to assess whether the current payout is sustainable at the implied growth rate.
Investors wanting to move beyond the yield-versus-average screen will find our full explainer on the dividend discount model for ASX income stocks, which walks through the Gordon Growth Model formula, explains why Australian banks, REITs, and consumer staples are structurally suited to DDM application, and shows how franking credits change the effective yield inputs used in the calculation.
For eligible Australian shareholders, fully franked dividends carry an attached credit for the 30% corporate tax already paid. This means the effective pre-tax yield exceeds the headline cash yield. For a superannuation fund in accumulation phase (taxed at 15%), the grossed-up yield on a fully franked 4.15% cash yield is materially higher than the headline figure, widening the gap over unfranked alternatives and term deposits.
The benefit is investor-specific and tax-bracket-dependent. Readers should consult their accountant or financial adviser for their individual position.
The interim dividend increase was 15.4%. That figure should not be extrapolated. Four structural constraints define the ceiling on future growth.
Woolworths’ balance sheet constraints add another dimension to the payout ratio picture: a debt-to-equity ratio of 300.2% limits the financial flexibility to absorb earnings shocks or respond aggressively to competitive threats, which is part of why broker consensus treats dividend growth as tracking EPS rather than outpacing it.
The ACCC supermarkets inquiry 2024-25 examined pricing practices, supplier relationships, and competitive dynamics across the sector, with its final report published in March 2025 forming the regulatory backdrop against which both Woolworths and Coles are managing margin decisions and capital allocation.
Dividends are expected to track EPS growth rather than expand materially above it, according to Morgan Stanley.
Broker consensus points to low-single-digit earnings-per-share growth in FY27-FY28. Dividends are likely to follow that trajectory: stable, modestly growing, and defensible, but not compounding at a pace that transforms a portfolio’s income stream.
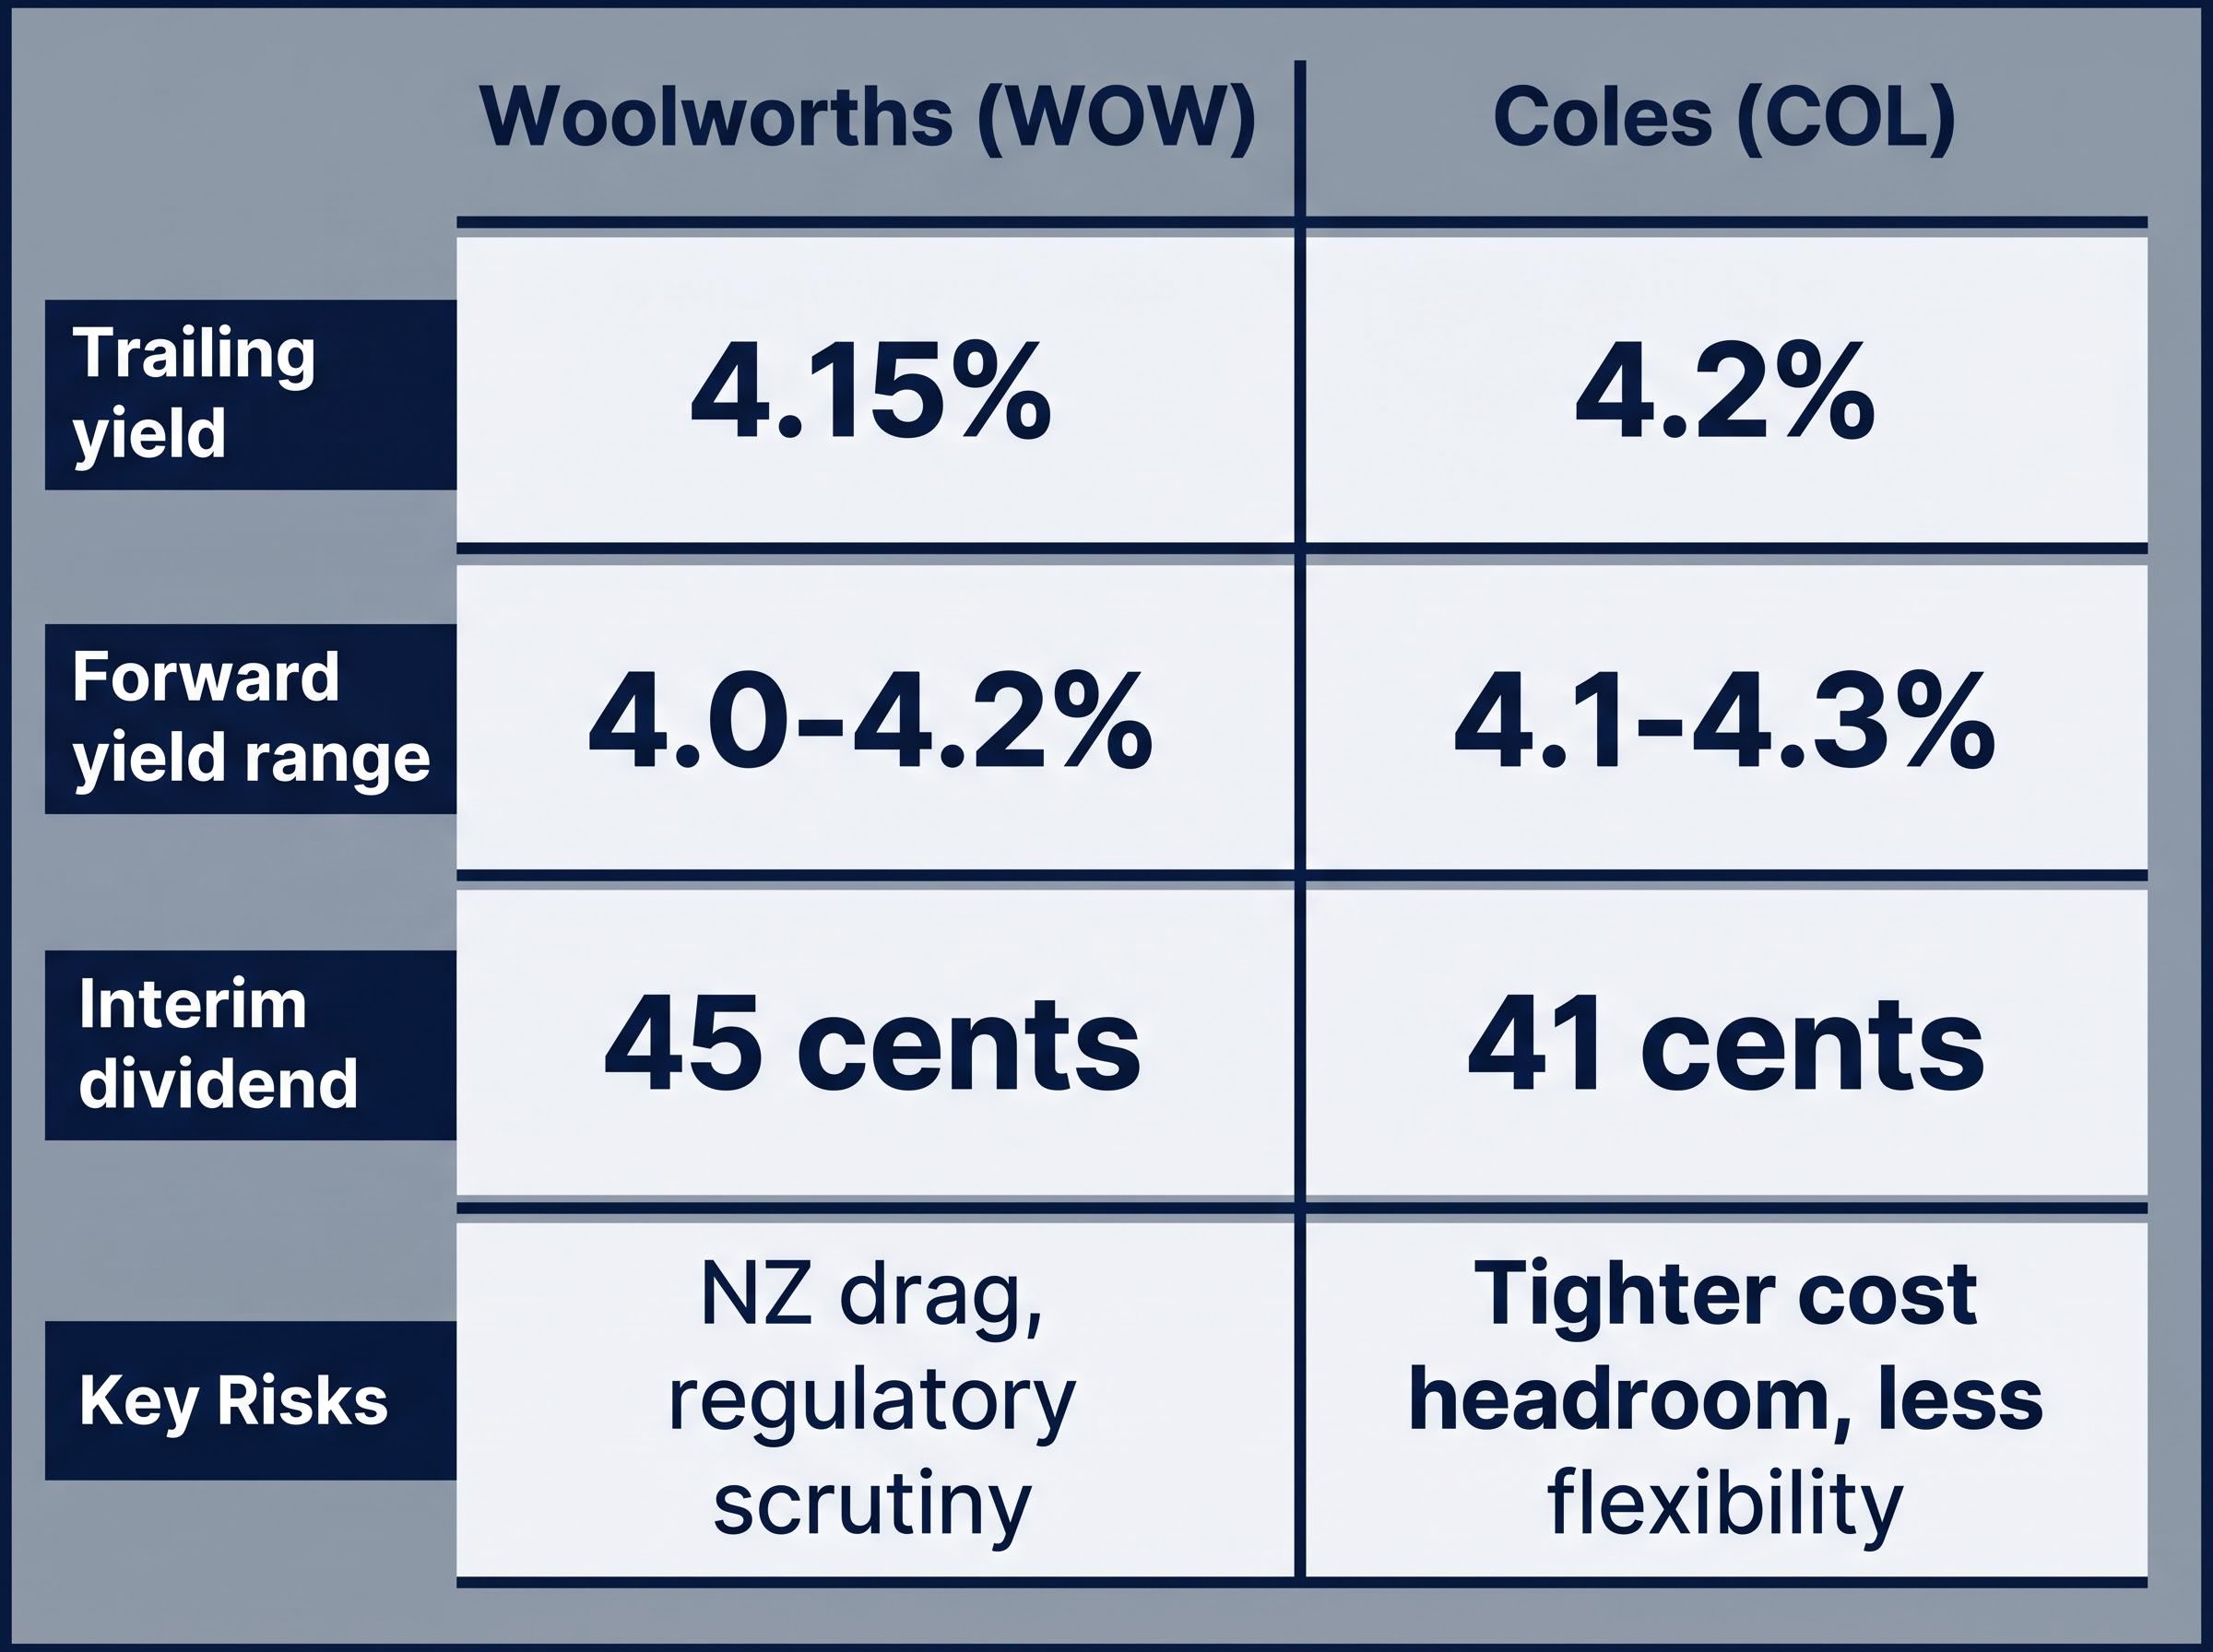
The yield gap between the two is narrow enough to be noise. Coles offers a trailing yield of approximately 4.2% (per Intelligent Investor, April 2026) against Woolworths’ approximately 4.15%. Forward yield ranges overlap: 4.1-4.3% for Coles versus 4.0-4.2% for Woolworths, according to Rask Media estimates from March 2026.
| Attribute | Woolworths (WOW) | Coles (COL) |
|---|---|---|
| Trailing yield (approx.) | 4.15% | 4.2% |
| Forward yield range | 4.0-4.2% | 4.1-4.3% |
| Latest interim dividend | 45 cents, fully franked | 41 cents, fully franked |
| Diversification profile | Supermarkets, Big W, PFD, NZ | Supermarkets, liquor (Australia-focused) |
| Key risk factor | NZ drag, regulatory scrutiny | Tighter cost headroom, less flexibility |
The real decision sits beneath the yield line. Morgan Stanley has framed Coles as offering a marginally higher starting yield but with tighter cost headroom, while Morningstar’s February 2026 analysis characterised the pair as carrying similar yields but different risk profiles.
Woolworths’ yield sits above its own long-run average, and it is backed by defensive earnings, broad-based EBIT growth, and a Board that raised the interim payout 15.4%. That is not noise. In a rate environment where the RBA cash rate has reached 4.35%, term deposits compete directly for investor attention, but fully franked blue-chip dividends retain a structural after-tax advantage for eligible Australian investors that cash cannot replicate.
The RBA cash rate target, currently set at 4.35% as confirmed by the Reserve Bank’s official monetary policy schedule, represents the highest risk-free benchmark Australian income investors have faced in over a decade, making the after-tax advantage of fully franked dividends a more consequential factor in portfolio construction than it was through most of the 2010s.
This is not a high-growth dividend story. Broker consensus points to low-single-digit EPS growth in the medium term, and the payout ratio leaves limited room to outpace earnings. What it is, however, is a defensible, stable income position at a yield level that has historically represented relative value.
The broader comparison between ASX dividends versus term deposits at the current 4.35% cash rate extends well beyond Woolworths: higher-yielding income securities, including select REITs and income ETFs, offer meaningful spreads above the cash rate hurdle, while a blended portfolio approach combining dividend shares with a tactical term deposit allocation provides resilience regardless of whether the RBA hikes further.
Before acting, income investors should confirm three conditions:
This article is for informational purposes only and should not be considered financial advice. Investors should conduct their own research and consult with financial professionals before making investment decisions. Past performance does not guarantee future results.
Woolworths' trailing dividend yield is approximately 4.15% as of May 2026, which sits roughly 42% above its five-year historical average of 2.92%, largely because the share price has compressed while the Board raised the interim dividend by 15.4% to 45 cents per share.
Woolworths pays fully franked dividends, meaning eligible Australian shareholders receive a tax credit for the 30% corporate tax already paid, which materially increases the effective pre-tax yield above the headline 4.15% cash figure, with the benefit varying depending on the investor's tax bracket.
The method involves comparing a stock's current trailing yield to its long-run average yield; a significantly elevated yield can signal the market is pricing in caution or slower growth, but it should be treated as a screening signal only and stress-tested with complementary frameworks such as discounted cash flow or dividend discount model analysis.
Key risks include a payout ratio already at 70-80% of net profit after tax leaving limited room to outpace earnings, ACCC regulatory pressure on pricing margins, a near-term earnings drag from New Zealand operations, and competition from term deposits at the current RBA cash rate of 4.35%.
The two are closely matched, with Coles offering a trailing yield of approximately 4.2% versus Woolworths' 4.15%; Coles provides a simpler, Australia-focused model with a marginally higher starting yield, while Woolworths offers greater earnings diversification across Big W, PFD Food Services, and New Zealand operations.