
The Memo That Halved Meta’s AI Infrastructure Cost Estimate
2 hrs ago

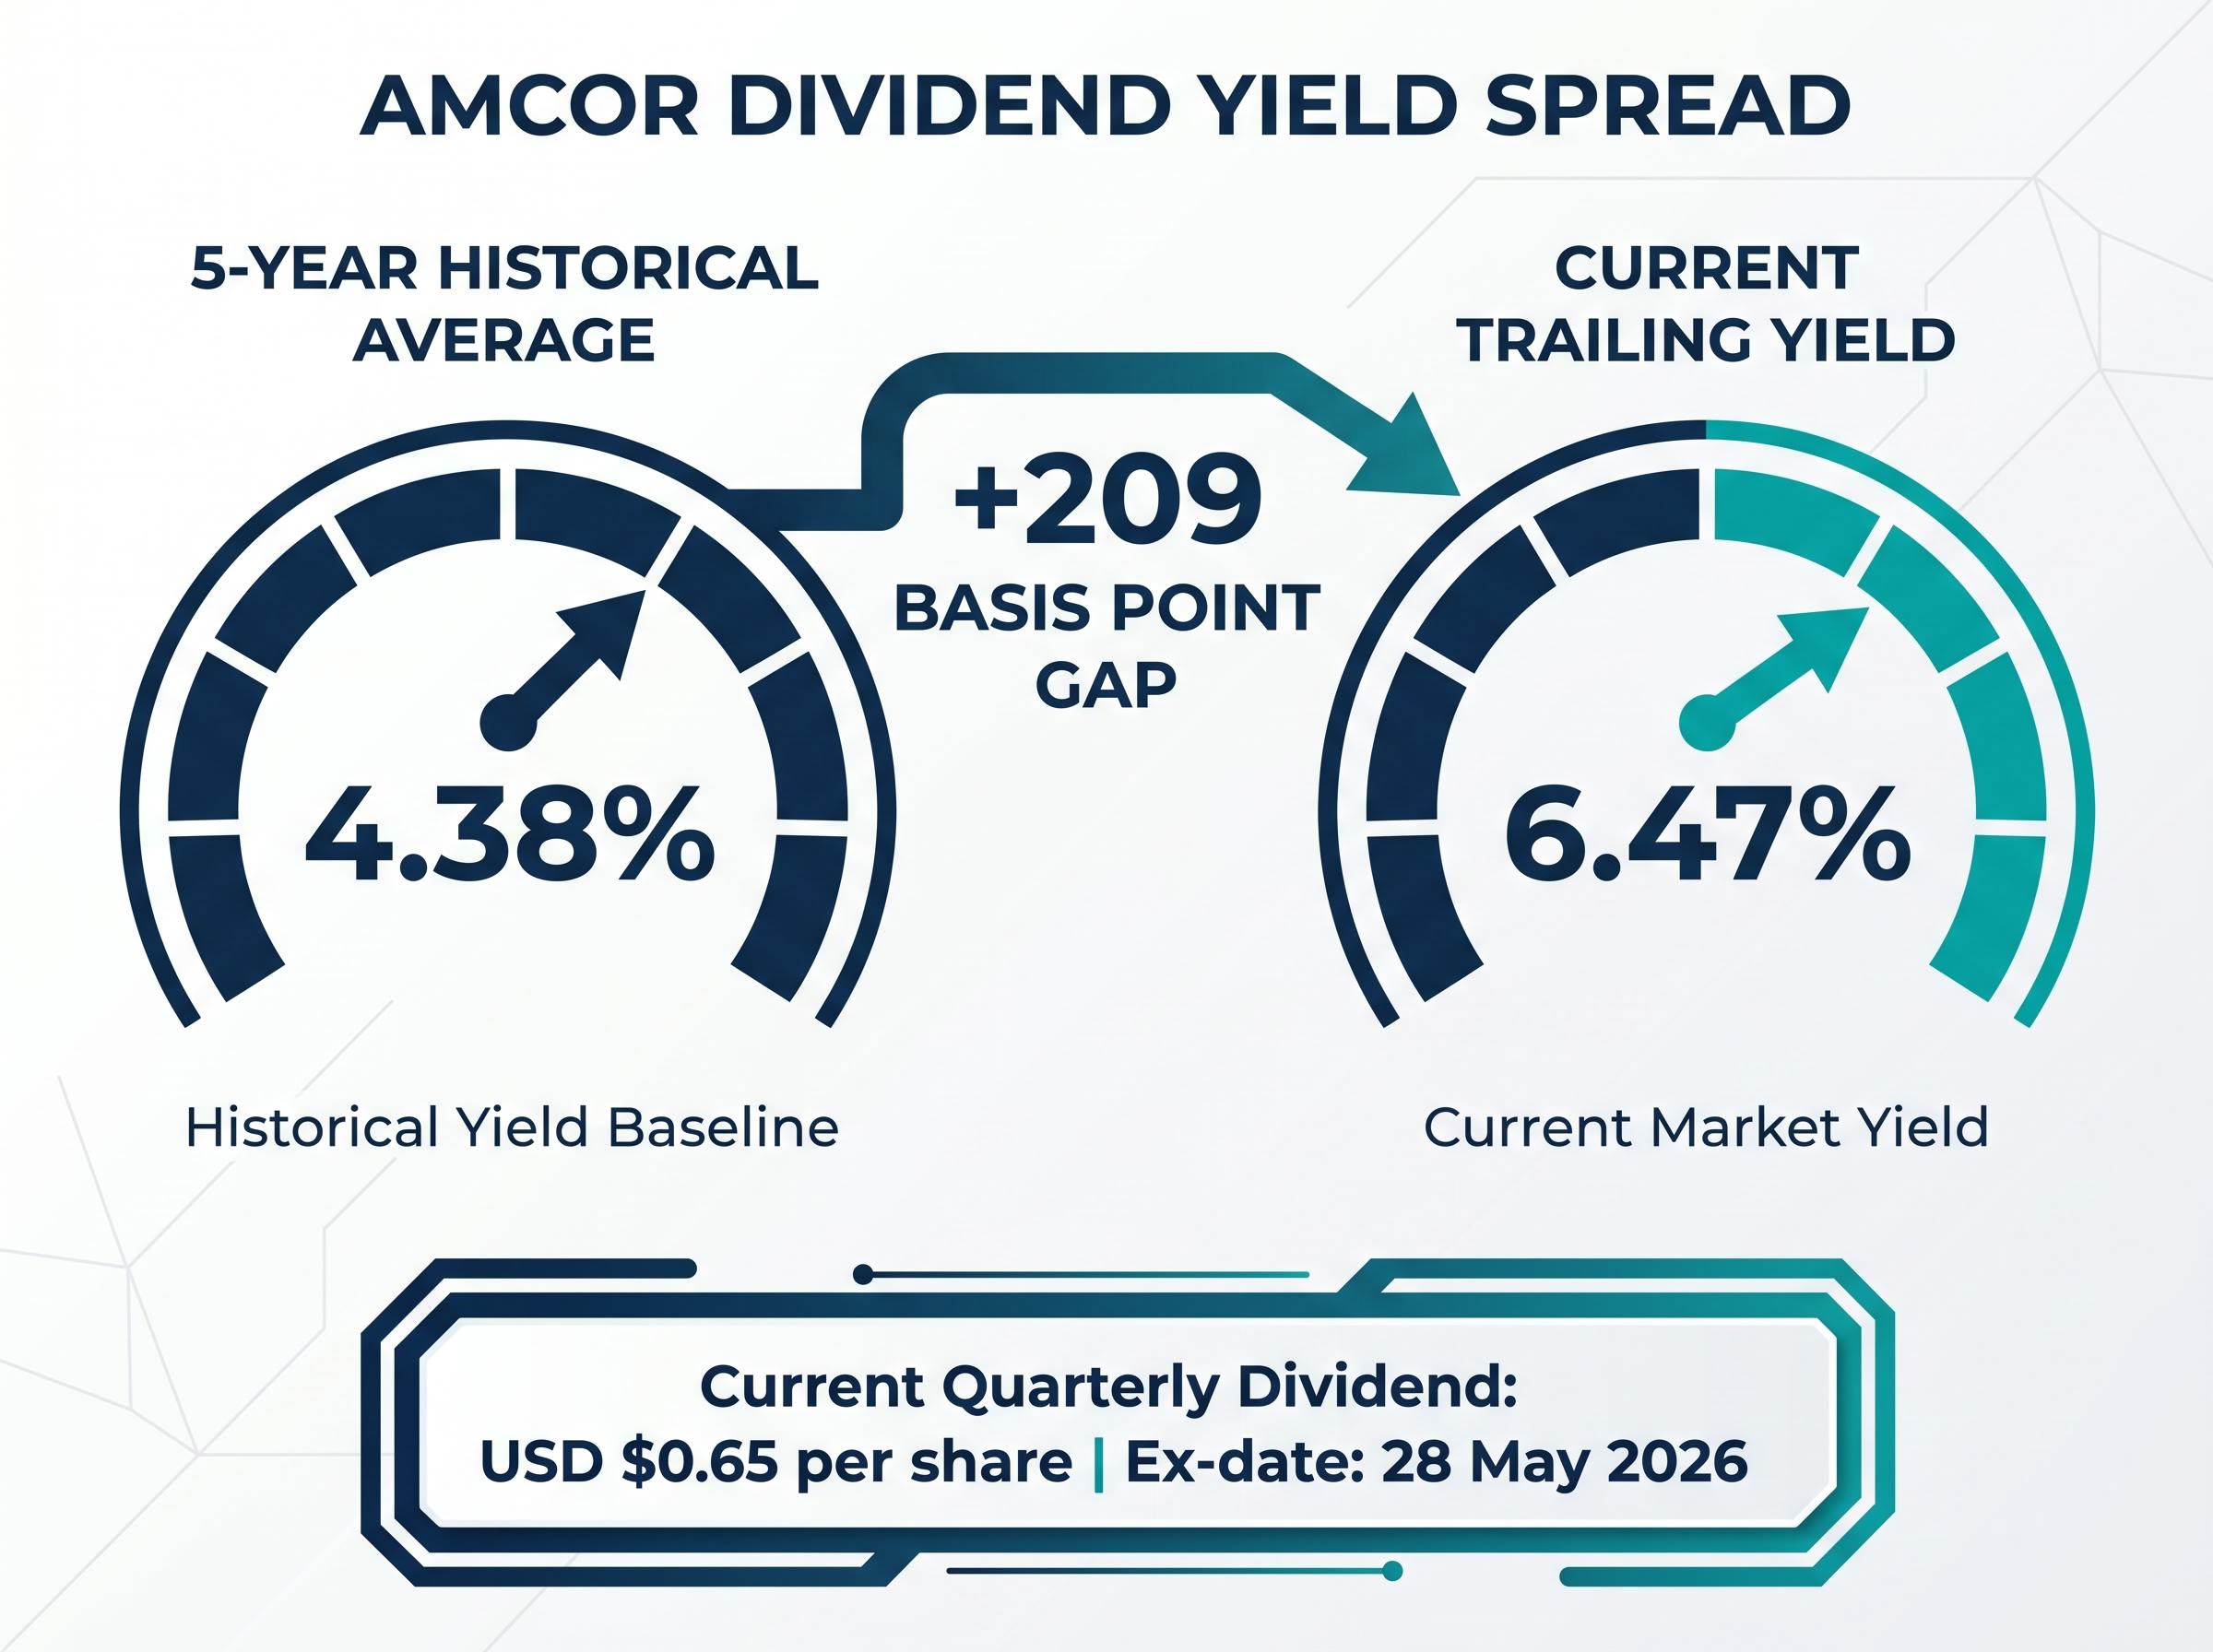
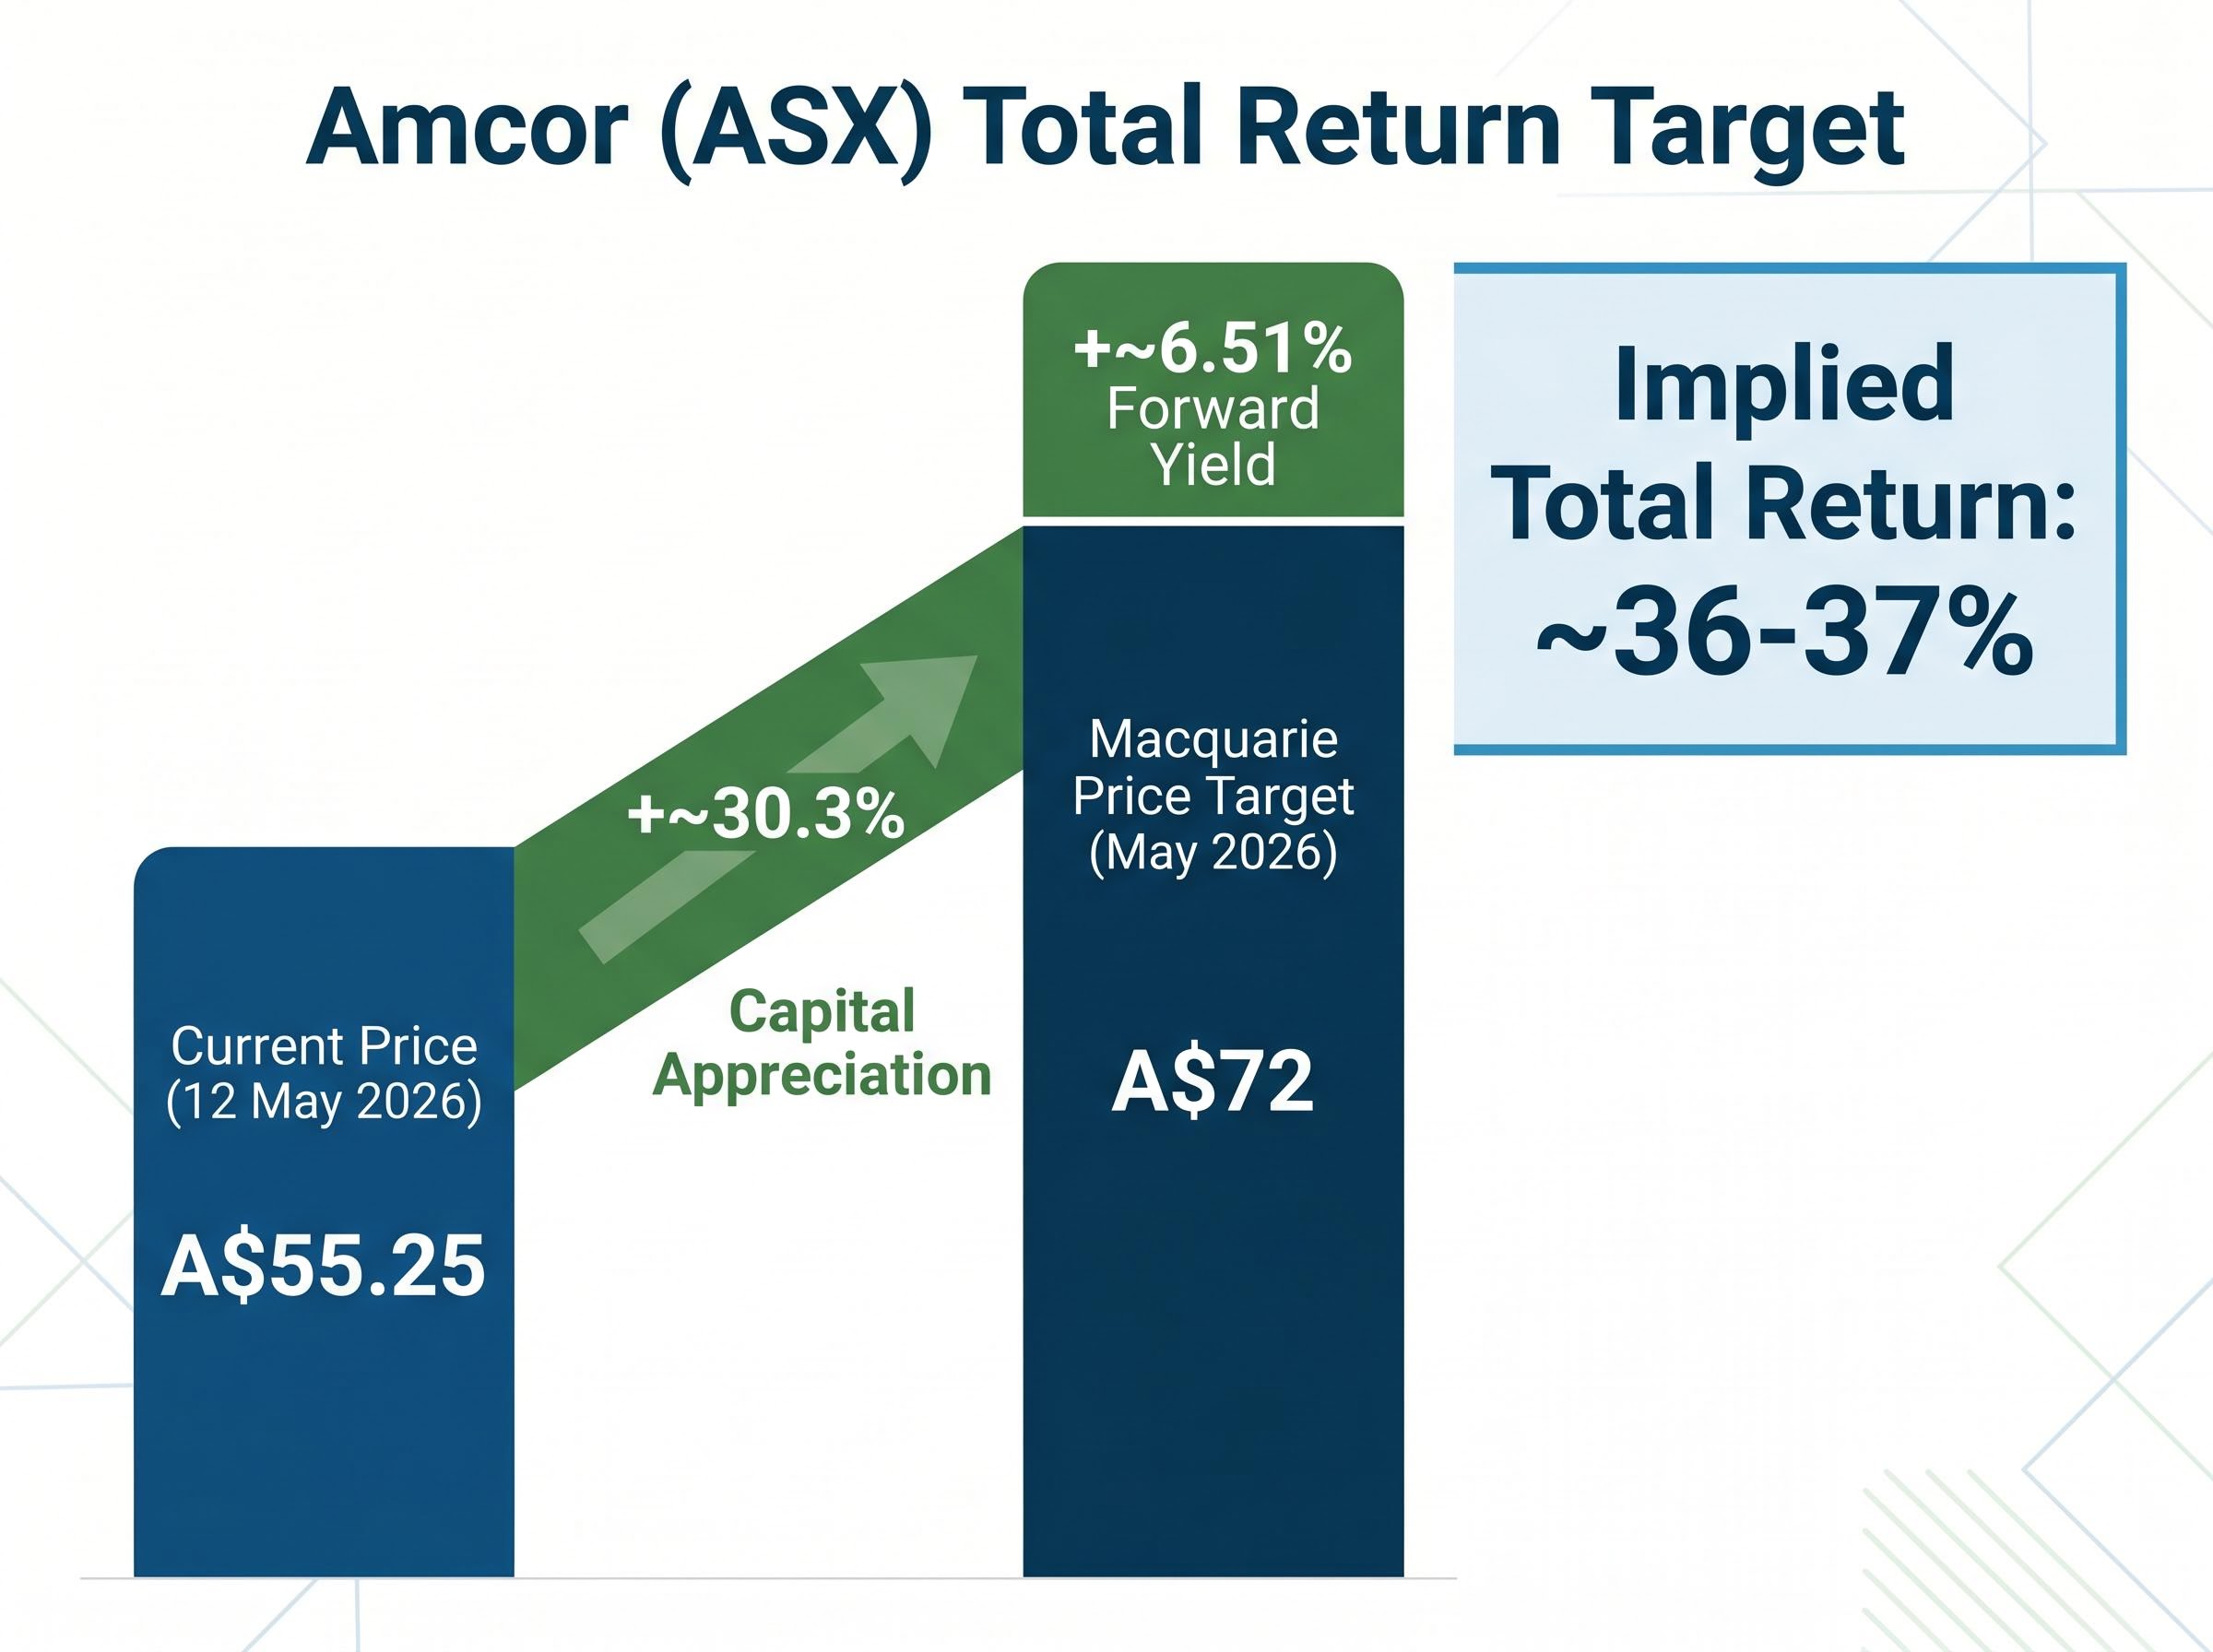
Amcor shares have recovered +10.78% year-to-date in 2026, trading at A$55.25 on the ASX as of 12 May 2026. Yet the stock sits roughly 23% below Macquarie’s A$72 price target, and its dividend yield of 6.47% is nearly 210 basis points above its five-year historical average of 4.38%. That gap between broker conviction and market pricing raises a direct question: is the market mispricing a global packaging company mid-integration, or does the discount reflect genuine risk the brokers are underweighting?
The Berry Global merger, which closed on 30 April 2025, created one of the world’s largest consumer packaging businesses. More than a year on, the combined entity is still being re-rated as integration costs flow through reported earnings and synergy delivery accelerates ahead of schedule. This is not the Amcor most ASX investors tracked for a decade. What follows is a framework built on the specific financial metrics that matter most at this stage of the cycle: earnings trajectory, leverage, dividend sustainability, and what broker targets actually imply for total return.
The Berry Global merger is not background context for this analysis. It is the analysis. Every financial metric published before 30 April 2025, and every five-year comparison chart a retail investor might pull up on a screening platform, requires recalibration against the combined entity’s new financial profile.
Three changes matter most:
Q1 FY26 net sales reached $5.75 billion (+68% versus the prior period), while adjusted EBITDA came in at $909 million (+92%). Both figures reflect merger-driven consolidation, not like-for-like organic growth.
The +10.78% YTD recovery to A$55.25 represents market stabilisation post-integration, not a full re-rating. Investors evaluating Amcor against its own history without accounting for the merger are measuring a different company.
The headline revenue growth is noise. The margin story is the signal.
Amcor reported adjusted EBIT margins of 10.4% in Q3 FY26, a 280 basis point improvement. That figure is the most credible evidence that integration execution is tracking well: procurement synergies, manufacturing rationalisation, and cost discipline are flowing through to operating profitability rather than being absorbed by integration friction.
Synergy delivery reinforces the picture. The FY26 target was updated to $270 million, exceeding the original $260 million projection. Q1 FY26 alone realised $38 million.
The gap between the 3.04% reported net profit margin and the improving adjusted EBIT trajectory is precisely where the valuation debate sits. Net profit margin has compressed from a three-year average of approximately 5.33%, driven by merger-related charges and one-off integration costs. That compression is accounting noise, not an operational deterioration signal. Adjusted EPS for the first nine months of FY26 reached USD $2.79, up 11% year-on-year.
| Metric | Value |
|---|---|
| Q3 FY26 adjusted EBIT margin | 10.4% (+280 bps) |
| FY26 synergy target | $270M (exceeded $260M original) |
| 9-month FY26 adjusted EPS | USD $2.79 (+11% YoY) |
| Net profit margin (current) | 3.04% (vs. ~5.33% 3-year avg) |
FY26 adjusted EPS guidance sits at $3.98-$4.03, implying approximately 12% growth. Management’s long-term projection of 10-15% EPS growth per annum provides the forward earnings case an investor is actually buying at today’s price.
Free cash flow guidance of $1.5-$1.6 billion for FY26 is the number that underpins both dividend sustainability and the capacity to reduce post-merger debt. Without that cash generation, neither the income thesis nor the deleveraging timeline holds.
A debt-to-equity ratio of 143% reads as alarming at first glance. For a global industrial in the first full year following a major merger, it requires context rather than reflexive concern.
Debt-to-equity benchmarks by sector vary considerably across the ASX, with capital-intensive industrials routinely carrying ratios that would be flagged as problematic in consumer or technology businesses, making cross-sector comparisons a common source of misreading when investors apply generic leverage thresholds to post-merger balance sheets.
Debt-to-equity and return on invested capital (ROIC), which measures how effectively a company generates returns from the capital deployed in the business, are the appropriate primary metrics for evaluating mature, capital-intensive industrials. Price-to-earnings ratios alone cannot capture the leverage dynamics and cash conversion efficiency that determine whether a company at this scale can service its obligations while investing for growth.
The relevant question is not whether 143% is high. It is whether cash generation is sufficient to reduce leverage on a credible timeline. Three figures frame the answer:
Simply Wall St flags that Amcor’s dividend is “not well covered by earnings or free cash flows” and that debt is not fully covered by operating cash flow. This represents a genuine near-term risk that should not be softened by the longer-term margin improvement story.
The distinction matters. Structural leverage (manageable with strong, recurring cash flow) is different from coverage risk (a short-term constraint where current cash generation is stretched across debt service, capital expenditure, and dividend payments simultaneously). Both are present here.
Amcor’s trailing dividend yield of approximately 6.47% (forward yield approximately 6.51%) sits well above its five-year historical average of approximately 4.38%. That 209 basis point spread is one of the most tangible signals in this analysis.
Yield spread: 6.47% current versus 4.38% historical average, a gap of more than 200 basis points.
In mature income stocks, a yield that elevated above its own history typically signals one of two things:
The current quarterly dividend is USD $0.65 per share (ex-date 28 May 2026; pay date 17 June 2026). Broker consensus from Jarden and Macquarie does not anticipate a cut, and the EPS growth trajectory supports medium-term sustainability. Simply Wall St’s coverage flag remains the counterpoint that income-focused investors should weigh rather than dismiss.
One dimension the yield comparison does not fully capture is the franking position on Amcor dividends: as a dual-listed company with its primary earnings base outside Australia, Amcor pays 0% franked distributions, which materially changes the after-tax income calculation for Australian investors in lower tax brackets or superannuation pension phase compared to an equivalent fully franked yield.
Macquarie’s May 2026 price target of A$72 implies approximately 30.3% capital appreciation from A$55.25. Combined with the forward yield of approximately 6.51%, the total return case at that target is roughly 36-37%.
The consensus tone is broadly positive. Analysts characterise current pricing as an attractive risk/reward entry point, but the thesis depends on integration delivery rather than a simple price-to-earnings re-rating.
ASX industrial turnaround valuations frequently sit at a discount to broker targets during the period when reported earnings are depressed by restructuring charges and margin recovery is visible in adjusted figures but not yet in statutory results, a pattern that Downer EDI’s current earnings cycle illustrates at a different scale and leverage profile from Amcor’s post-merger position.
Two variables underpin every bullish target. The first is FY26 synergy delivery reaching $270 million, which Q3 results suggest is on track. The second is sustained 10-15% EPS growth over the medium term, a projection that requires the margin expansion demonstrated in Q3 FY26 to prove durable rather than front-loaded.
Both assumptions connect directly to the leverage evidence from earlier sections. If synergy delivery falters, free cash flow compresses, and the deleveraging timeline extends, the A$72 target becomes difficult to sustain.
The bull case compresses into a single paragraph. Adjusted EBIT margins expanded 280 basis points in Q3 FY26. Synergies are exceeding the original target at $270 million. The yield premium of more than 200 basis points above the historical average offers income compensation while waiting for the re-rating. Macquarie’s A$72 target implies 30%+ upside, and the total return case (capital plus yield) reaches approximately 36-37%.
The bear case deserves equal clarity. Debt-to-equity at 143% is not fully covered by operating cash flow. The net profit margin has compressed to 3.04% from a three-year average near 5.33%, and while integration costs explain most of that gap, execution risk on a complex cross-border merger remains. Simply Wall St’s dividend coverage flag is a real constraint, not a footnote.
| Bull case evidence | Bear case evidence |
|---|---|
| EBIT margins +280 bps to 10.4% | Debt-to-equity at 143% |
| Synergies at $270M (above $260M target) | Net profit margin compressed to 3.04% |
| Forward yield ~6.51% vs. 4.38% average | Dividend not well covered by FCF (trailing) |
| Macquarie A$72 (~30.3% implied upside) | Cross-border integration execution risk |
Three forward indicators will determine which side of the trade proves correct:
The investor profile best suited to this position is income-focused, long-horizon, and comfortable with 12-18 months of integration noise. The entry point offers a yield premium and broker-implied upside, but both require tracking the three indicators above at each quarterly result.
The discount to broker targets is real. The income premium above the historical average is real. The leverage and coverage risks are also real, and specific enough to monitor rather than dismiss.
Synergy delivery, deleveraging pace, and dividend coverage improvement remain the three variables that will shift this thesis in either direction. Quarterly earnings releases and synergy updates are the disclosure events that should prompt a reassessment. Investors seeking to deepen their evaluation framework may find related Rask Invest research on ASX industrials and blue-chip income stocks useful as a complement to this analysis.
Investors wanting to understand the broader ASX context in which Amcor’s re-rating is occurring will find our full explainer on ASX market breadth signals useful; it examines the week ending 1 May 2026 in detail, including which sectors are generating new lows and what the divergence between headline index performance and underlying stock breadth implies for individual stock positioning decisions.
This article is for informational purposes only and should not be considered financial advice. Investors should conduct their own research and consult with financial professionals before making investment decisions. Past performance does not guarantee future results. Financial projections are subject to market conditions and various risk factors.
The Berry Global merger closed on 30 April 2025 and created one of the world's largest consumer packaging businesses. It materially changed Amcor's financial profile, including a 7.25:1 share exchange ratio, making all pre-merger price comparisons non-comparable and inflating headline revenue and earnings growth figures through consolidation rather than organic expansion.
Amcor's trailing dividend yield of approximately 6.47% sits around 209 basis points above its five-year historical average of 4.38%, primarily because the share price has fallen faster than dividend growth during the post-merger integration period. This elevated yield could signal either an attractive entry point or a warning that the payout is stretched beyond what cash generation can sustainably support.
Amcor updated its FY26 synergy target to $270 million, exceeding the original $260 million projection, with $38 million realised in Q1 FY26 alone. Management's ability to sustain and grow this synergy run-rate into FY27 is one of the three key indicators that will determine whether the bullish broker targets prove justified.
A debt-to-equity ratio of 143% reflects the full weight of merger-related financing and is typical for a capital-intensive global industrial in the first full year after a major acquisition. The more critical question is whether Amcor's FY26 free cash flow guidance of $1.5-$1.6 billion is sufficient to reduce leverage on a credible timeline rather than whether the ratio itself is high.
Amcor pays 0% franked distributions because its primary earnings base sits outside Australia. This materially changes the after-tax income calculation for Australian investors, particularly those in lower tax brackets or superannuation pension phase, compared to an equivalent fully franked yield from a domestic company.


