
The Memo That Halved Meta’s AI Infrastructure Cost Estimate
3 hrs ago
Downer EDI operates Melbourne’s entire tram network, produces passenger rail rolling stock for multiple Australian states, and manages utilities infrastructure across the country. Most Australian investors have never heard of it.
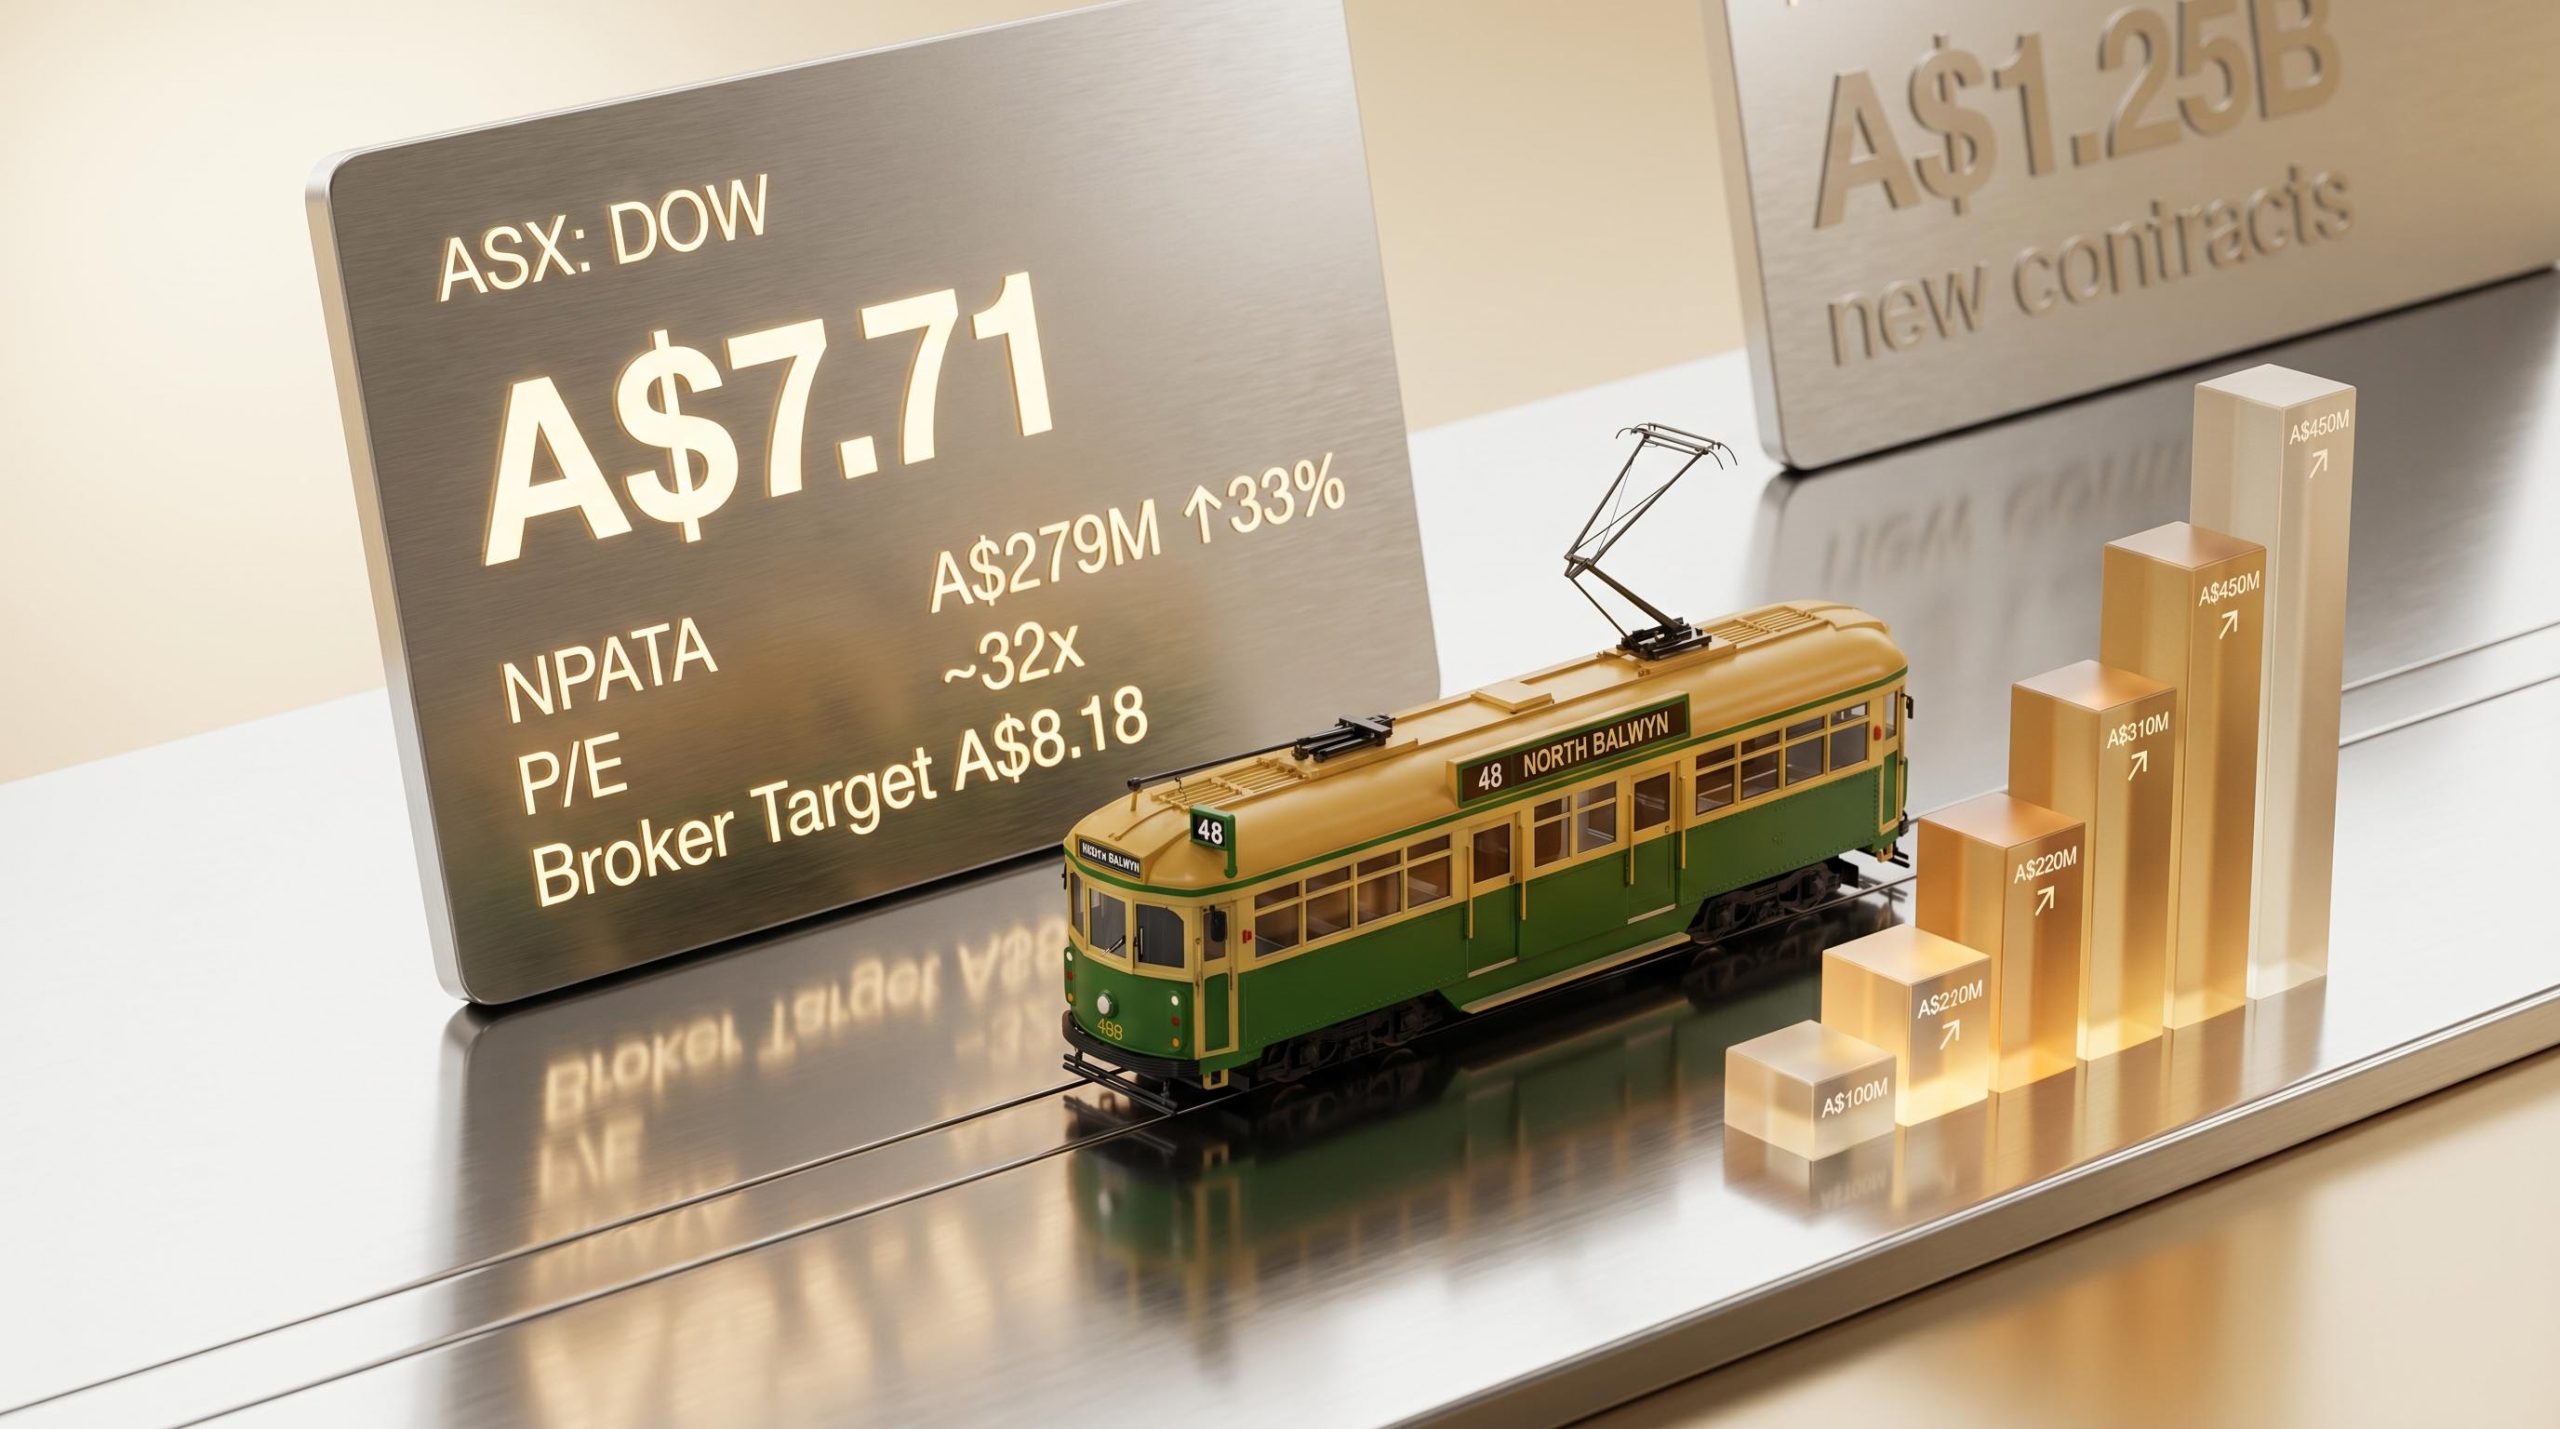
With a market capitalisation of A$5.23 billion and FY25 underlying profit up 33% year-on-year, Downer’s financial turnaround is now a matter of record. What remains contested is whether the share price, sitting at A$7.71 as of 11 May 2026 and carrying a trailing price-to-earnings ratio above 32x, reflects fair value or residual optimism from the recovery narrative.
This analysis examines Downer’s three operating divisions, stress-tests the headline profit improvement against margin and return-on-equity realities, and weighs the contract pipeline against the debt load to give investors a grounded view of the opportunity and its limits.
Downer EDI (ASX: DOW) touches more Australian infrastructure than its market profile suggests. The company operates across three divisions, each anchored to long-duration government and institutional contracts.
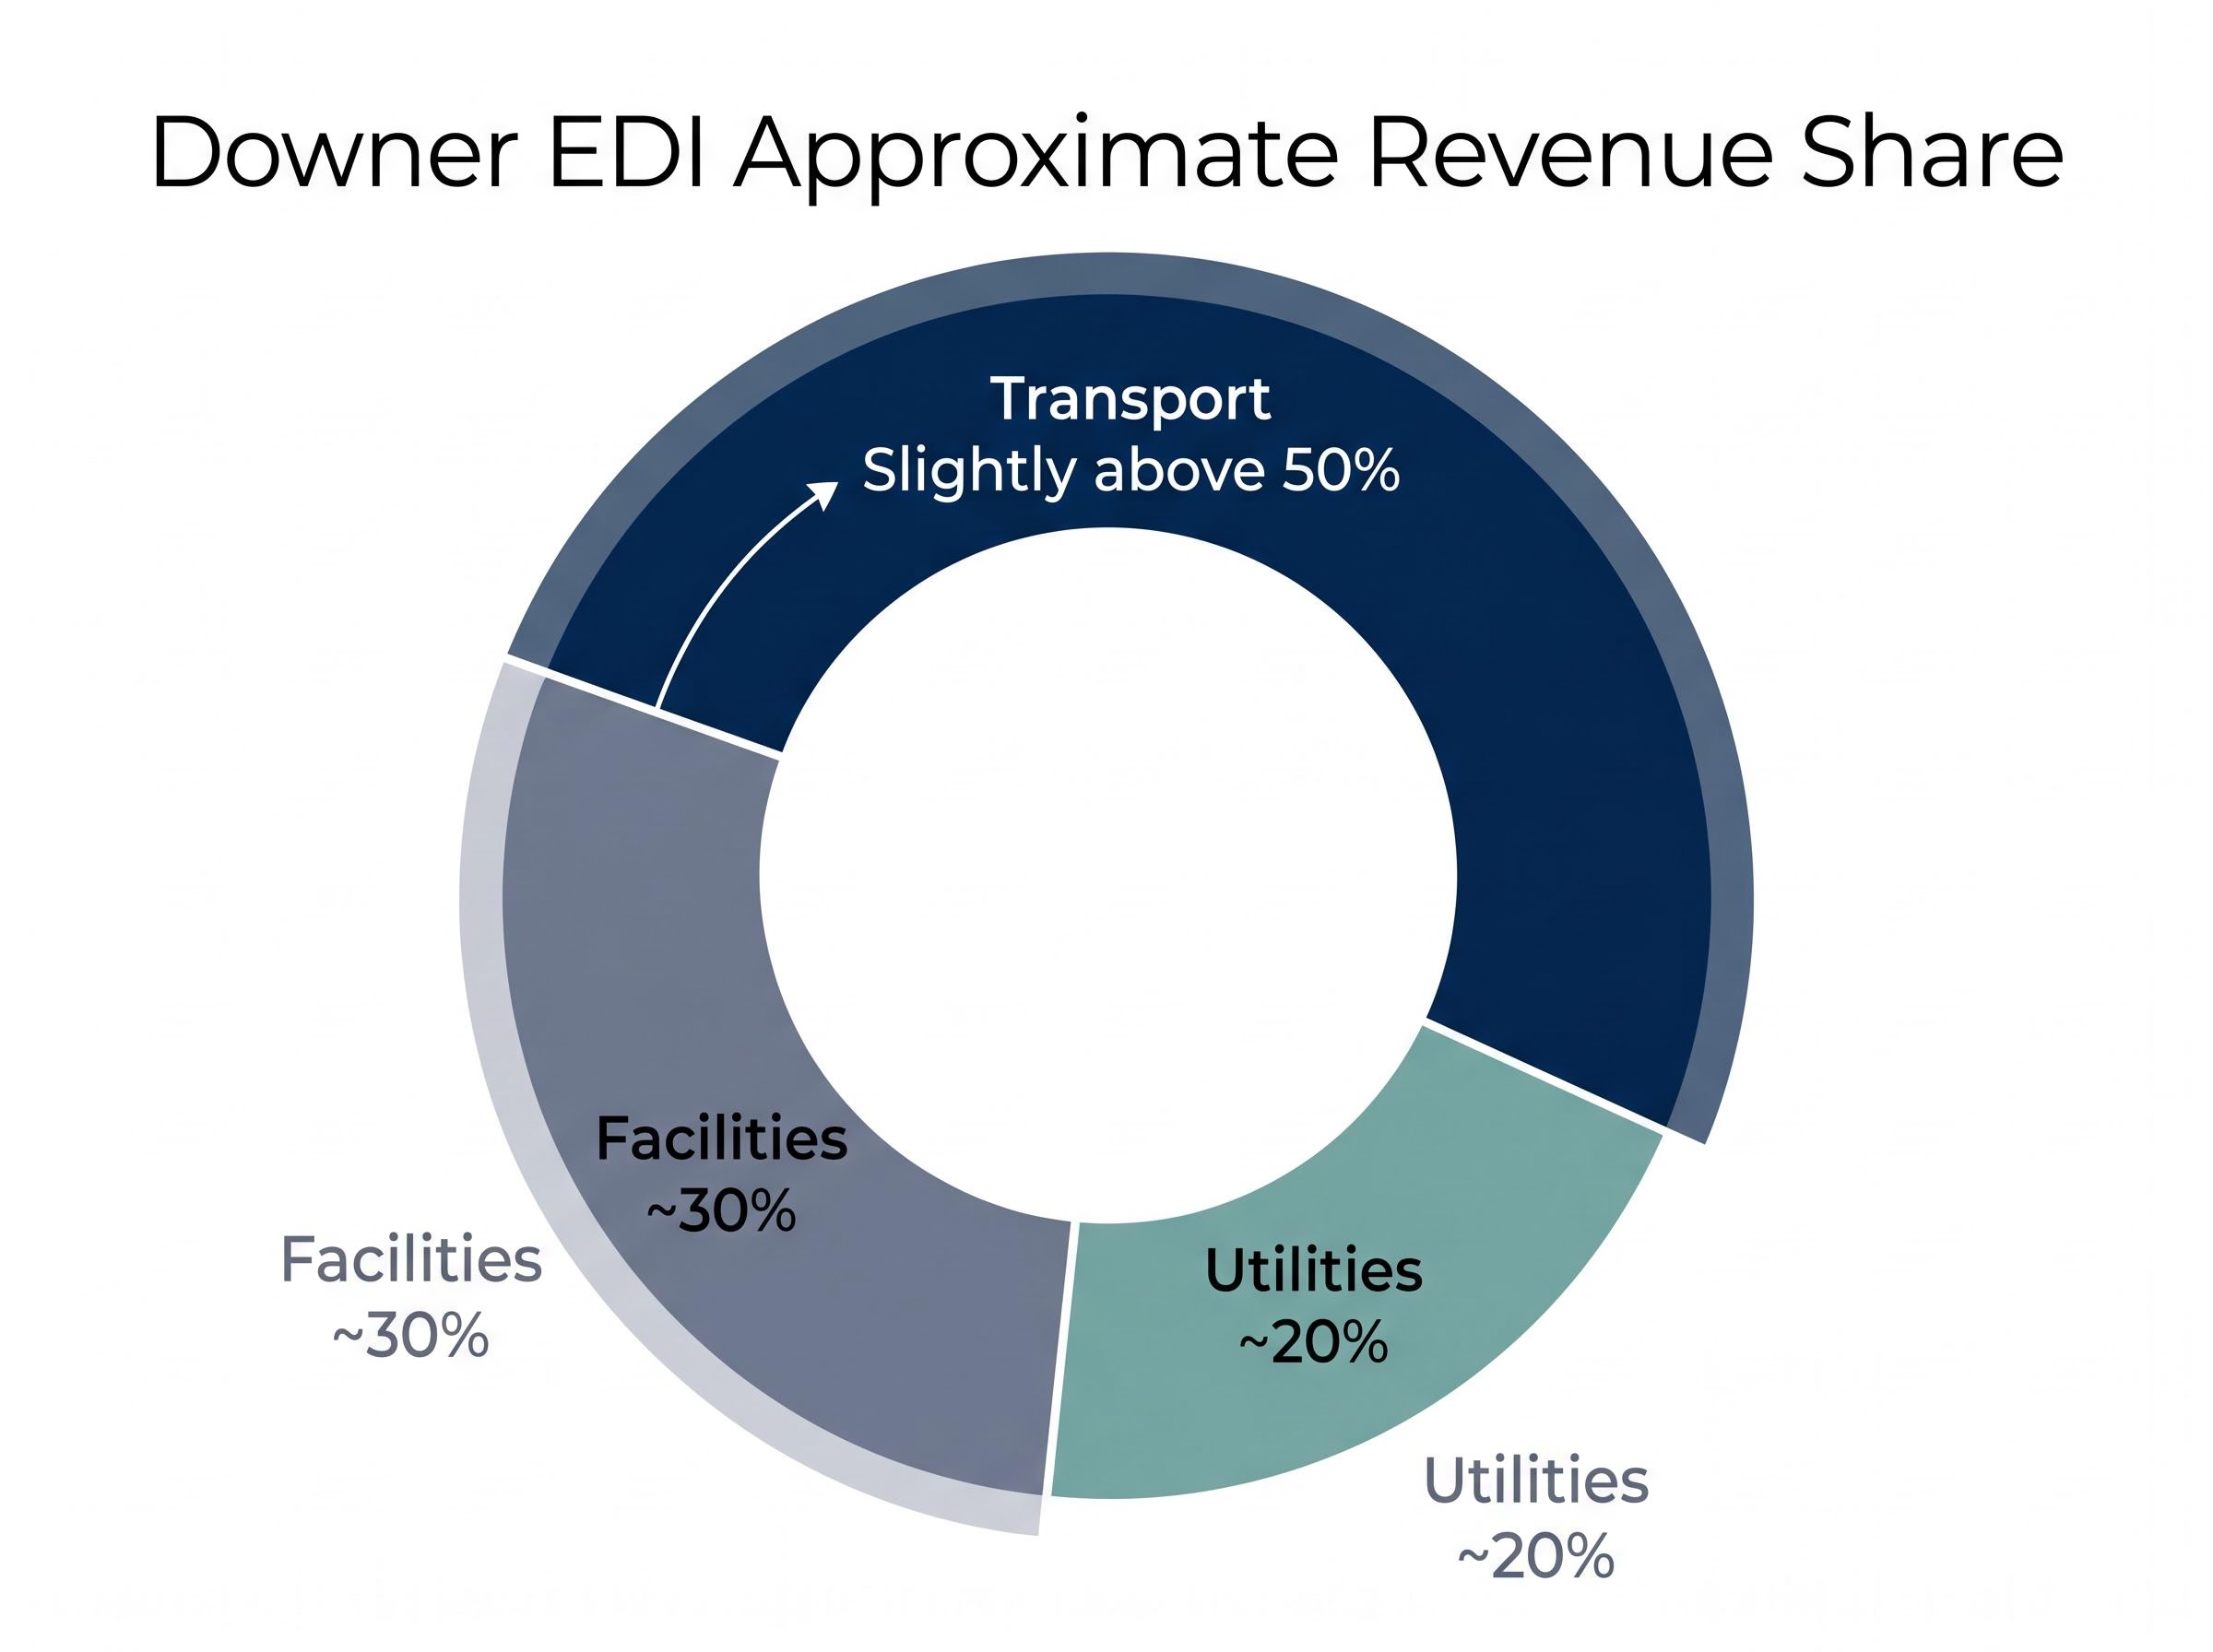
| Division | Approximate Revenue Share | Representative Operations |
|---|---|---|
| Transport | Slightly above 50% | Yarra Trams (Melbourne), passenger rail rolling stock across multiple states |
| Facilities | ~30% | Government building maintenance, commercial facilities management |
| Utilities | ~20% | Power, water, telecommunications (including NBN-related services) |
Transport alone accounts for more than half of total revenue. The physical footprint is enormous: tram networks, rail rolling stock, telecommunications infrastructure, government facilities. The consumer brand recognition is close to zero.
That asymmetry matters for investors. A company deriving the majority of its revenue from long-term government infrastructure contracts carries a fundamentally different risk character than a discretionary consumer business of comparable size.
The current three-division structure is not how Downer began. Over several years, management systematically divested the Mining and Laundry operations, shedding capital-intensive businesses with cyclical earnings profiles to concentrate on urban services infrastructure.
The rationale was straightforward: capital discipline and margin focus. The Downer that trades today is the product of deliberate simplification, not original design.
The headline figures are strong and worth letting land.
A$279M underlying NPATA, up 33% year-on-year, alongside a 46.5% dividend increase to 24.9 cents per share.
That is a genuine earnings recovery. The dividend increase signals management confidence in the sustainability of the improvement. For investors who held through the FY24 trough, when return on equity (ROE) sat at approximately -2.6%, the rebound is material.
Then the margins arrive.
An EBITDA margin of 4.4% and net profit margin below 2% leave limited buffer against contract cost overruns. For a capital-intensive industrial generating billions in revenue, these are thin operating tolerances.
The return on invested capital (ROIC) of approximately 10.07% suggests that capital deployed in operations is at least covering its cost. That is a baseline, not a triumph. ROE remains below the 10% threshold typically associated with mature blue-chip industrials, and the swing from -2.6% in FY24 means the current figure sits against a severely depressed comparison point.
The recovery is real. Whether it is complete is the more difficult question.
Return on equity measures how effectively a company converts shareholder capital into profit. For a capital-intensive infrastructure business like Downer, where large sums of equity are tied up in equipment, contracts, and working capital, ROE reveals something that raw earnings growth cannot: whether the company is generating adequate returns relative to the capital base required to sustain operations.
The 10% ROE threshold for mature industrials is not arbitrary. It reflects the approximate cost of equity capital for ASX-listed blue chips, meaning a company earning less than 10% on its equity may not be adequately compensating shareholders for the risk of holding their capital.
Three inputs drive ROE improvement for an infrastructure business:
Downer’s FY25 ROE of approximately 7.8-9.26% places it below the blue-chip threshold but materially above the -2.6% recorded in FY24. Closing the gap to 10% would require sustained margin expansion, improved asset utilisation, or both, across multiple reporting periods.
The five-year average dividend yield of 3.7% provides further context: historical capital returns to shareholders have been modest. The ROIC of approximately 10.07% is a supplementary signal that operational capital is earning its keep, even as the equity return has not yet caught up.
For retail investors comparing Downer against other ASX industrials, ROE provides a single comparable lens that accounts for capital structure and the cost of sustaining the infrastructure asset base. A 33% improvement in profit is not the same as a 33% improvement in underlying business quality.
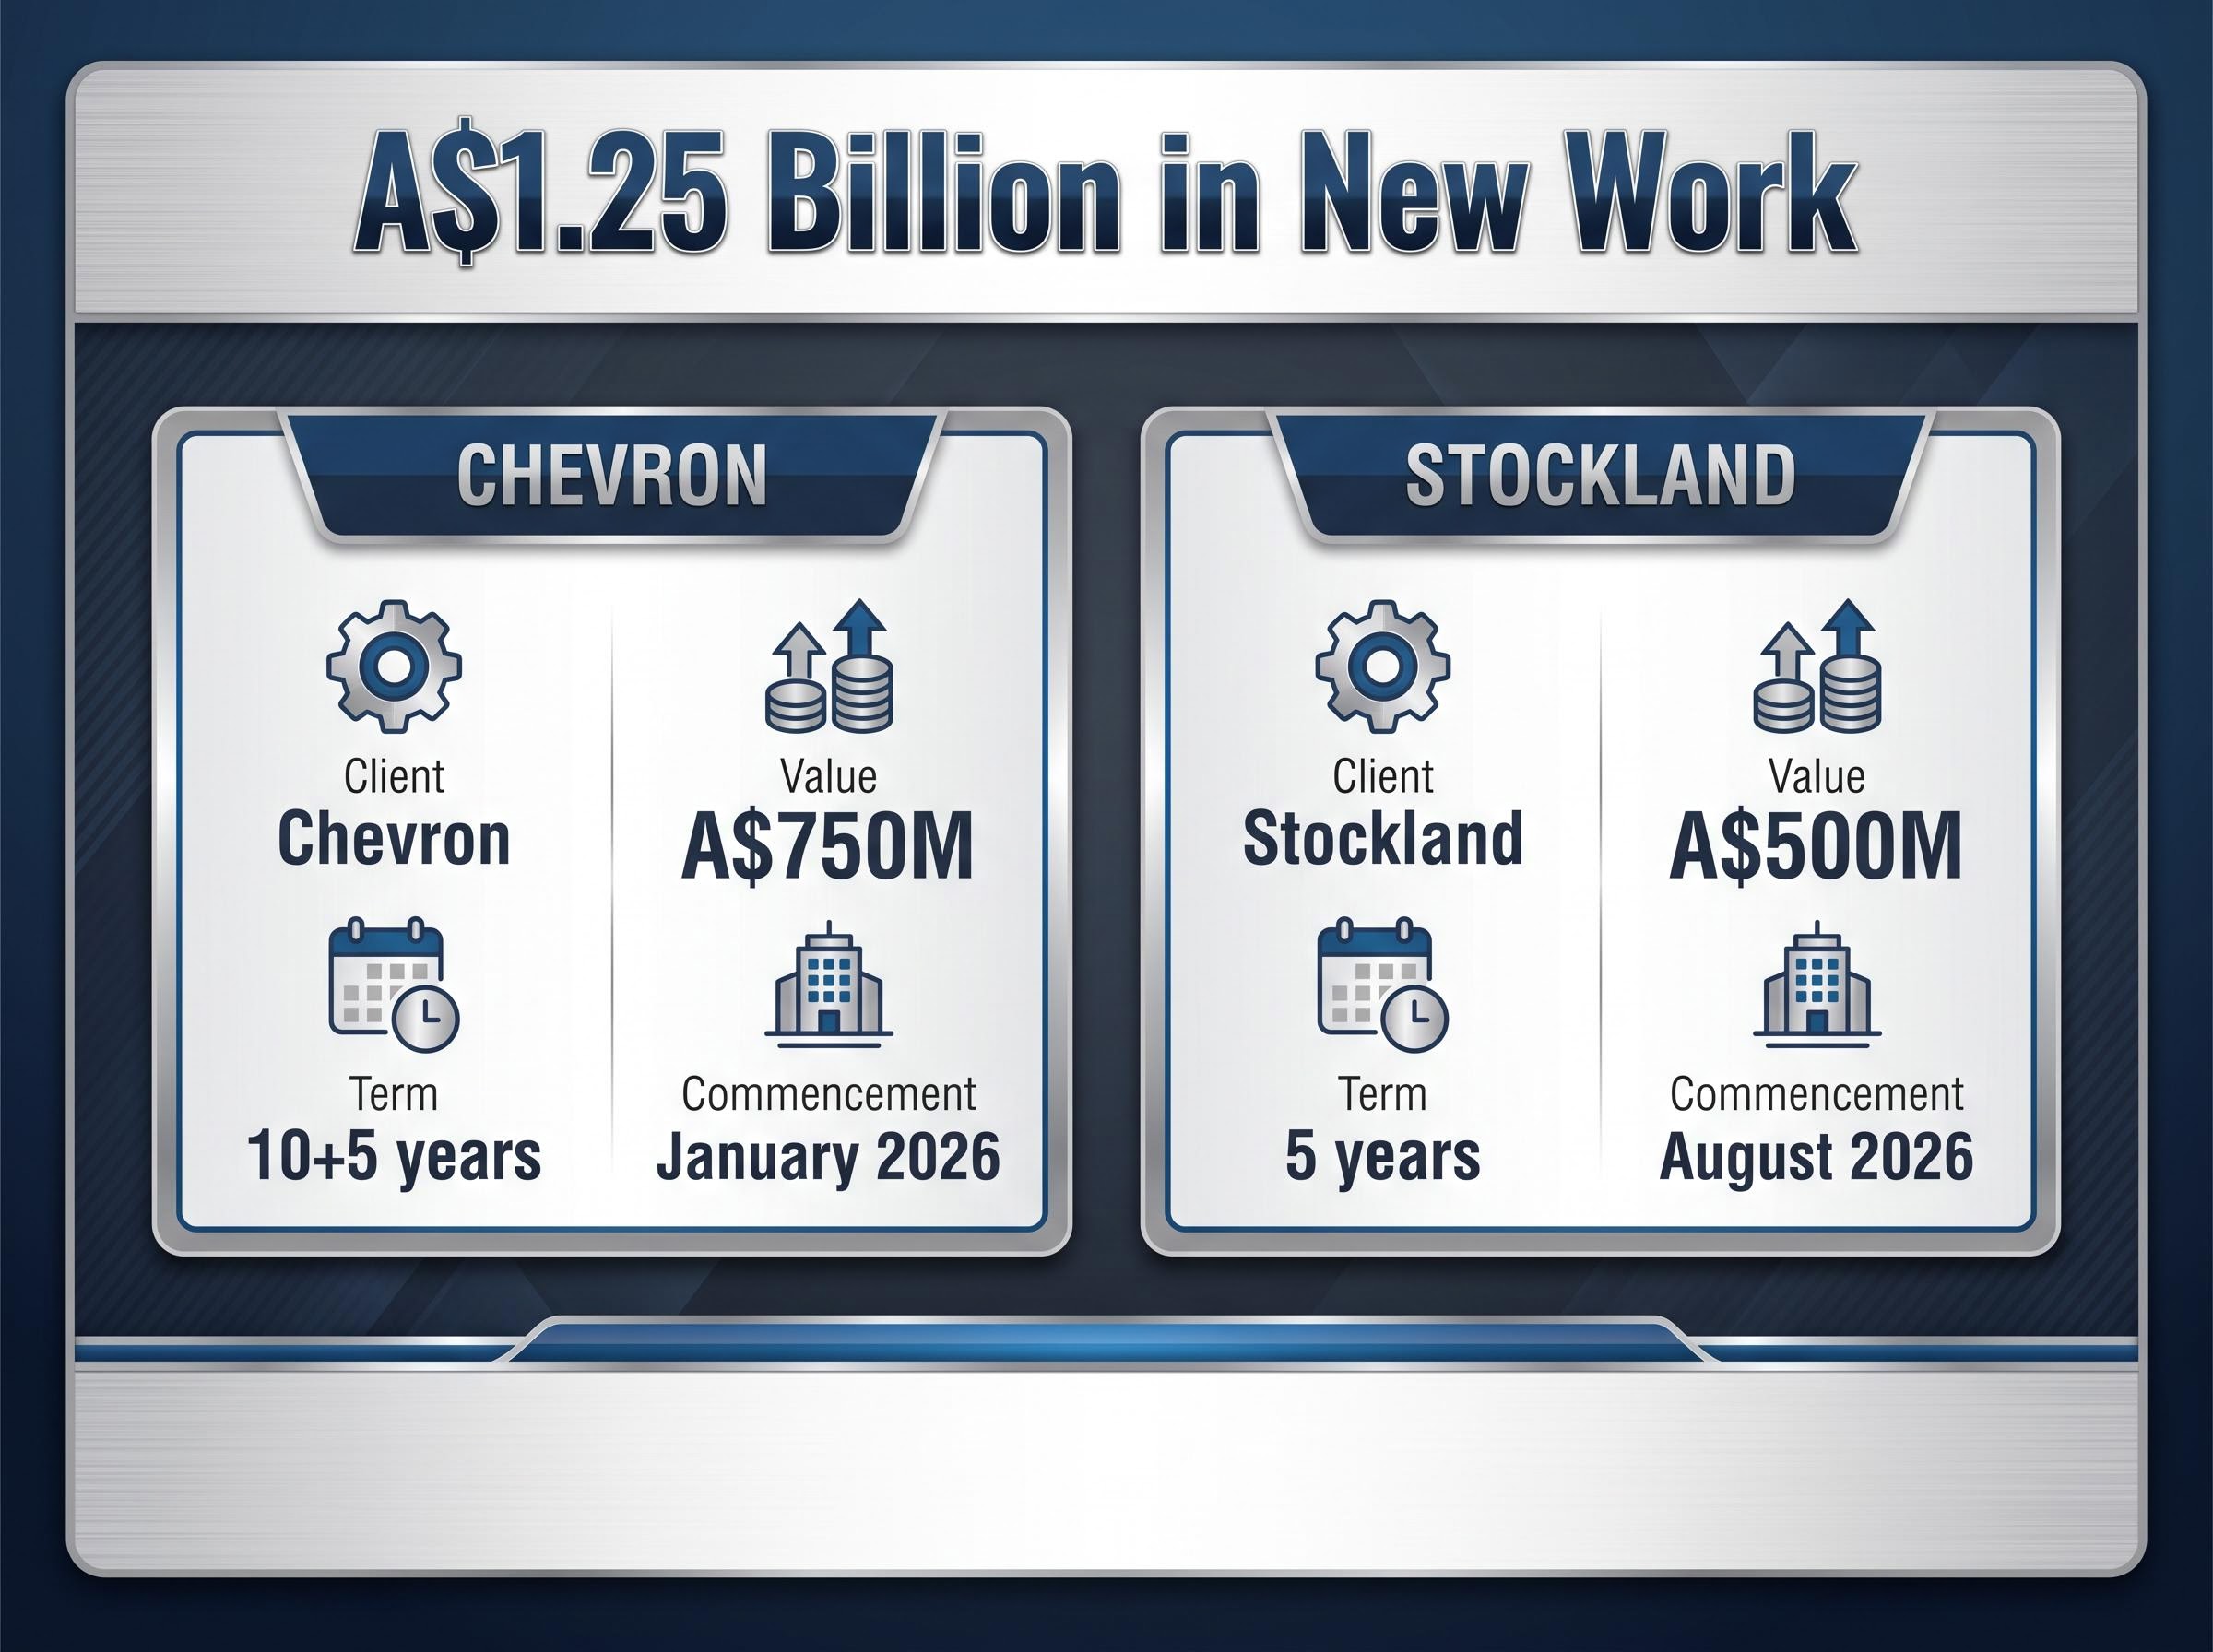
Two contract wins announced in the past twelve months give the bull case its most concrete foundation.
| Client | Contract Value | Term | Division | Commencement |
|---|---|---|---|---|
| Chevron | A$750M | 10+5 years | Utilities / Facilities | January 2026 |
| Stockland | A$500M | 5 years | Facilities | August 2026 |
A combined A$1.25 billion in new work, secured with blue-chip counterparties on multi-year terms, materially de-risks the revenue outlook for Downer’s two largest service divisions through to at least 2031. The Chevron contract alone, with its 10-plus-5-year structure, provides the kind of revenue visibility that infrastructure investors typically prize.
The Stockland facilities contract, which commences August 2026 and carries a five-year extension option through to 2036, will deploy Downer’s proprietary works management technology platform across Stockland’s commercial offices, shopping centres, logistics facilities, and land lease communities in four states, implying approximately $100 million in annual recurring revenue for the Facilities segment.
These wins sit within a broader structural tailwind.
Infrastructure funding in Australia has increased by A$29.1 billion (69%) since the 2022-23 Budget, with the sector projected to grow from A$180.78 billion in 2025 to A$256.14 billion by 2030.
Downer’s near-term pipeline is supported by both company-specific contract momentum and a macro environment where government spending on transport, utilities, and social infrastructure shows no sign of retreating. The revenue base is not dependent on a single budget cycle.
Infrastructure Australia’s 2025 Market Capacity Report identifies a five-year major public infrastructure pipeline of A$242 billion across 2024-25 to 2028-29, with utilities investment alone accounting for A$36 billion, a scale of committed spending that provides Downer’s service divisions with a deep and durable pool of contract opportunities beyond its current secured book.
Downer’s balance sheet has improved, but debt remains a structural feature of the business.
Total debt stands at A$1.33 billion against cash of A$684.3 million. The debt-to-equity ratio of approximately 61.69% in FY25 represents a meaningful improvement from 81.1% in FY24, reflecting management’s focus on deleveraging alongside the earnings recovery.
The debt refinancing completed in April 2026 adds further context to the balance sheet picture: Downer priced a $400 million seven-year Medium Term Note at 6.488%, replacing a maturing $500 million MTN facility and extending the weighted average debt maturity profile to approximately four years, a structure that materially reduces near-term refinancing pressure on a business operating at thin net margins.
Debt-to-equity benchmarks vary significantly across ASX sectors, meaning Downer’s ratio of approximately 61.69% in FY25 needs to be assessed against infrastructure and industrial norms rather than the broader market average, and comparing at least three to five years of balance sheets provides a more reliable picture of leverage trajectory than any single filing.
The connection between debt and margins is where the risk concentrates. With net profit margins at approximately 1.59%, debt servicing consumes a meaningful share of operating surplus. Any contract underperformance that compresses margins further would amplify through the income statement more sharply than it would for a less leveraged competitor with wider margins.
| Metric | Value |
|---|---|
| Trailing P/E | ~32.82-34.43x |
| Forward P/E | ~15.41-16.51x |
| PEG Ratio | ~1.42-1.54 |
| ROE | ~7.80% |
| Broker Consensus Target | A$8.18 (range: A$6.80 – A$8.75) |
The gap between trailing P/E of approximately 32-34x and forward P/E of approximately 15-16x is the central valuation question. The compression assumes a significant step-up in earnings. If management delivers on the trajectory implied by recent contract wins, Downer looks reasonably priced on a forward basis. If execution stumbles at thin margins, the trailing multiple leaves limited downside protection.
Broker consensus sits at approximately 5 Buy and 5 Hold ratings, with an average target of A$8.18, implying roughly 6.1% upside from the current price. That is not a unanimous bull case, but it is broadly constructive. The low target of A$6.80 represents the downside scenario; conditions that could drive toward that level include contract cost overruns, margin compression, or a broader de-rating of infrastructure services multiples.
The bull case rests on concrete foundations:
The bear case carries equal specificity:
The share price of A$7.71 sits near the top of its 2025 range of A$5.32 to A$8.04. Broker consensus of A$8.18 implies limited near-term upside. Downer suits investors comfortable with execution risk in a capital-intensive industrial, who are prepared to assess the margin trajectory across the next two reporting periods before concluding that the turnaround is structurally embedded.
This article is for informational purposes only and should not be considered financial advice. Investors should conduct their own research and consult with financial professionals before making investment decisions. Past performance does not guarantee future results.
Downer is no longer the infrastructure business hiding in plain sight. The market has noticed the earnings recovery, the contract wins, and the sector tailwinds. The share price reflects that recognition.
The question for 2026 is whether operational delivery will validate it. Downer’s infrastructure role is structurally supported by government spending commitments that extend well into the next decade. Investment returns, however, depend on margin discipline at a level the company has not yet sustained through a full post-divestment cycle.
The FY26 interim results will be the next meaningful test, showing whether margin improvement is holding under the new contract base. Full broker research from Macquarie Equities, Goldman Sachs Australia, Citi Research, and Bell Potter Securities provides the most complete risk and catalyst analysis for investors seeking institutional-grade depth.
Investors who take the time to understand Downer’s divisional structure, margin sensitivity, and contract pipeline are better positioned to evaluate whether any share price pullback in 2026 represents an entry point or a signal of deeper execution risk.
Return on equity (ROE) measures how effectively a company converts shareholder capital into profit. For Downer EDI, FY25 ROE of approximately 7.8-9.26% sits below the 10% threshold typically associated with mature blue-chip industrials, meaning the company is not yet fully compensating shareholders for the risk of holding their capital.
Downer EDI secured two significant contracts in the past twelve months: a A$750 million, 10+5 year contract with Chevron commencing January 2026, and a A$500 million, five-year contract with Stockland commencing August 2026, together representing A$1.25 billion in new long-duration work.
Downer EDI carries total debt of A$1.33 billion against cash of A$684.3 million, with a debt-to-equity ratio of approximately 61.69% in FY25. With net profit margins of only around 1.59%, any contract cost overruns could sharply amplify losses through the income statement.
Downer's trailing P/E of approximately 32-34x compresses to a forward P/E of approximately 15-16x, implying the market is pricing in a significant earnings step-up. If Downer delivers on its contract pipeline, the stock looks reasonably valued on a forward basis, but execution at thin margins remains the key risk.
Downer EDI operates across three divisions: Transport (slightly above 50% of revenue, including Melbourne's Yarra Trams and passenger rail rolling stock), Facilities (approximately 30%, covering government building maintenance and commercial facilities management), and Utilities (approximately 20%, covering power, water, and telecommunications).


