
The Memo That Halved Meta’s AI Infrastructure Cost Estimate
2 hrs ago
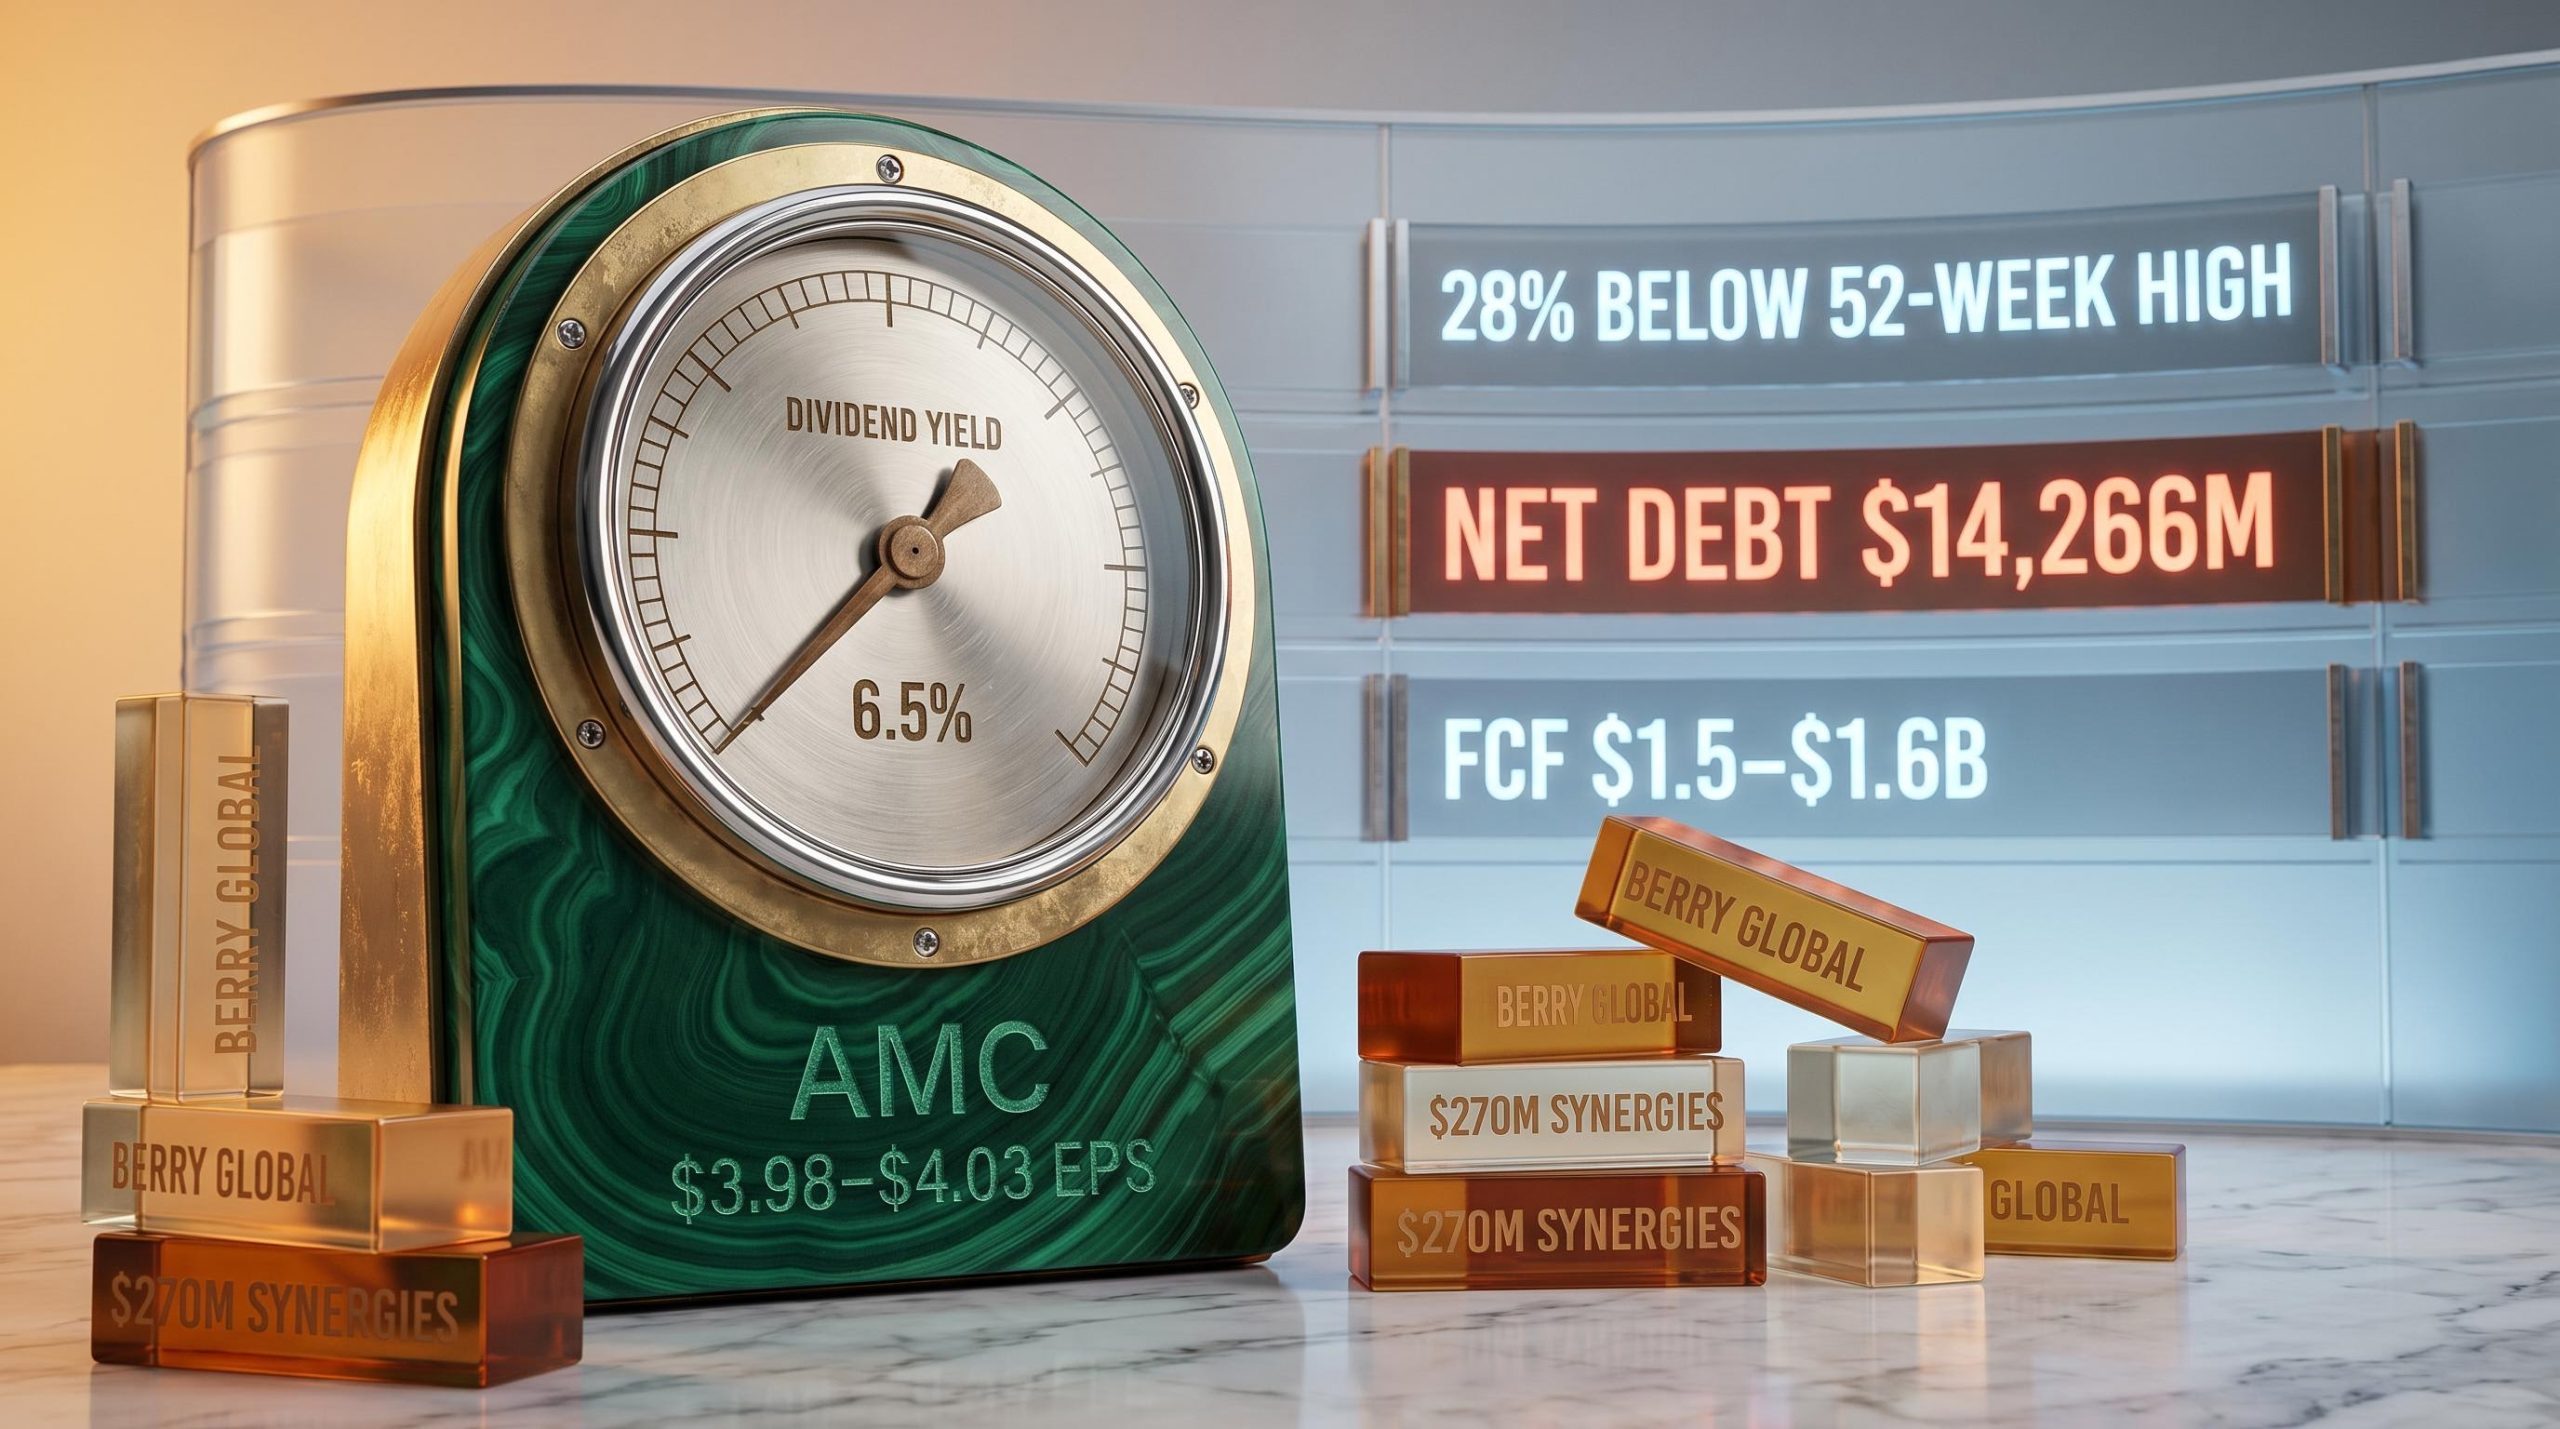
Amcor shares are trading roughly 28% below their 52-week high, yet the company reaffirmed full-year adjusted EPS guidance of $3.98-$4.03 in its May 2026 quarterly update and offers a forward dividend yield sitting near 6.5%. That gap between price and operational performance is exactly the kind of dislocation income investors spend their careers looking for.
The question is whether it represents an opportunity or a warning. Amcor is one of the world’s largest packaging manufacturers, ASX-listed under the ticker AMC, incorporated in Jersey, and operating across more than 200 facilities in 40 countries. The Berry Global acquisition has materially changed the company’s scale, earnings profile, and debt load. Australian investors face an additional consideration: Amcor dividends are entirely unfranked.
This analysis examines the current price discount alongside the dividend sustainability question, the balance sheet reality post-Berry, and the earnings trajectory that will determine whether this dislocation resolves in favour of patient buyers or vindicates the market’s caution.
The starting point is the discount itself. As of early May 2026, AMC shares sit approximately 28.2% below their 52-week high. That is not a rounding error or a sector-wide drift. It is a specific repricing that reflects a combination of forces acting on the stock simultaneously.
The causes are identifiable:
FCF guidance revision: FY2026 free cash flow guidance was revised down from $1.8-$1.9B to $1.5-$1.6B, a reduction of approximately $300M at the midpoint, attributed to Middle East conflict disruption.
The price decline, however, has not been matched by an earnings collapse. Q3 FY2026 adjusted EPS came in at $0.96, up 6% year on year. That divergence between falling price and rising quarterly earnings is what makes the current situation analytically interesting rather than straightforward.
The question of whether a share price move reflects genuine earnings damage or market overreaction to a specific event is a recurring challenge on the ASX: price declines that exceed fundamental impairment create temporary dislocations that resolve once the triggering event is clarified, but the same logic also applies to cases where the market is correctly pricing in risks that have not yet fully materialised in reported results.
The Berry Global integration is the single largest factor reshaping Amcor’s financial profile. Every headline growth figure in FY2026 needs to be read through that lens.
Year-to-date adjusted EBITDA reached $2,628M, up 88% on the prior corresponding period. Adjusted EBIT hit $1,977M, up 78%. Those numbers are real, but they reflect a full nine-month period of Berry consolidation compared against a partial prior-year period. The underlying organic growth rate is substantially lower than those percentages imply.
| Metric | YTD FY2026 | YoY Change |
|---|---|---|
| Adjusted EBITDA | $2,628M | +88% |
| Adjusted EBIT | $1,977M | +78% |
| Adjusted EBITDA Margin | 15.4% | +130 bps |
Margin expansion tells a more useful story. The adjusted EBITDA margin of 15.4%, up 130 basis points from 14.1% in the prior period, suggests the combined business is extracting operational efficiencies. A $78M restructuring charge in Q3 FY2026 confirms integration is still generating costs, but the direction of the margin trend is positive.
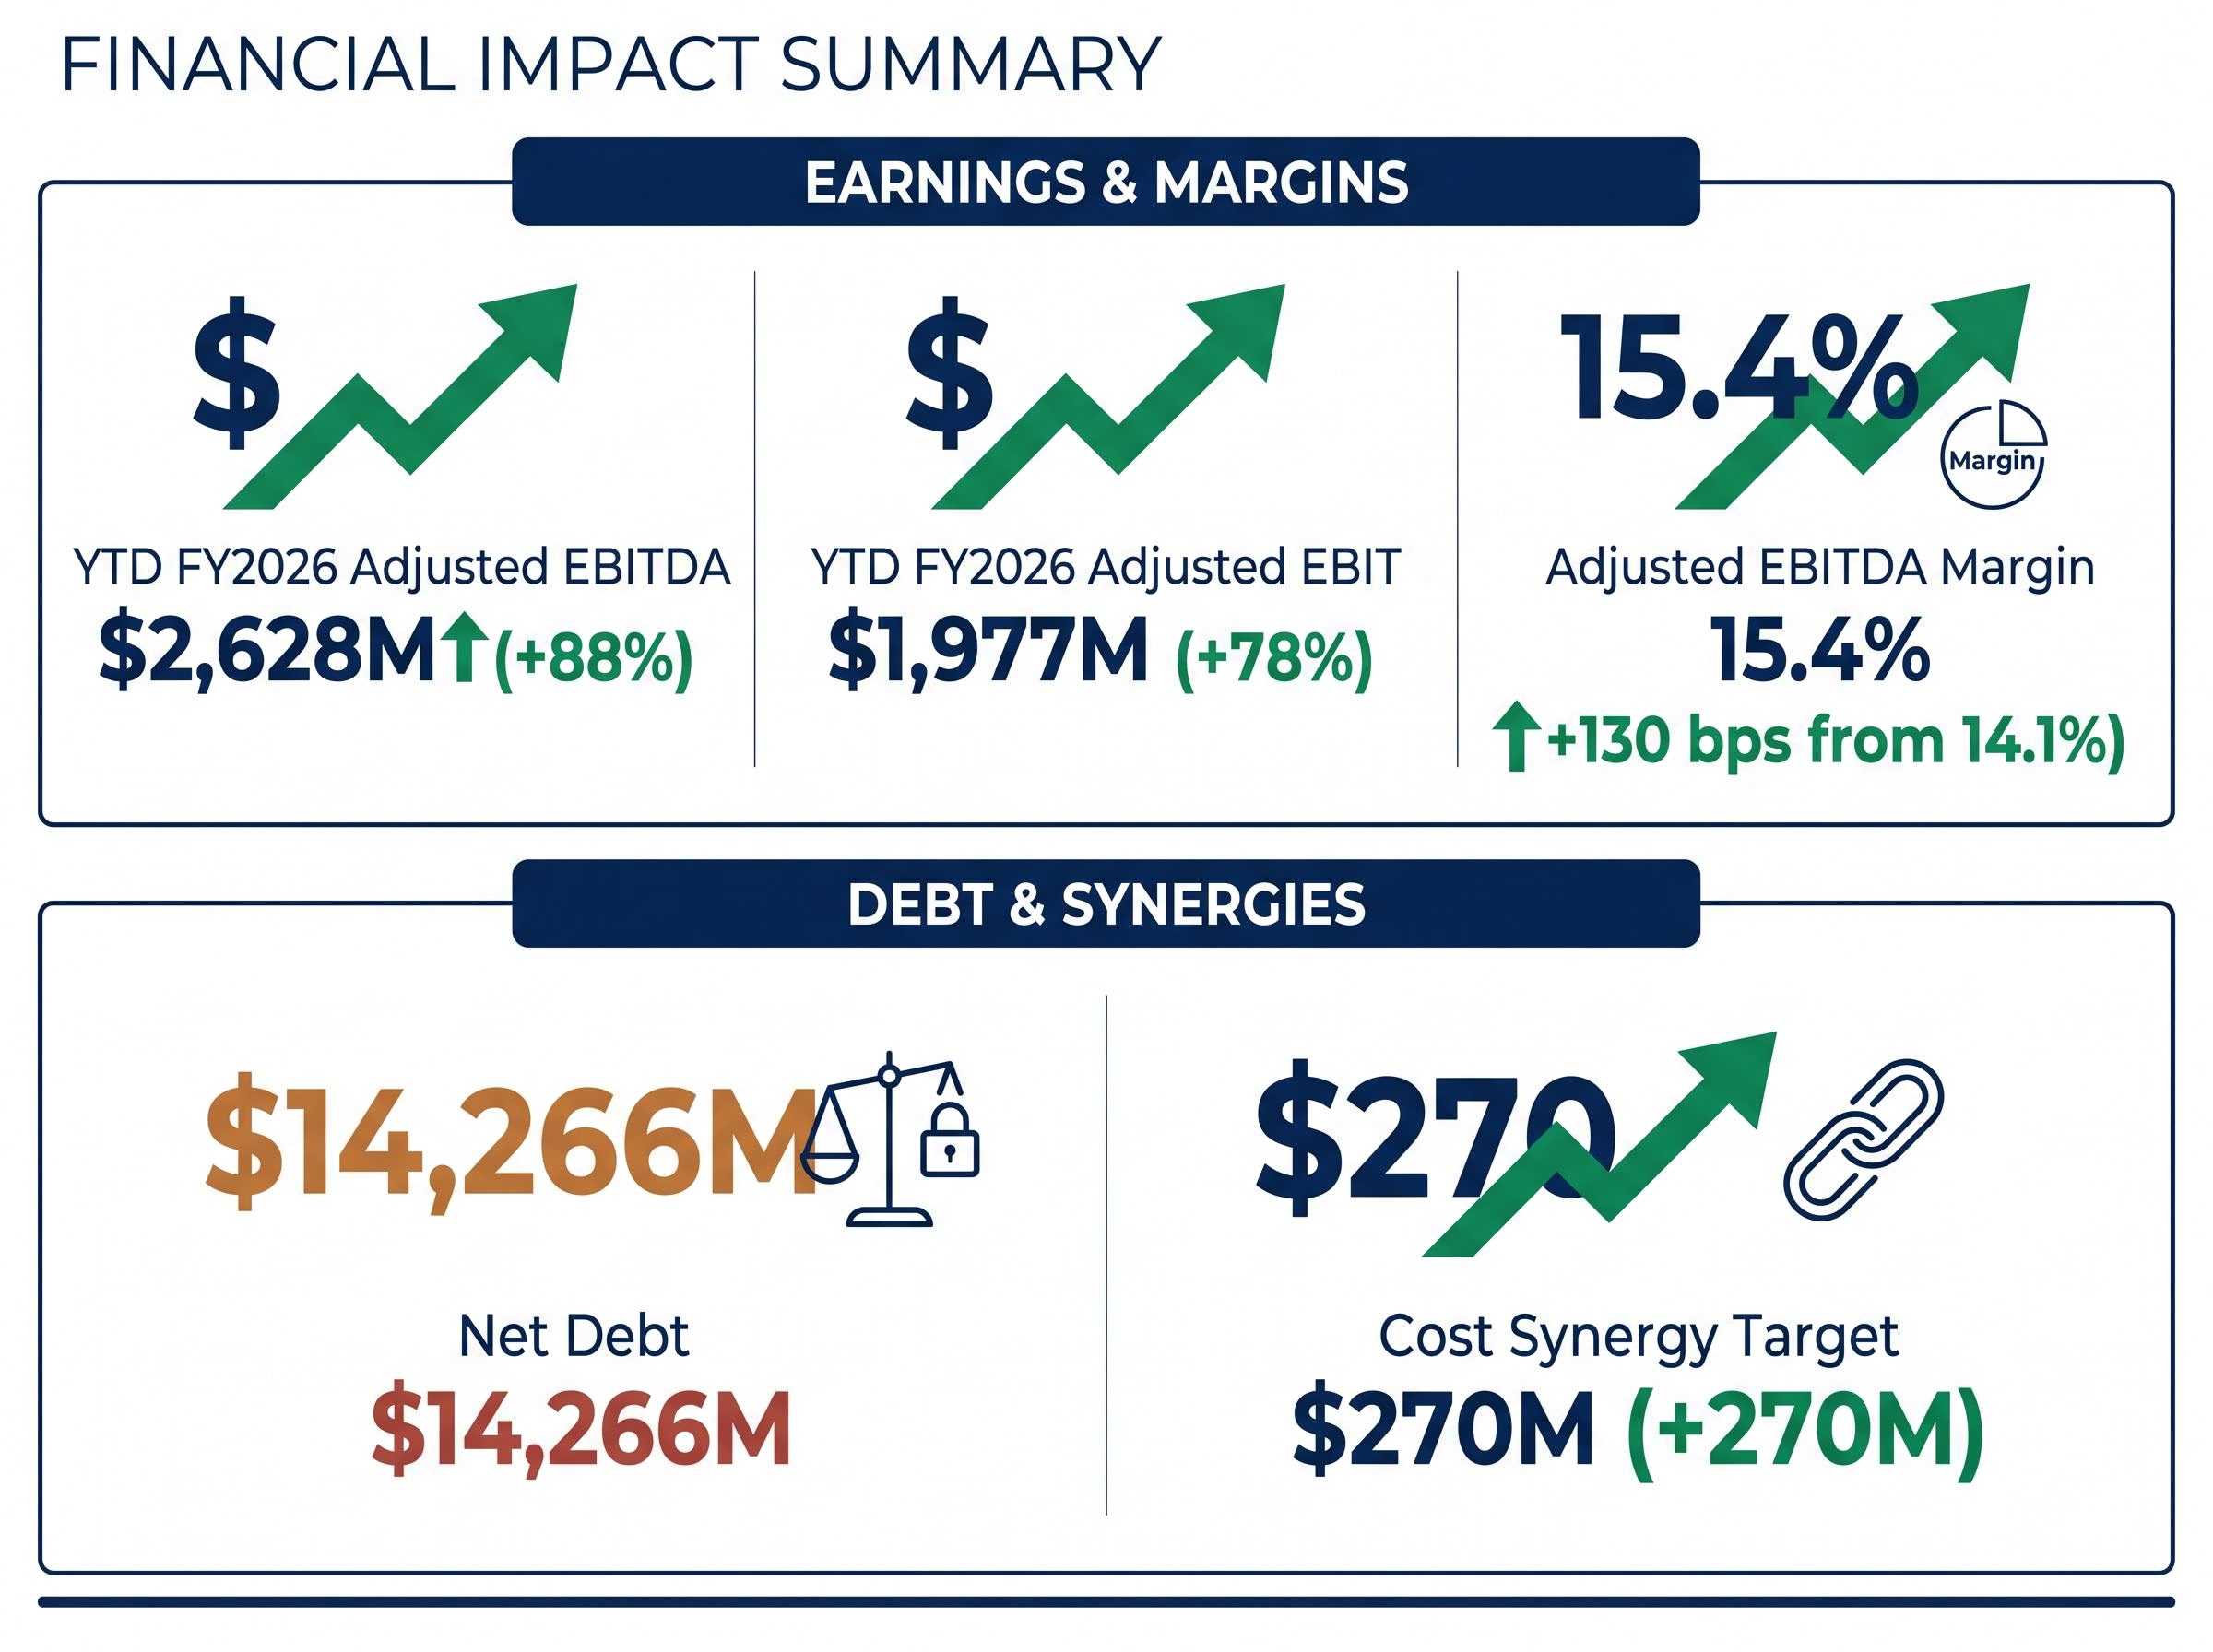
Synergy target: Amcor has identified $270M in cost synergies from the Berry Global combination, a figure that, if fully realised, would represent a meaningful forward earnings catalyst.
Investors reading the headline EBITDA growth without understanding its acquisition-driven composition risk overestimating organic earnings power, which directly affects any forward valuation model.
For investors less familiar with how to interpret debt-to-EBITDA leverage ratios in a post-acquisition context, sector benchmarks matter considerably: the same 5.56x figure that looks alarming for a mature consumer packaged goods company would be unremarkable for a regulated utility or a recently consolidated infrastructure business, and applying the wrong sector lens produces a materially different risk assessment.
Return on equity (ROE) measures how efficiently a company converts shareholders’ capital into profit. It is calculated by dividing net profit by total shareholders’ equity. A higher figure means each dollar of equity is generating more earnings.
For established industrial businesses, a 10% ROE is a conventional benchmark. Amcor’s FY2024 ROE of 18.4% comfortably exceeds that threshold, suggesting above-average capital efficiency for a company operating in a capital-intensive sector.
There is an important caveat. High debt reduces the equity denominator in the ROE calculation, which mechanically inflates the ratio. With $14,266M in net debt on the balance sheet as at 31 March 2026, Amcor’s ROE benefits from this leverage effect. That does not make the figure meaningless, but it does mean ROE should never be read in isolation.
A practical framework for using ROE in this context:
Amcor’s FY2024 ROE of 18.4% exceeds the 10% established-business benchmark, but is read alongside $14.3B in net debt, a level that mechanically inflates the equity return calculation.
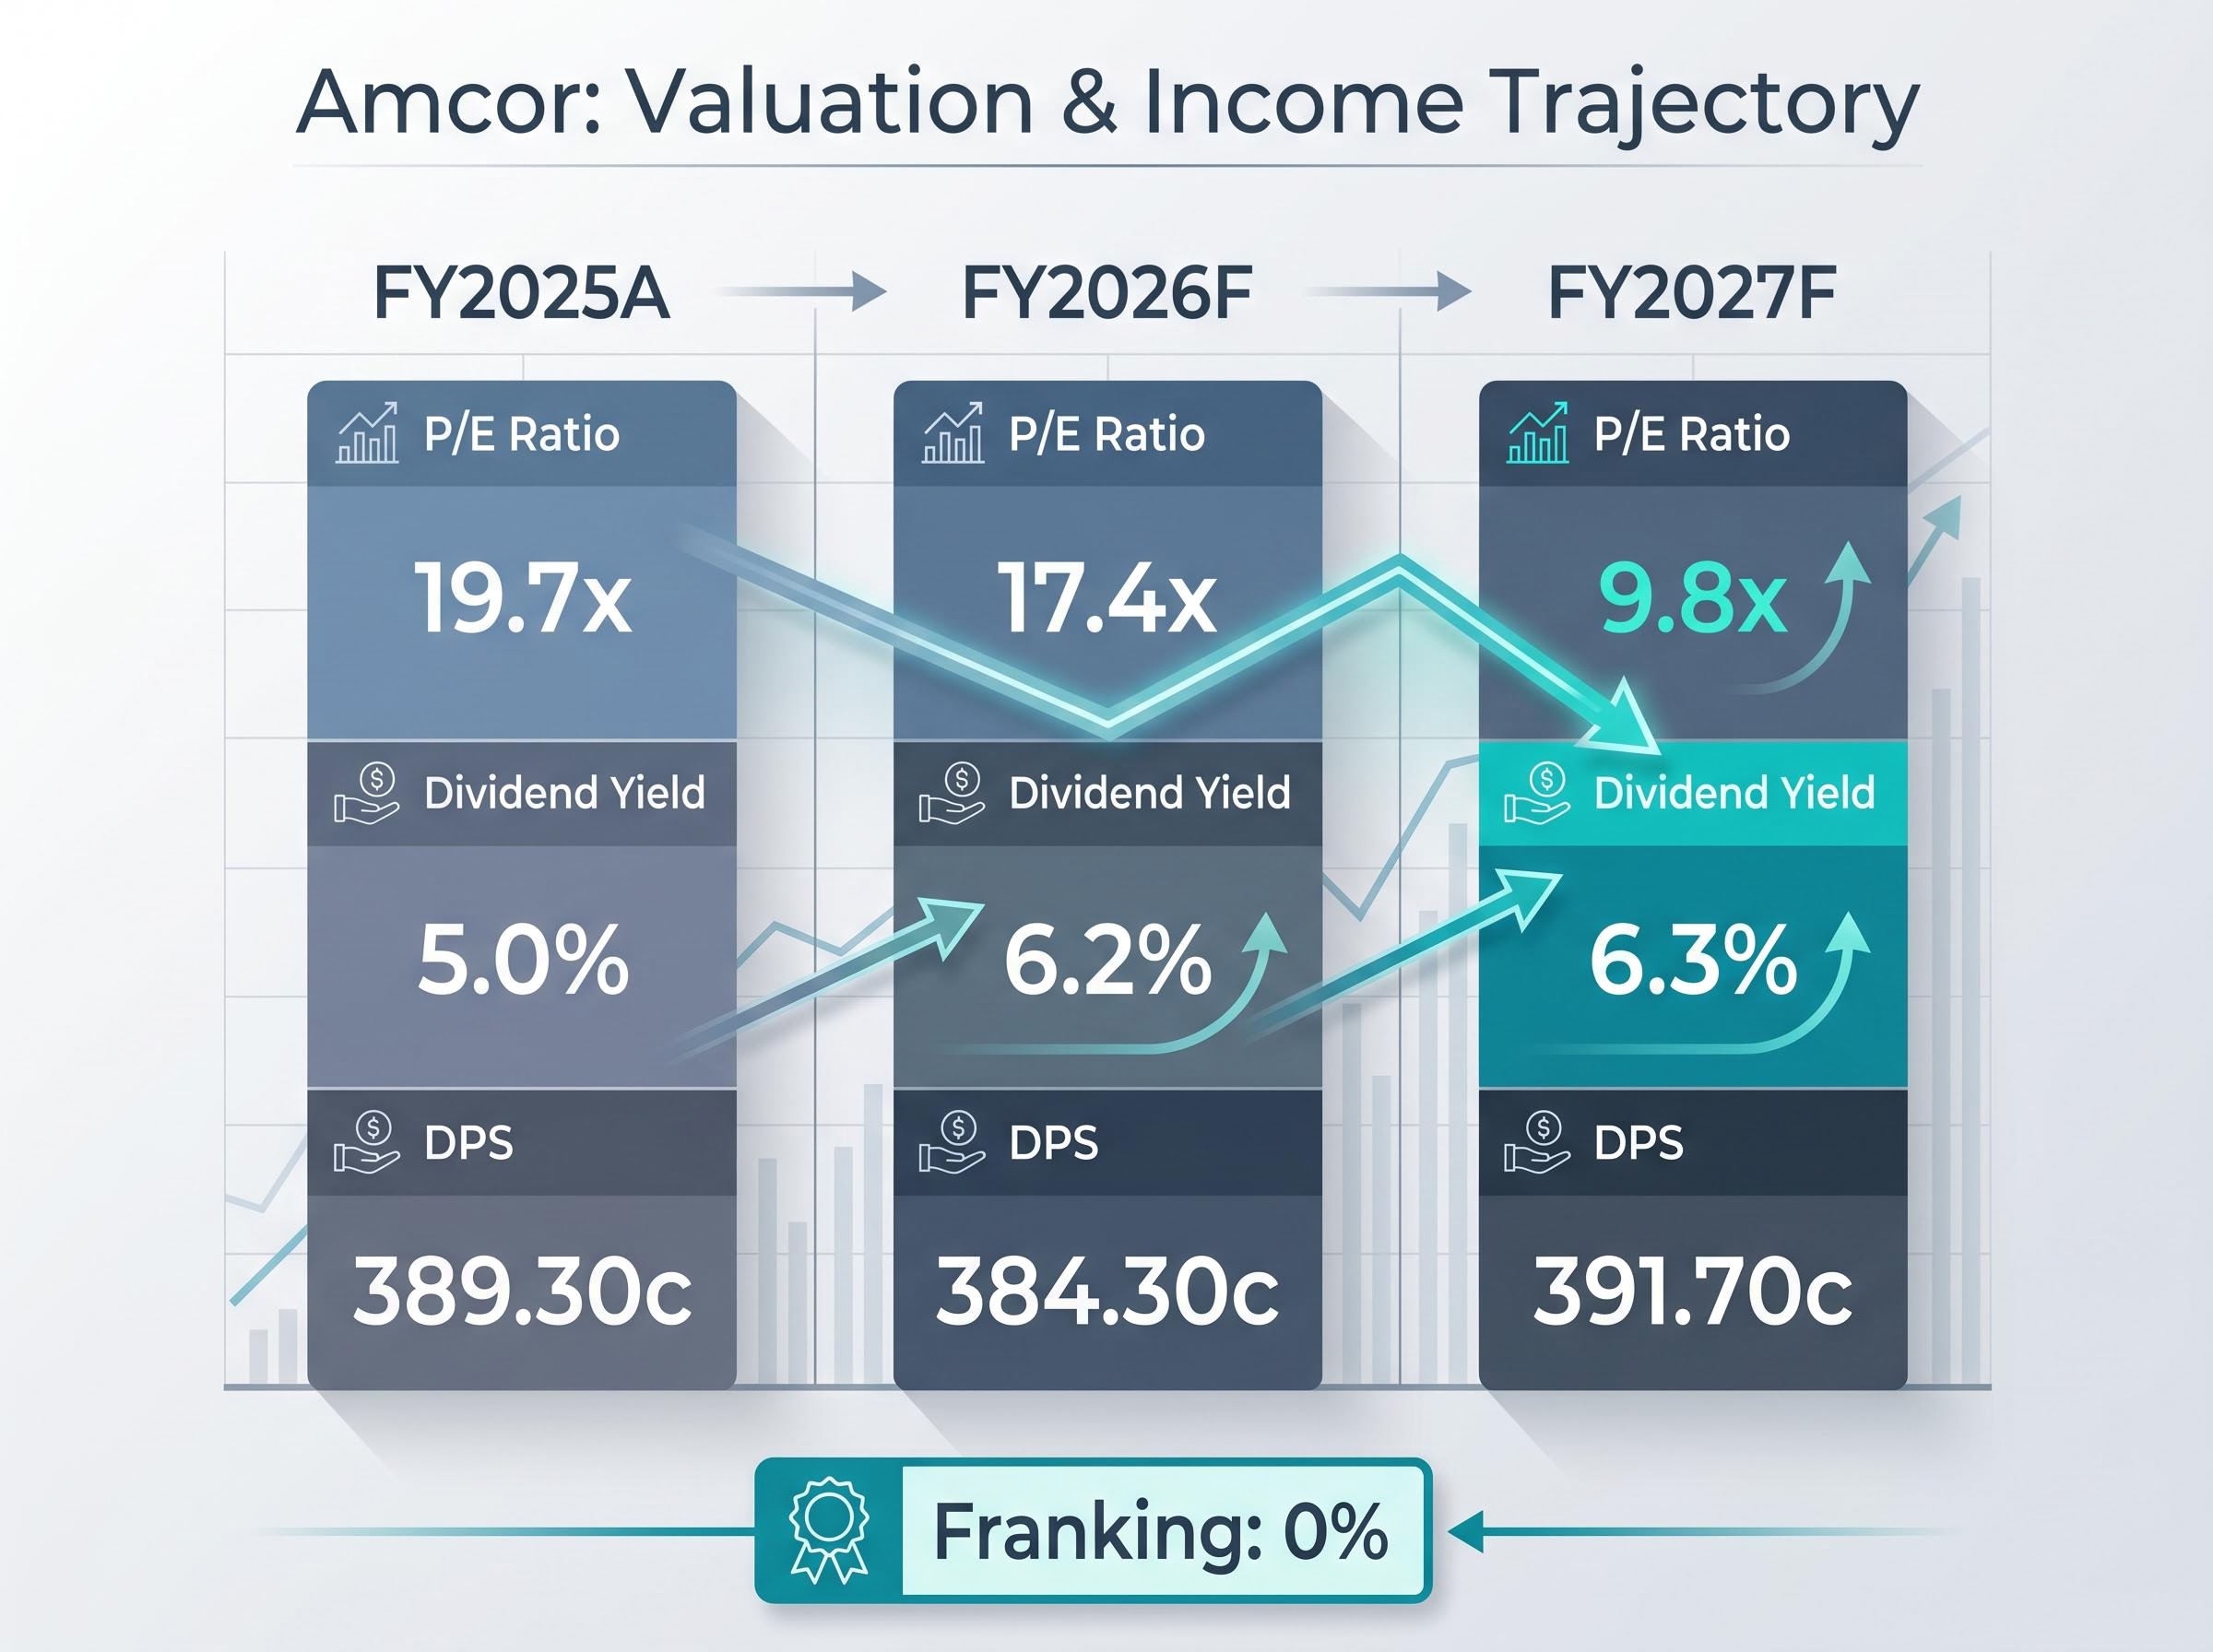
The income headline is genuinely attractive. Amcor’s forward dividend yield is estimated at approximately 6.2% for FY2026 and 6.3% for FY2027, based on Intelligent Investor consensus data. The latest quarterly dividend of 65 US cents per share is payable on 17 June 2026. Annualised DPS of approximately 384-392 cents represents a consistent payout record maintained since at least 2020, through a period that included a transformational acquisition.
The five-year average annual dividend yield from 2020 onward sits at approximately 4.4%, meaning the current yield is well above the company’s own recent history, a signal that either the market is pricing in more income for the risk taken or that the share price has overshot to the downside.
A rising yield driven by a falling share price is one of the most reliable dividend trap signals in income investing: the yield expansion reflects the market pricing in risk to the payout, not a genuine increase in income generation, which is precisely the analytical question Amcor’s current yield premium over its five-year average raises.
| Metric | FY2025A | FY2026F | FY2027F |
|---|---|---|---|
| DPS (cents) | 389.30 | 384.30 | 391.70 |
| Dividend Yield (%) | 5.0% | 6.2% | 6.3% |
| Franking | 0% | 0% | 0% |
| P/E Ratio | 19.7x | 17.4x | 9.8x |
The balance sheet introduces the complication. Net debt/EBITDA stands at approximately 5.56x as at 31 March 2026, above the sector median. Morningstar has flagged potential dividend cut risk due to this leverage level. FY2026 FCF guidance of $1.5-$1.6B, already revised downward, must service both debt obligations and the dividend payout.
Zero franking: Amcor dividends carry 0% franking. For Australian resident investors, this means no franking credit offset against income tax, which reduces the effective after-tax yield relative to franked alternatives paying the same headline rate.
The ATO dividend taxation rules confirm that unfranked dividends received by Australian resident investors are taxed at the investor’s marginal income tax rate with no franking credit offset available, which is precisely the mechanism that widens the after-tax gap between Amcor’s headline yield and an equivalent franked dividend from a domestic industrial.
A 6.5% yield on an unfranked, highly leveraged stock is a materially different income proposition from a 6.5% yield on a franked, cash-generative business. Investors need that distinction to price the opportunity correctly.
The confirmed anchor for the forward case is Amcor’s own FY2026 guidance: adjusted EPS of $3.98-$4.03, representing approximately 12% growth at the midpoint versus FY2025. Management reaffirmed this range in the May 2026 quarterly update, which provides a degree of near-term earnings visibility.
The forward P/E of approximately 17.4x on FY2026 consensus estimates is unremarkable for a packaging industrial. What changes the picture is the FY2027 projection.
Analyst consensus from Intelligent Investor data projects EPS growth of approximately +77% in FY2027, driving the forward P/E down to approximately 9.8x. That compression, if it materialises, would represent a significant re-rating catalyst. Broker sentiment reflects this expectation:
The Middle East conflict remains an ongoing FCF risk that management has flagged but is partially mitigating through inventory management.
The FY2027 EPS step-up is contingent on full delivery of the $270M Berry Global synergy target through FY2026 integration activities. That target has not yet been confirmed as fully achieved.
Investors should monitor the FY2026 full-year results, expected in late August or early September 2026, for confirmation of synergy progress. If the $270M figure is tracking on schedule, the FY2027 earnings uplift becomes substantially more credible. If integration costs persist or synergies fall short, the forward P/E compression that underpins the bull case weakens accordingly.
The analytical tension in Amcor is genuine. Both the bull and bear arguments rest on verifiable data rather than sentiment.
| Bull Case | Bear Case |
|---|---|
| Price 28% below 52-week high with confirmed earnings growth | Net debt/EBITDA of 5.56x is elevated above sector median |
| Forward yield of 6.2-6.9% with consistent payout history | FCF guidance revised down to $1.5-$1.6B |
| FY2027 synergy-driven EPS uplift could compress P/E to 9.8x | Dividends are 0% franked, reducing after-tax yield for Australian investors |
| Broker consensus Buy with upside to AUD $72.65-$76.91 targets | Morningstar has explicitly flagged dividend cut risk |
The most direct test of dividend sustainability is the relationship between free cash flow generation and debt servicing. FY2026 guided FCF of $1.5-$1.6B must cover both debt obligations and the dividend. Investors weighing a position should focus on whether that FCF figure holds at the full-year result, and whether the trend line is moving toward or away from covering the total payout comfortably.
Research on high-dividend portfolios in early 2026 found that dividend-growth quality screening, which filters for payout sustainability and earnings coverage rather than headline yield alone, has historically produced stronger total returns than pure yield-chasing strategies, a finding that maps directly onto the tension between Amcor’s attractive nominal yield and its elevated leverage and FCF revision.
This article is for informational purposes only and should not be considered financial advice. Investors should conduct their own research and consult with financial professionals before making investment decisions.
The price dislocation is real. So is the balance sheet risk. Amcor offers a forward yield near 6.5% backed by a confirmed earnings growth trajectory and a synergy-driven catalyst on the horizon, but it carries $14,266M in net debt, revised-down FCF guidance, and zero franking for Australian investors.
The resolution of that tension depends on events that have not yet occurred. The FY2026 full-year results, expected in late August or early September 2026, will confirm whether free cash flow held within the $1.5-$1.6B guided range, whether Berry synergies are tracking toward the $270M target, and whether the dividend rate is maintained.
Australian income investors should adjust the headline yield downward mentally when comparing against franked alternatives. A 6.2% unfranked yield is not the same proposition as a 6.2% fully franked yield, and the difference matters at tax time.
Until the full-year numbers arrive, the investment case remains open rather than settled. The data to close it is months away.
Past performance does not guarantee future results. Financial projections are subject to market conditions and various risk factors.
Amcor's forward dividend yield is estimated at approximately 6.2% for FY2026 and 6.3% for FY2027, but all dividends carry 0% franking, meaning Australian resident investors receive no franking credit offset against their income tax obligations.
The Berry Global acquisition left Amcor carrying approximately $14,266 million in net debt as at 31 March 2026, pushing the net debt to EBITDA ratio to approximately 5.56x, which is above the sector median and is the primary lever behind Morningstar flagging potential dividend cut risk.
Management revised FY2026 free cash flow guidance from $1.8-$1.9 billion down to $1.5-$1.6 billion, citing higher inventory build caused by supply chain disruption linked to the Middle East conflict.
Amcor reaffirmed adjusted EPS guidance of $3.98-$4.03 for FY2026 in its May 2026 quarterly update, representing approximately 12% growth at the midpoint versus FY2025.
Amcor has identified $270 million in cost synergies from the Berry Global acquisition; if fully delivered, this synergy programme underpins analyst consensus projections of approximately 77% EPS growth in FY2027, which would compress the forward P/E ratio to approximately 9.8x.


