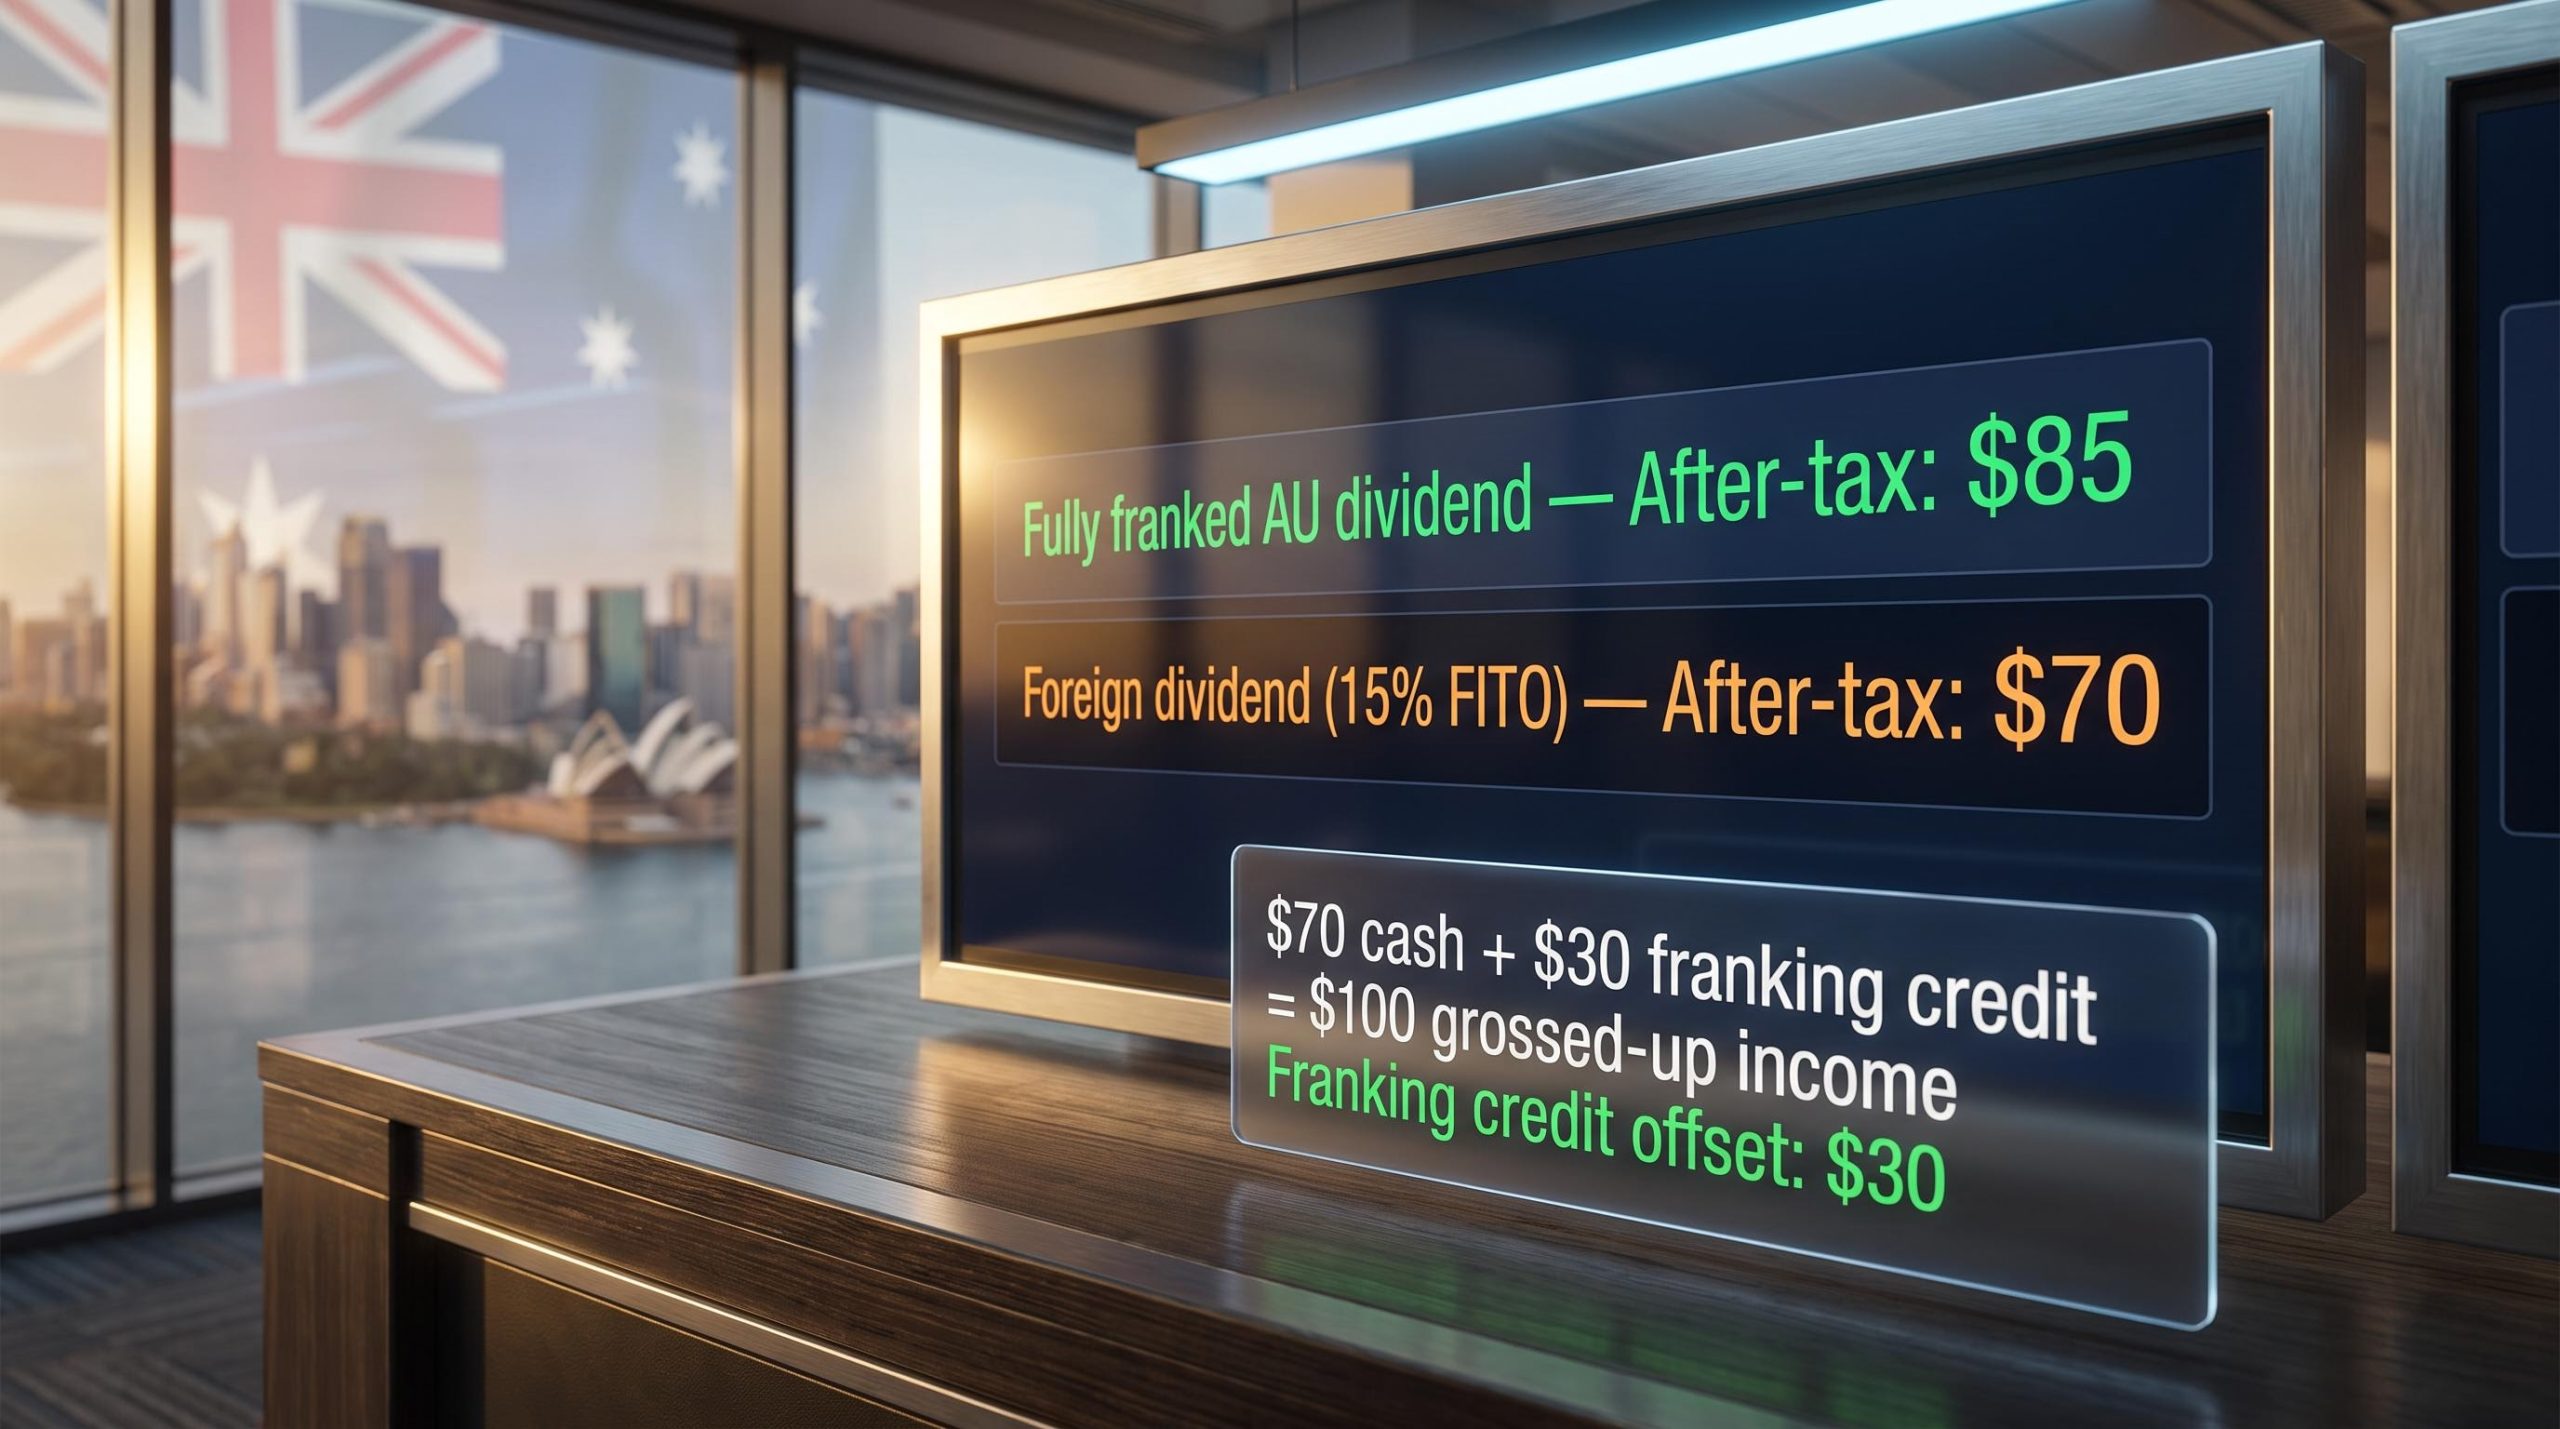
Across the past year, the US equity market rose by around 20% while Australian shares put up a comparatively modest 3%. If you have watched that gap widen and started wondering whether you should move everything into a global ETF, you are not being irrational. The logic makes sense on the surface.
Australia accounts for less than 2% of global stock markets by capitalisation. Many of the world’s most valuable companies are listed overseas. The last decade of return data appears to confirm the case for going all-global. The reasoning is intuitive, and it is also incomplete.
Here is what the data actually tells you when you look past the recent scoreboard: what a “global” ETF really contains, why Australian shares may be a stronger diversifier than the performance gap suggests, and how to think about the allocation decision with better information. This is a framework for a clearer choice, not a verdict.
Which market leads next decade? History says it is probably not the current winner
The assumption behind going all-global is that today’s winner keeps winning. The historical record says otherwise.
Cambridge Associates examined which country’s share market topped the performance rankings in each decade spanning the 1950s to the 2010s. The decade-by-decade results were as follows:

- 1950s: Japan
- 1960s: Australia
- 1970s: Japan
- 1980s: Sweden
- 1990s: The US
- 2000s: Australia
- 2010s: The US
No single country held the top position across consecutive decades over that entire period. Leadership rotated. Australia led in two of seven decades. The US led in two of the most recent three, which feels like momentum, but the full sequence tells a story of reversion, not persistence.
The Federal Reserve Bank of San Francisco’s long-run study (Jordà et al., “Rate of Return on Everything”) examined around 16 developed markets across roughly 145 years from 1870 to 2015. Australia placed fourth for real equity returns over that period, sitting behind only Finland, Sweden, and the US.
That places Australia among the top tier of global equity markets over more than a century, not a structural laggard having a bad decade.
There is a valuation dimension here as well. US equities, particularly in technology, currently trade at materially higher multiples than most other developed markets, including Australia. Elevated starting valuations make continued outsized gains more demanding. An investor concentrating in a US-heavy portfolio after a decade of US dominance is not making a neutral diversification decision. They are making a valuation-sensitive prediction that historical rotation has stopped. The long-run data suggests that is not a high-probability bet.
ASX sector divergence within a single financial year illustrates why headline index returns can mislead: in FY2026, a record 106.9-percentage-point spread between Materials and Health Care meant nearly 44% of ASX 300 companies finished negative even as the index posted an 8% gain, a reminder that sector exposure determines outcomes more than index-level direction.
When big ASX news breaks, our subscribers know first
The performance gap is real, but it does not tell the whole story
The numbers are large enough to feel decisive. Over 10 years to approximately mid-2025, two independent approaches measured the gap:
Morningstar estimates global shares returned approximately 12.5% p.a. and Australian shares approximately 11.1% p.a. including franking credits over the decade to June 2025.
A separate analysis found Australian shares at approximately 9.1% p.a. and global developed ex-Australia at approximately 13.3% p.a. in AUD with dividends reinvested over a comparable period. On a five-year total return basis, the S&P 500 produced a gain of approximately 88% against the ASX 200‘s roughly 45%, with both figures measured on a dividends-reinvested basis.
| Measure | Australian Shares | Global Shares |
|---|---|---|
| 10-year return (incl. franking credits, Morningstar) | ~11.1% p.a. | ~12.5% p.a. |
| 10-year return (AUD, dividends reinvested) | ~9.1% p.a. | ~13.3% p.a. |
| 5-year total return (S&P 500 vs ASX 200) | ~45% | ~88% |
The gap is real. But notice what happens when franking credits are included: the Morningstar figures narrow the annual difference to roughly 1.4 percentage points. Many performance comparisons omit franking credits entirely, which systematically understates the after-tax return Australian resident investors actually receive from domestic shares.
The question this leaves open is whether outperformance over the last decade tells you where returns will come from over the next decade, or whether it tells you something about where valuations sit now. Buying the recent winner at its current multiple is a different proposition than investing at the start of the run.
Franking credit calculations produce meaningfully different after-tax outcomes depending on an investor’s marginal rate, superannuation phase, and annual dividend volume; a fully franked $1,000 dividend is worth $1,428.57 to an SMSF in pension phase once the attached credit is refunded as cash by the ATO.
What you are actually buying inside a “global” ETF
When Australian investors say “global ETF,” they typically mean a developed-market ETF tracking an index like the MSCI World ex-Australia. The name sounds like the world. The composition is more specific.
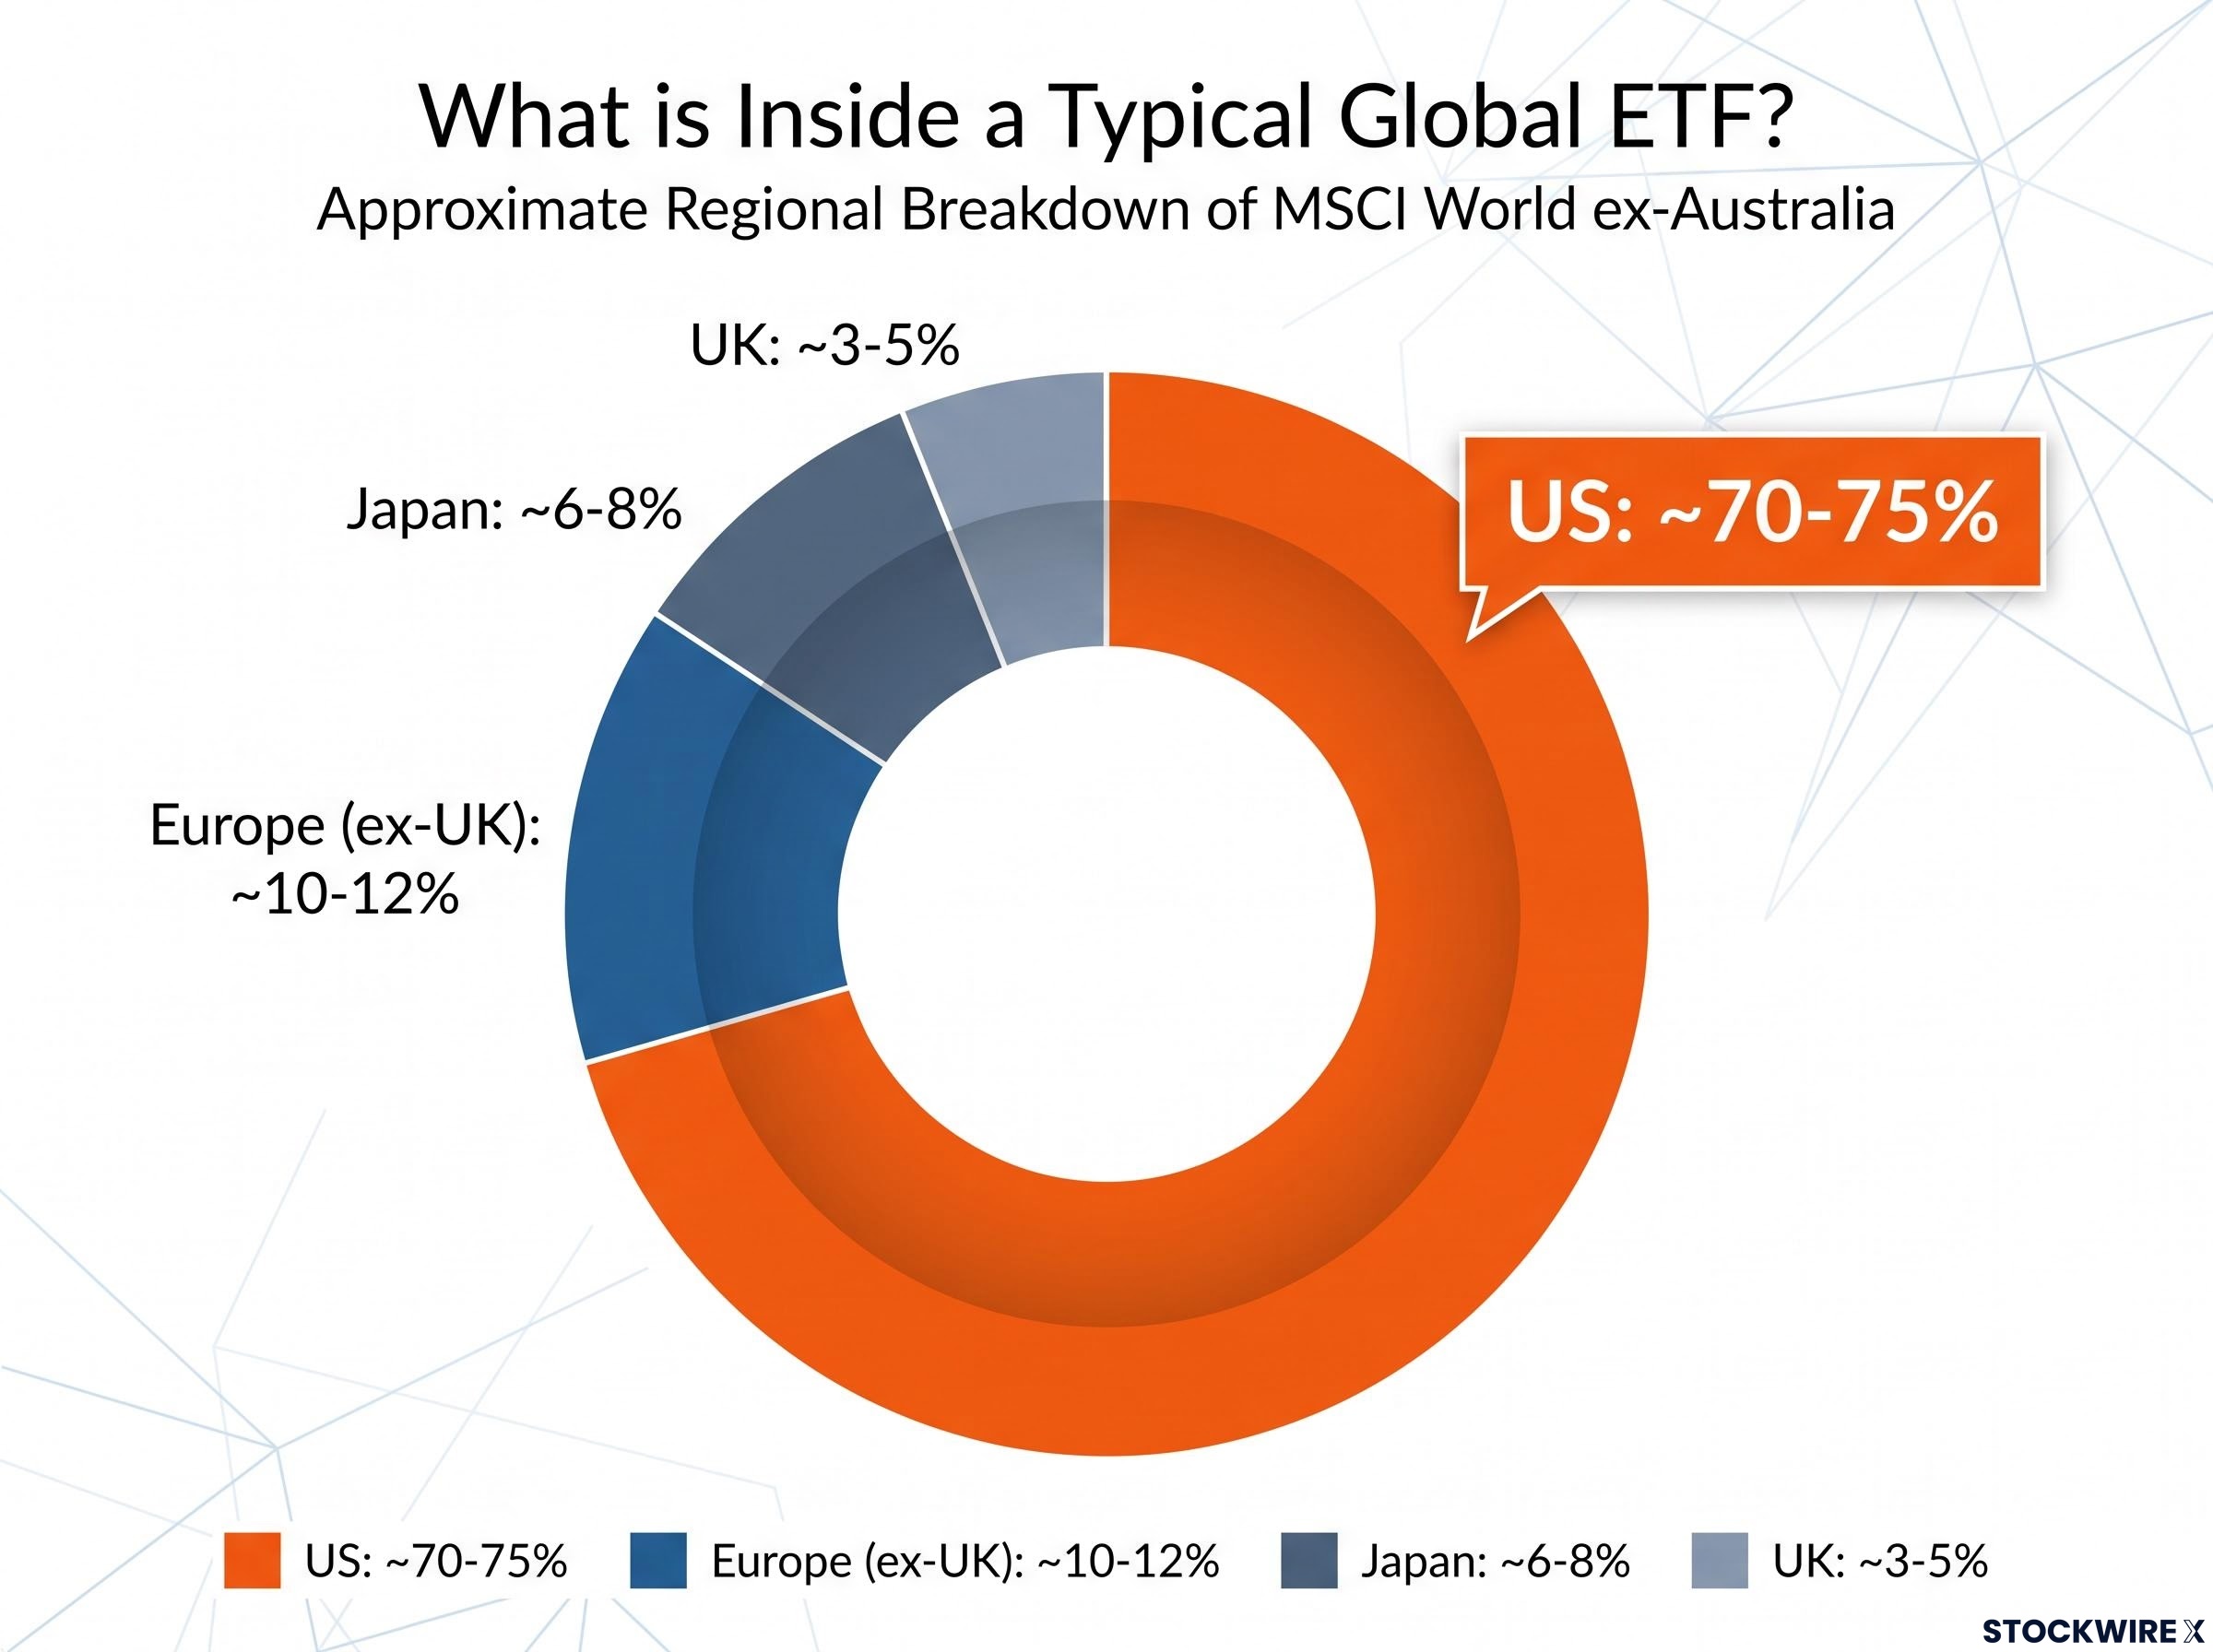
The US typically makes up around 70-75% of the MSCI World index by market capitalisation. In ex-Australia versions, Australia’s roughly 2% share is removed and redistributed across remaining developed markets, leaving the US weight dominant and largely intact. The approximate regional breakdown of a typical MSCI World ex-Australia ETF looks like this:
- US: approximately 70-75%
- Japan: approximately 6-8%
- UK: approximately 3-5%
- Europe (ex-UK): approximately 10-12%
- Other developed markets: remainder
For a precise current US weighting, the fact sheet of a specific ASX-listed global ETF tracking MSCI World is the best reference point. But the directional picture is consistent across products and dates.
The concentration problem hiding in plain sight
An investor who sells all Australian shares to buy this product has not eliminated concentration risk. They have exchanged an Australian home bias for a US concentration of substantially greater magnitude.
Consider the framing: 100% in a global ETF means 0% Australian allocation and approximately 70-75% US allocation. Most investors would not describe that as a diversified position if it were presented that way upfront. This is not an argument against global ETFs. It is an argument against treating them as a complete portfolio.
ETF overlap compounds the concentration problem for investors who pair a global fund with a separate US or technology ETF: the same mega-cap names appear simultaneously across multiple holdings, pushing effective exposure to a handful of stocks well above what any single fund’s fact sheet reveals.
Why Australian shares are a genuine global diversifier
The sector contrast between Australia and the US is structurally significant. Australia’s market is dominated by resources and financials. The US market is dominated by technology and consumer growth. These sectors do not move in lock-step across all market environments. When commodity prices rise and technology multiples compress, the Australian market has a fundamentally different return profile.
Adding an Australian allocation changes the portfolio arithmetic materially:
| Portfolio | Australian Shares | US Exposure | Rest of World |
|---|---|---|---|
| 100% Global ETF | 0% | ~70-75% | ~25-30% |
| 40% Australian + 60% Global ETF | 40% | ~42-45% | ~15-18% |
| 60% Australian + 40% Global ETF | 60% | ~28-30% | ~10-12% |
A 40% Australian plus 60% global ETF blend reduces effective US exposure from approximately 70-75% to approximately 42-45%, while maintaining substantial international diversification. That is a meaningfully different portfolio than going all-global.
Correlations between Australian and US equities are high but meaningfully below 1.0. The sector composition difference drives real divergence in how returns are generated across different market cycles, even when broad direction aligns.
For Australian resident investors, the structural advantages of holding domestic shares extend beyond sector mix:
- Franking credits provide a meaningful after-tax advantage unavailable on foreign equities
- AUD currency matching aligns assets with Australian-dollar liabilities and living costs
- Sector diversification from a US-heavy global ETF introduces resources and financials exposure that a purely global portfolio largely lacks
The ATO franking credit refund rules establish that Australian resident investors can receive a cash refund for any franking credits that exceed their total tax liability, meaning the after-tax value of domestic dividends is materially higher for low and middle-income investors than pre-tax return comparisons capture.
Guidance from Vanguard, Morningstar, and institutional practitioners broadly supports meaningful allocations to both Australian and global shares, with a rough band of 40-60% Australian and 40-60% global cited as consistent with quality practitioner frameworks.
Adding Australian shares to a global ETF portfolio is not a concession to nostalgia or home-country sentiment. It is a portfolio construction decision that reduces effective single-market concentration and introduces a structurally different sector mix. For an Australian investor, domestic shares are one of the few ways to achieve genuine geographic diversification within an equity portfolio.
What genuine diversification actually requires
A well-diversified portfolio will always include something that is not currently the top performer. That is the mechanism, not the failure mode.
The distinction matters: concentrating in a US-heavy ETF after a decade of US dominance is performance-chasing with a diversification label attached. Genuine diversification means deliberately holding assets that perform differently across environments you cannot predict in advance.
Two approaches to portfolio construction sit at opposite ends of this spectrum:
- Performance-chasing: Concentrate in recent winners, accept the concentration risk that comes with it, and bet that leadership persists
- Genuine diversification: Build a deliberate blend across geographies and sectors, accept that some holdings will lag in any given period, and aim for a portfolio that holds up across the range of environments ahead
The sector differences between Australia (resources, financials) and the US (technology, consumer) mean that a mixed portfolio will underperform a pure US allocation in some environments and outperform it in others. That asymmetry is precisely what diversification is designed to deliver.
Applying this to your own portfolio
The appropriate blend is an individual decision. Your marginal tax rate determines how much franking credits are worth to you. Your time horizon determines how much weight to place on short-term performance differences versus long-run rotation. Your existing superannuation exposure may already tilt your total portfolio in one direction. And whether currency risk is a material concern depends on your broader financial position.
For investors ready to translate the blending framework into a specific allocation, our dedicated guide to structuring an ETF portfolio for Australian investors walks through asset allocation principles, fund selection criteria, and the case for keeping total fund count between 2-6 to manage fee drag and rebalancing complexity.
What the evidence says for investors who are still deciding
Three structural findings sit at the centre of this allocation question:
- Global ETFs tracking developed-market indices are substantially more US-concentrated than the label “global” implies, with the US typically comprising 70-75% of holdings
- Adding Australian shares to a global ETF portfolio reduces effective single-market concentration and introduces a sector mix that behaves differently across market cycles
- Historical rotation data across more than seven decades does not support the assumption that the current decade’s market leader will be the next decade’s leader; Australia has ranked in the top four of global equity markets over 145 years of long-run data
The performance gap between Australian and global shares is real, and it narrows materially when franking credits are included in the calculation. The optimal blend depends on your time horizon, tax position, and existing superannuation exposure. The article’s argument is structural, not prescriptive.
The investor who understands what their ETF actually contains, who knows that 70-75% US exposure is not the same thing as global diversification, and who can place the last decade’s performance gap in a century of context, is making a different decision than the investor acting on the label alone. It is a better-informed one.
This article is for informational purposes only and should not be considered financial advice. Investors should conduct their own research and consult with financial professionals before making investment decisions. Past performance does not guarantee future results.
—