For most of the past three years, the U.S. stock market’s gains have had a concentration problem. A handful of mega-cap technology names, the so-called Magnificent Seven, generated a disproportionate share of the S&P 500’s returns, and the bull case for equities often felt like a bull case for seven stocks wearing an index costume. The Q2 2026 earnings season is forcing a reassessment of that assumption, and the evidence is not anecdotal.
The concentration narrative became dominant for good reason: through 2023 and 2024, the Magnificent Seven delivered profit growth rates that dwarfed the rest of the index. But Q2 2026 data, drawn from six independent institutional sources, tells a more distributed story. Earnings broadening, where profit growth spreads across sectors and company sizes rather than clustering among the largest names, is now showing up in beat rates, revision breadth, median stock performance, and equal-weight index returns simultaneously.
Here is what that data actually shows about where profit momentum is coming from in 2026, what it means for the sustainability of this rally, and why the distinction between a narrow market and a broad one changes how you should interpret index-level returns.
What the Q2 2026 earnings numbers are actually showing
The headline numbers from Q2 2026 are strong by any historical standard:
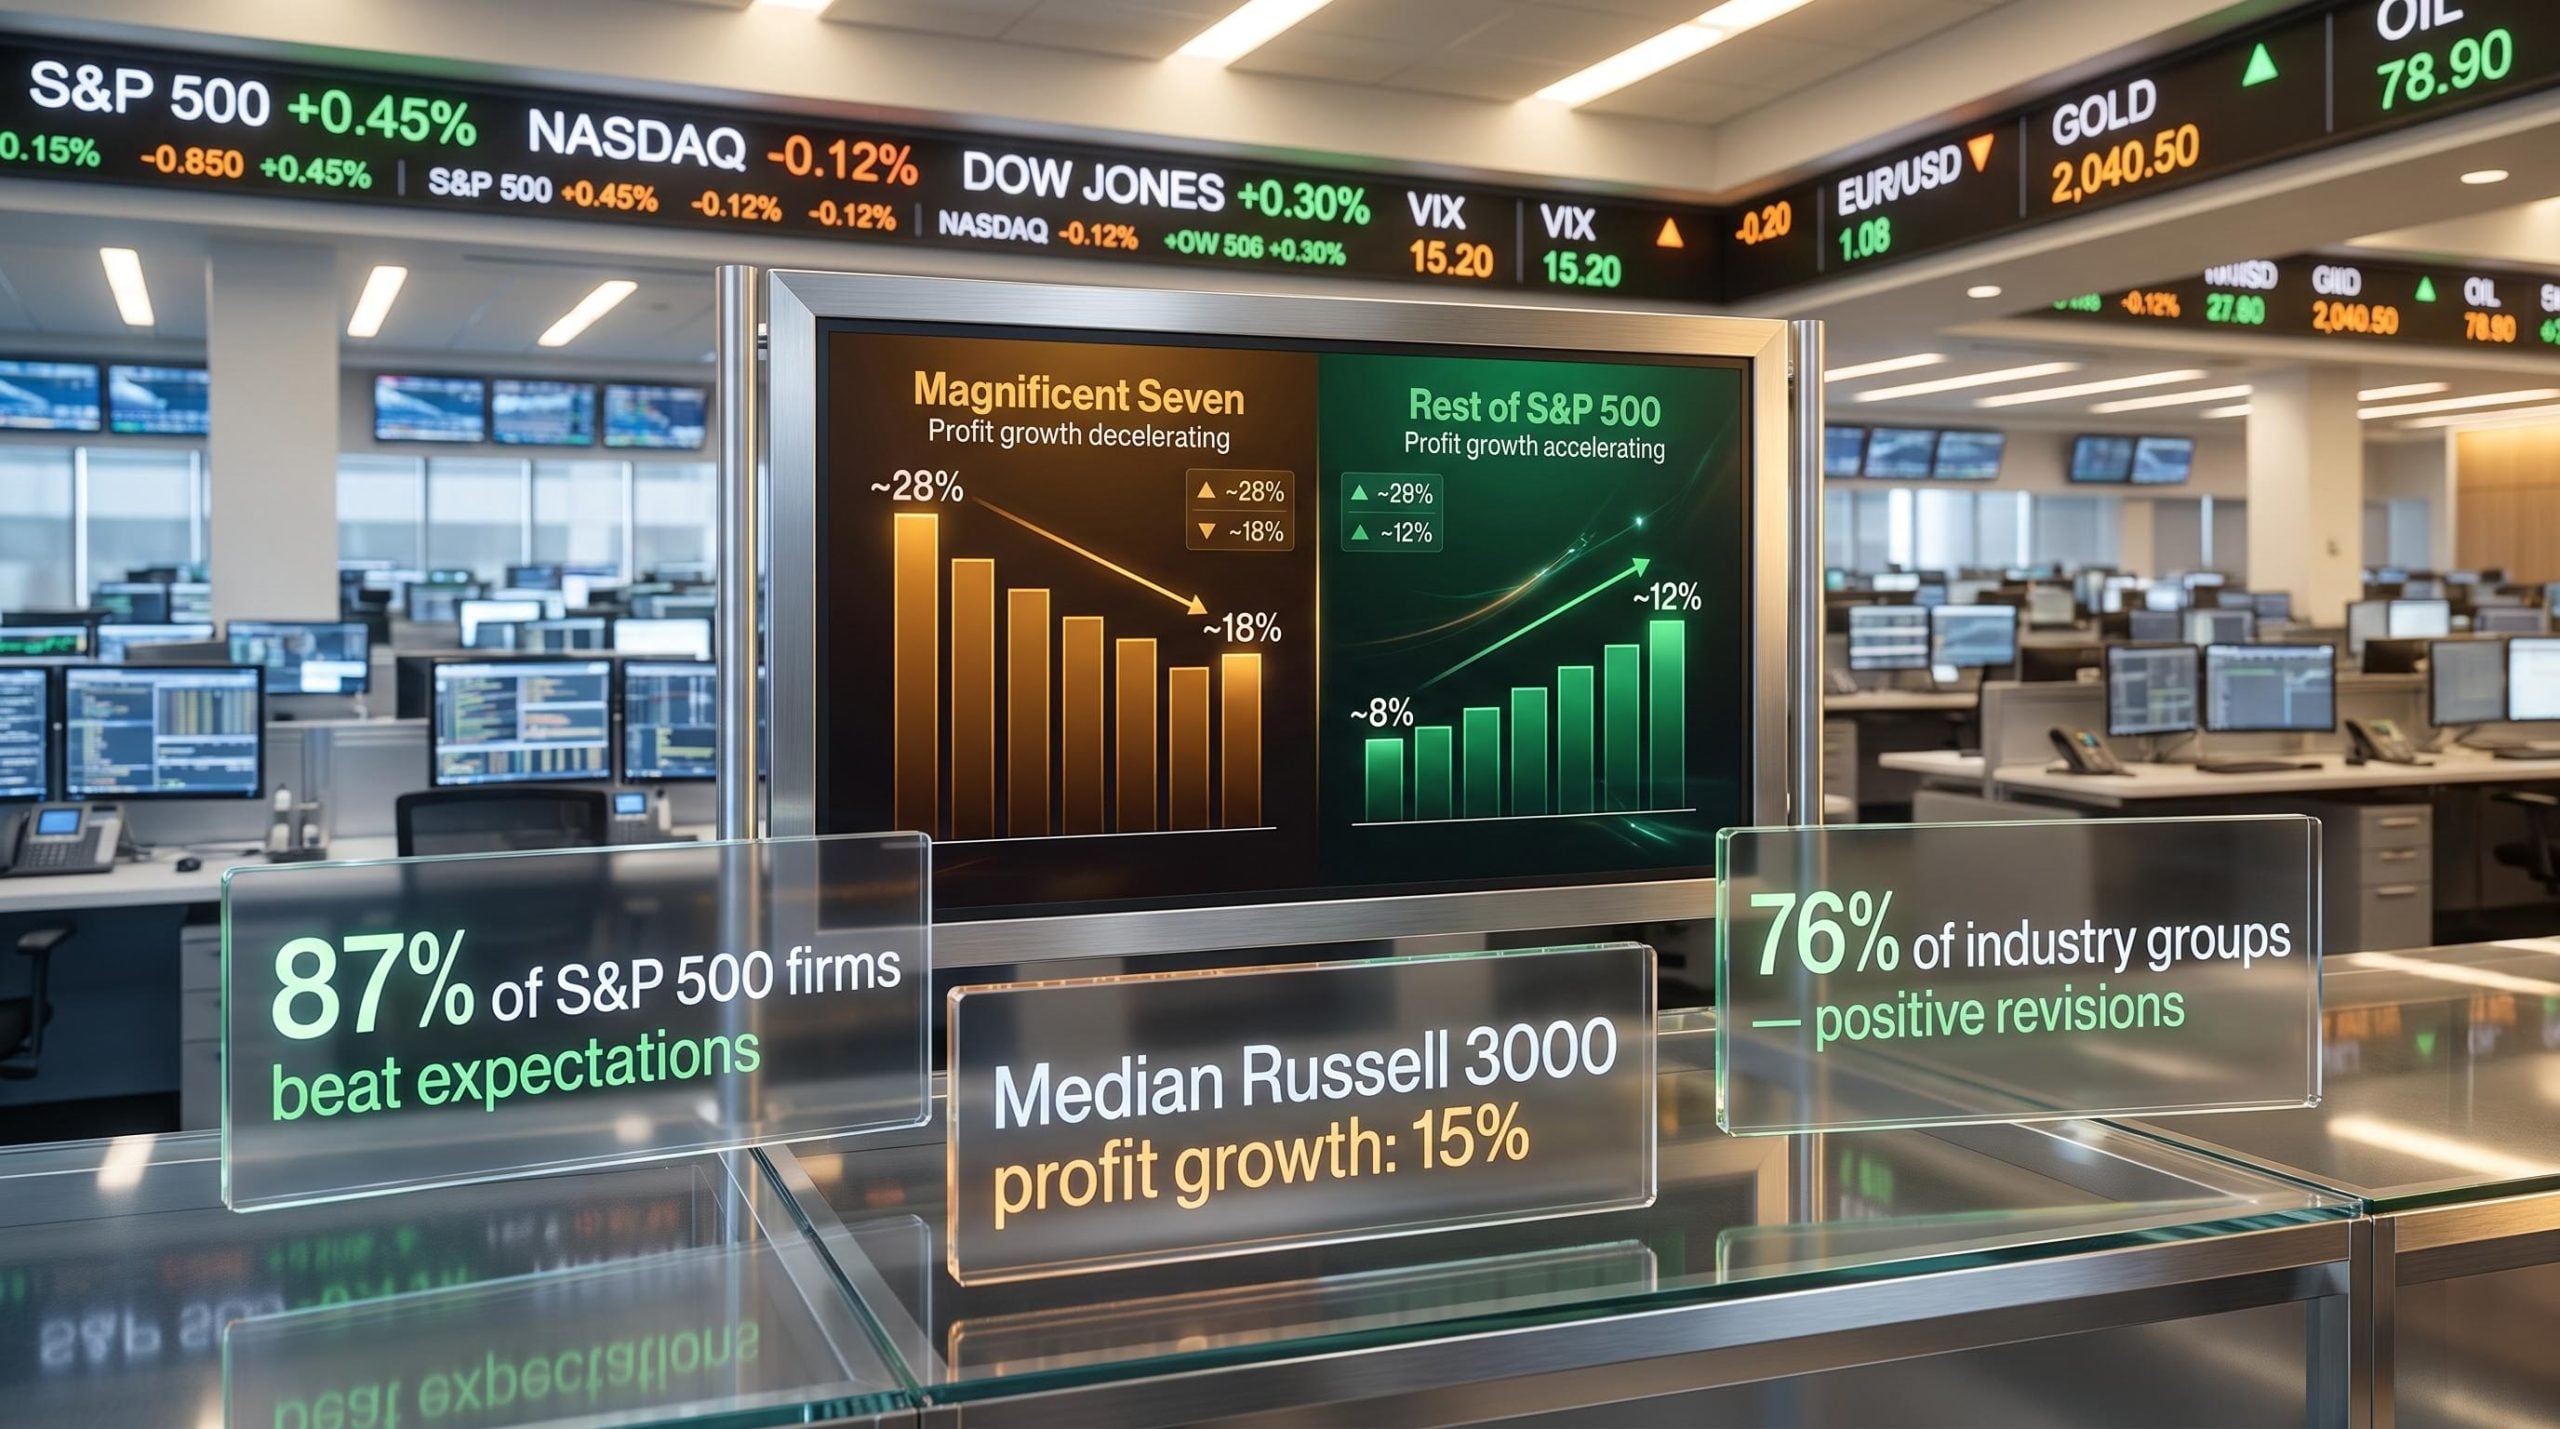
- Morgan Stanley data shows that roughly 87% of S&P 500 firms surpassed profit expectations, climbing from 82% in the preceding quarter
- JPMorgan independently reported an approximately 85% early-season beat rate, corroborating the elevated figure
- Aggregate S&P 500 earnings growth came in at approximately 23-24% year-over-year (LSEG IBES)
- More than 75% of S&P 500 reporting firms posted year-over-year earnings growth, the highest share since Q3 2021 (Bloomberg Intelligence)
Those numbers look impressive on their own. They look more interesting when you strip out the mega-cap distortion.
The Q1 2026 earnings season delivered a blended growth rate of 27.1%, nearly double the 13.1% pre-season analyst forecast, establishing the elevated expectations baseline that makes Q2’s 23-24% result both impressive and incrementally harder to exceed.
Morgan Stanley’s data indicates that the median Russell 3000 stock delivered profit growth of 15% in Q2, marking the strongest pace recorded since 2021.
The gap between the aggregate 23-24% growth rate and the median stock’s 15% tells you something specific. Broad participation is real, but the largest names are still lifting the average. Understanding that distinction is what separates a thoughtful reading of this season from a headline-level one. The median figure is harder to game than beat rates, which can be managed by setting low consensus bars. It is the number that tells you whether the rally has structural support beneath the biggest names.
When big ASX news breaks, our subscribers know first
How revision breadth confirms this is not a one-quarter anomaly
Beat rates tell you what happened last quarter. Revision breadth tells you what analysts expect to happen next. Earnings revision breadth measures the share of industry groups where analysts are raising their profit estimates rather than cutting them. When revisions are positive across most industries, it signals that the earnings cycle has momentum beyond a single reporting period.
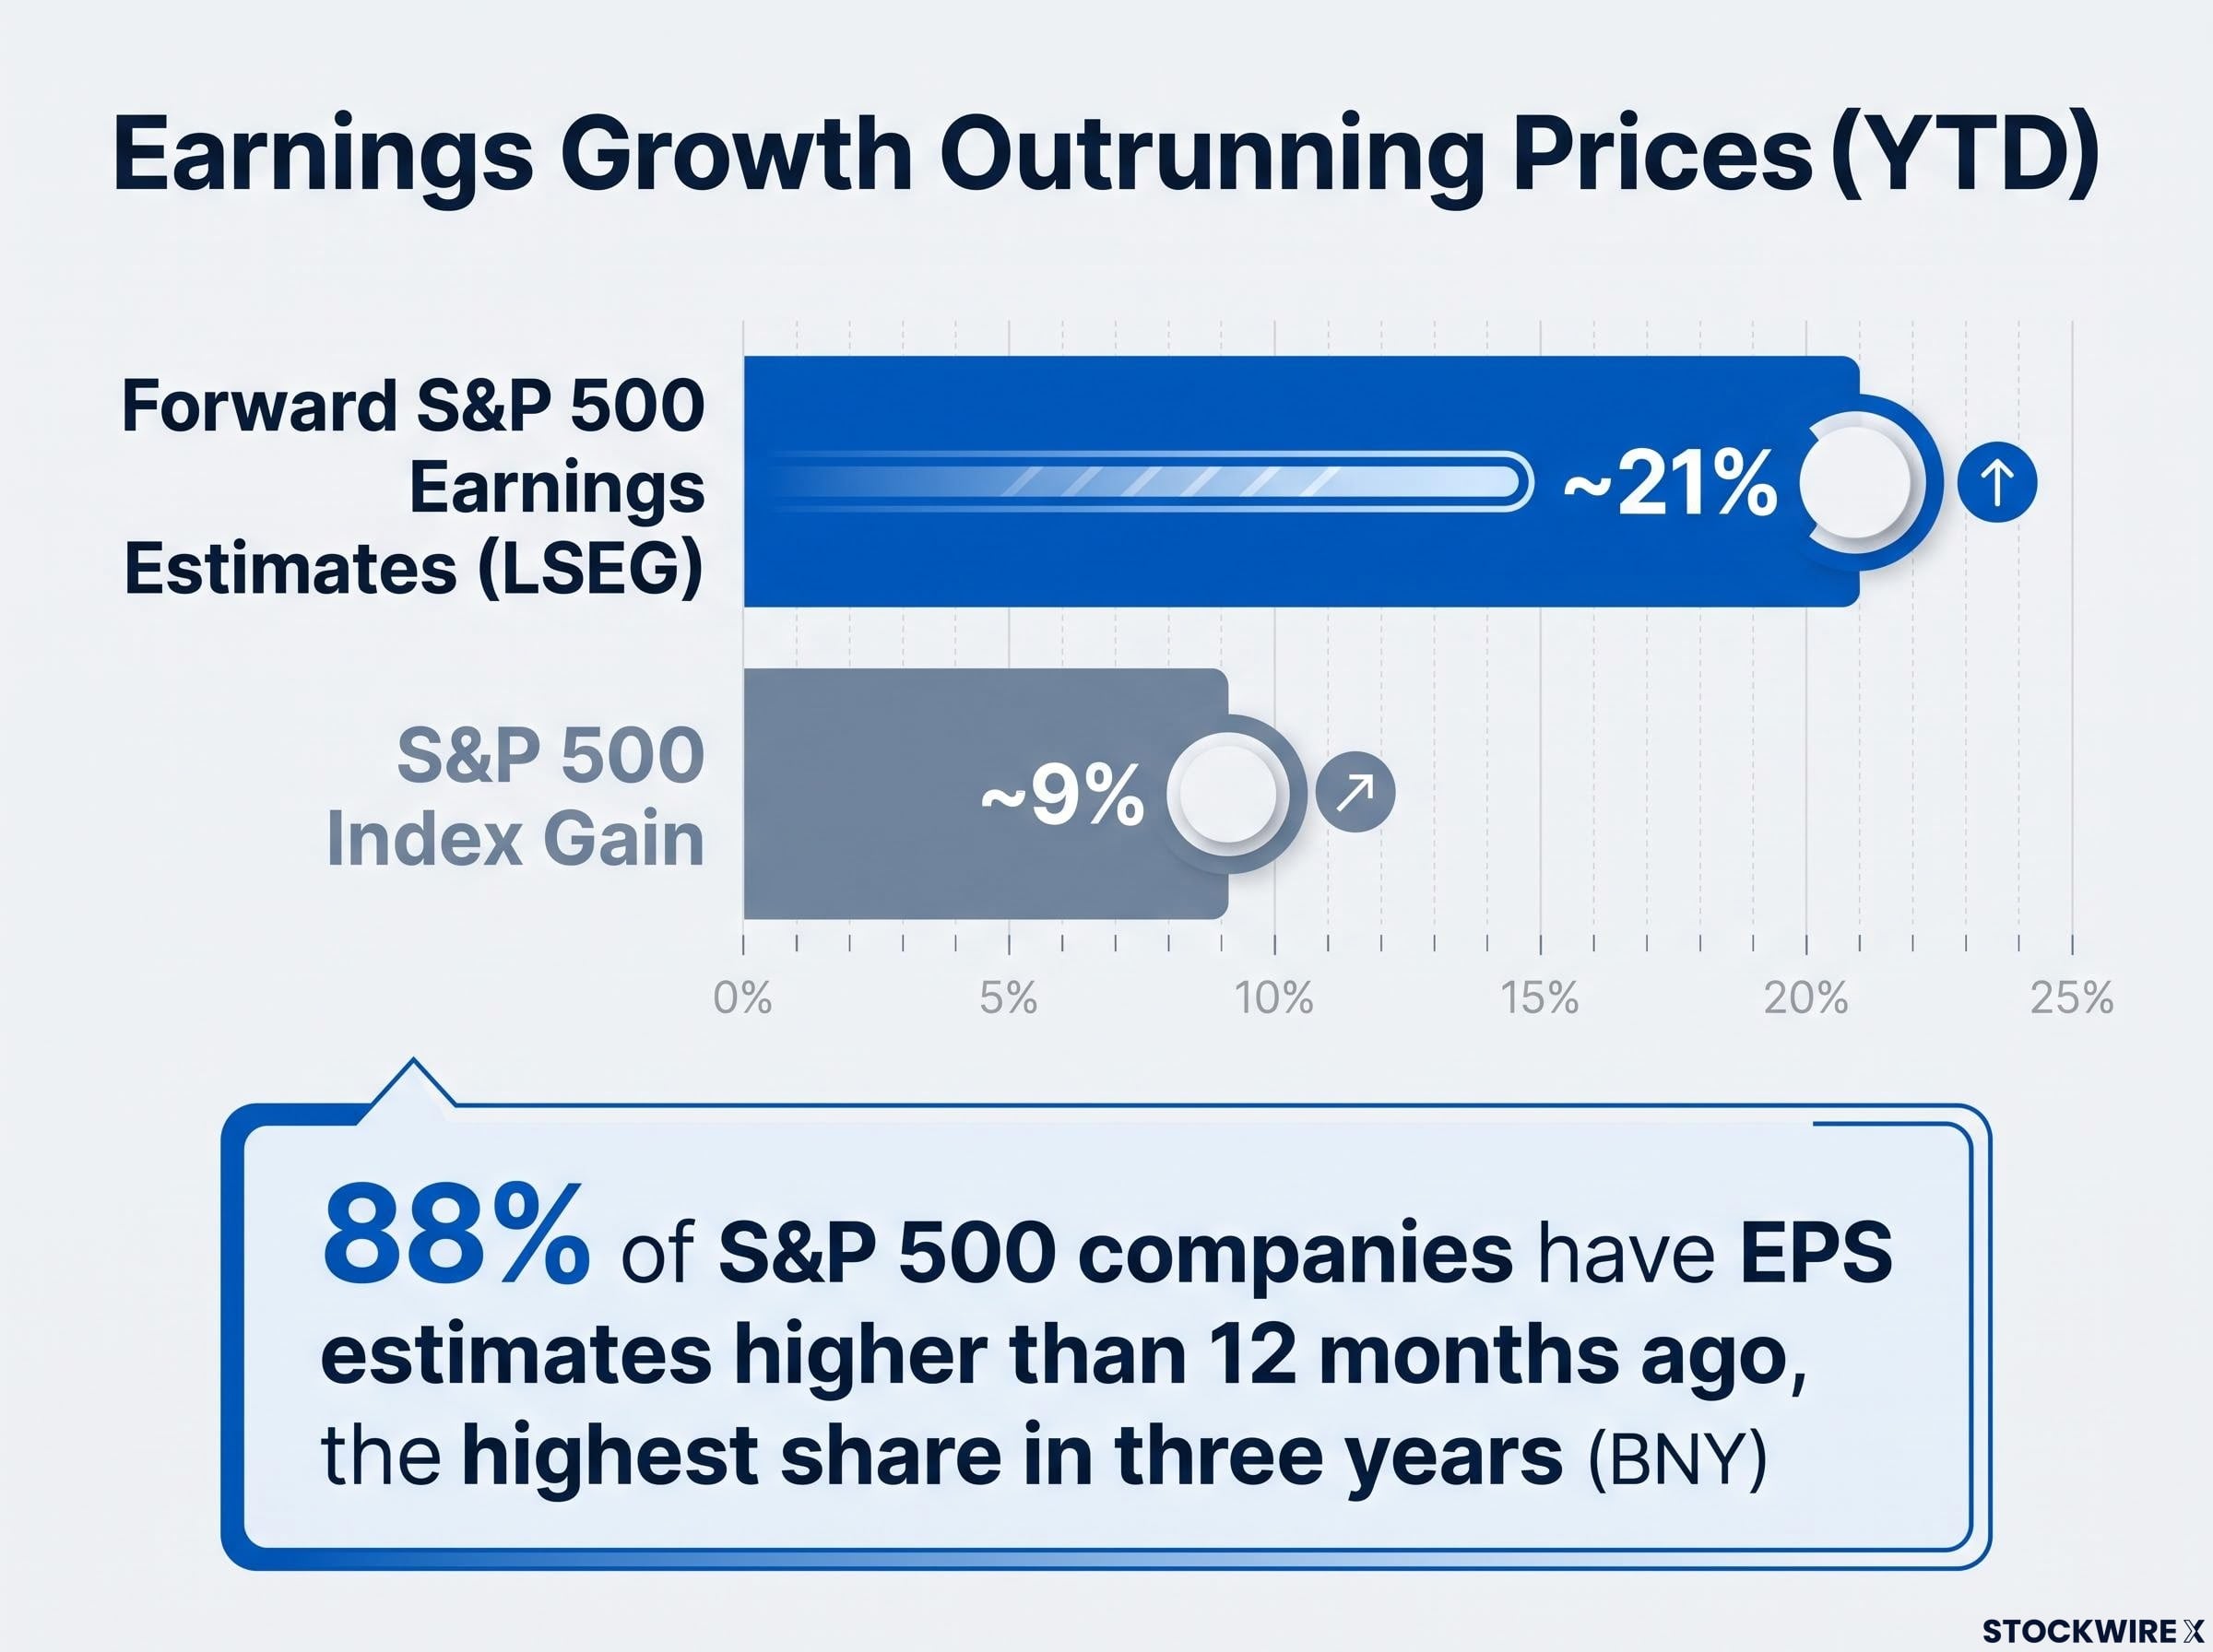
According to Morgan Stanley, earnings revision breadth climbed to 23% in Q2, with 76% of industry groups recording positive upward revisions, placing both figures close to cycle-high territory. BNY corroborates this from a different angle: 88% of S&P 500 companies now have earnings-per-share estimates higher than they were 12 months ago, the highest share in three years.
The forward estimate data sharpens the picture further. According to LSEG, forward S&P 500 earnings estimates are up approximately 21% year-to-date, against a roughly 9% gain in the index itself.
| Metric | Source | Figure | What it signals |
|---|---|---|---|
| Revision breadth | Morgan Stanley | 23%, with 76% of industry groups positive | Near cycle-high breadth of upward analyst revisions |
| Upward EPS revision share | BNY | 88% of S&P 500 companies | Highest in three years; broad earnings momentum |
| Forward estimates vs. index gain | LSEG | ~21% YTD vs. ~9% index gain | Earnings outrunning prices; valuations compressing |
When earnings estimates are rising faster than prices, the market’s valuation is actually becoming less stretched even as prices climb. Historically, that is the condition that supports a rally’s continuation rather than its reversal.
The 23.6% aggregate growth figure carries a structural caveat: analysts raised Q2 2026 EPS estimates by 3.4% during the quarter, the opposite of the historical 2.7% pre-season cut, which means forward P/E valuation is compressing on rising earnings even as index prices climb.
What earnings broadening actually means and why it matters beyond headlines
If you have followed markets over the past two years, you have likely absorbed a version of this narrative: a small group of mega-cap tech stocks is responsible for most of the S&P 500’s gains, and the rest of the market is along for the ride. Earnings broadening is the structural counter to that story. It means profit growth is distributed across sectors and company sizes rather than concentrated among a small cluster of the largest stocks by market capitalisation.
Three conditions characterise a broadening earnings cycle:
- Growth distribution: Median stock profit growth accelerates, not just the aggregate average pulled higher by a few outliers
- Revision spread: Analyst upgrades are positive across most industry groups, not concentrated in one or two sectors
- Equal-weight signal: The equal-weight version of the index (where every stock counts equally) outperforms the cap-weighted version (where the largest stocks dominate)
All three are present in 2026 to date. Bloomberg Intelligence data shows the equal-weight S&P 500 has outperformed the cap-weighted index this year, the clearest market-level signal that performance is less concentrated in the largest names.
| Group | 2025 profit growth | 2026 projected growth | Trend |
|---|---|---|---|
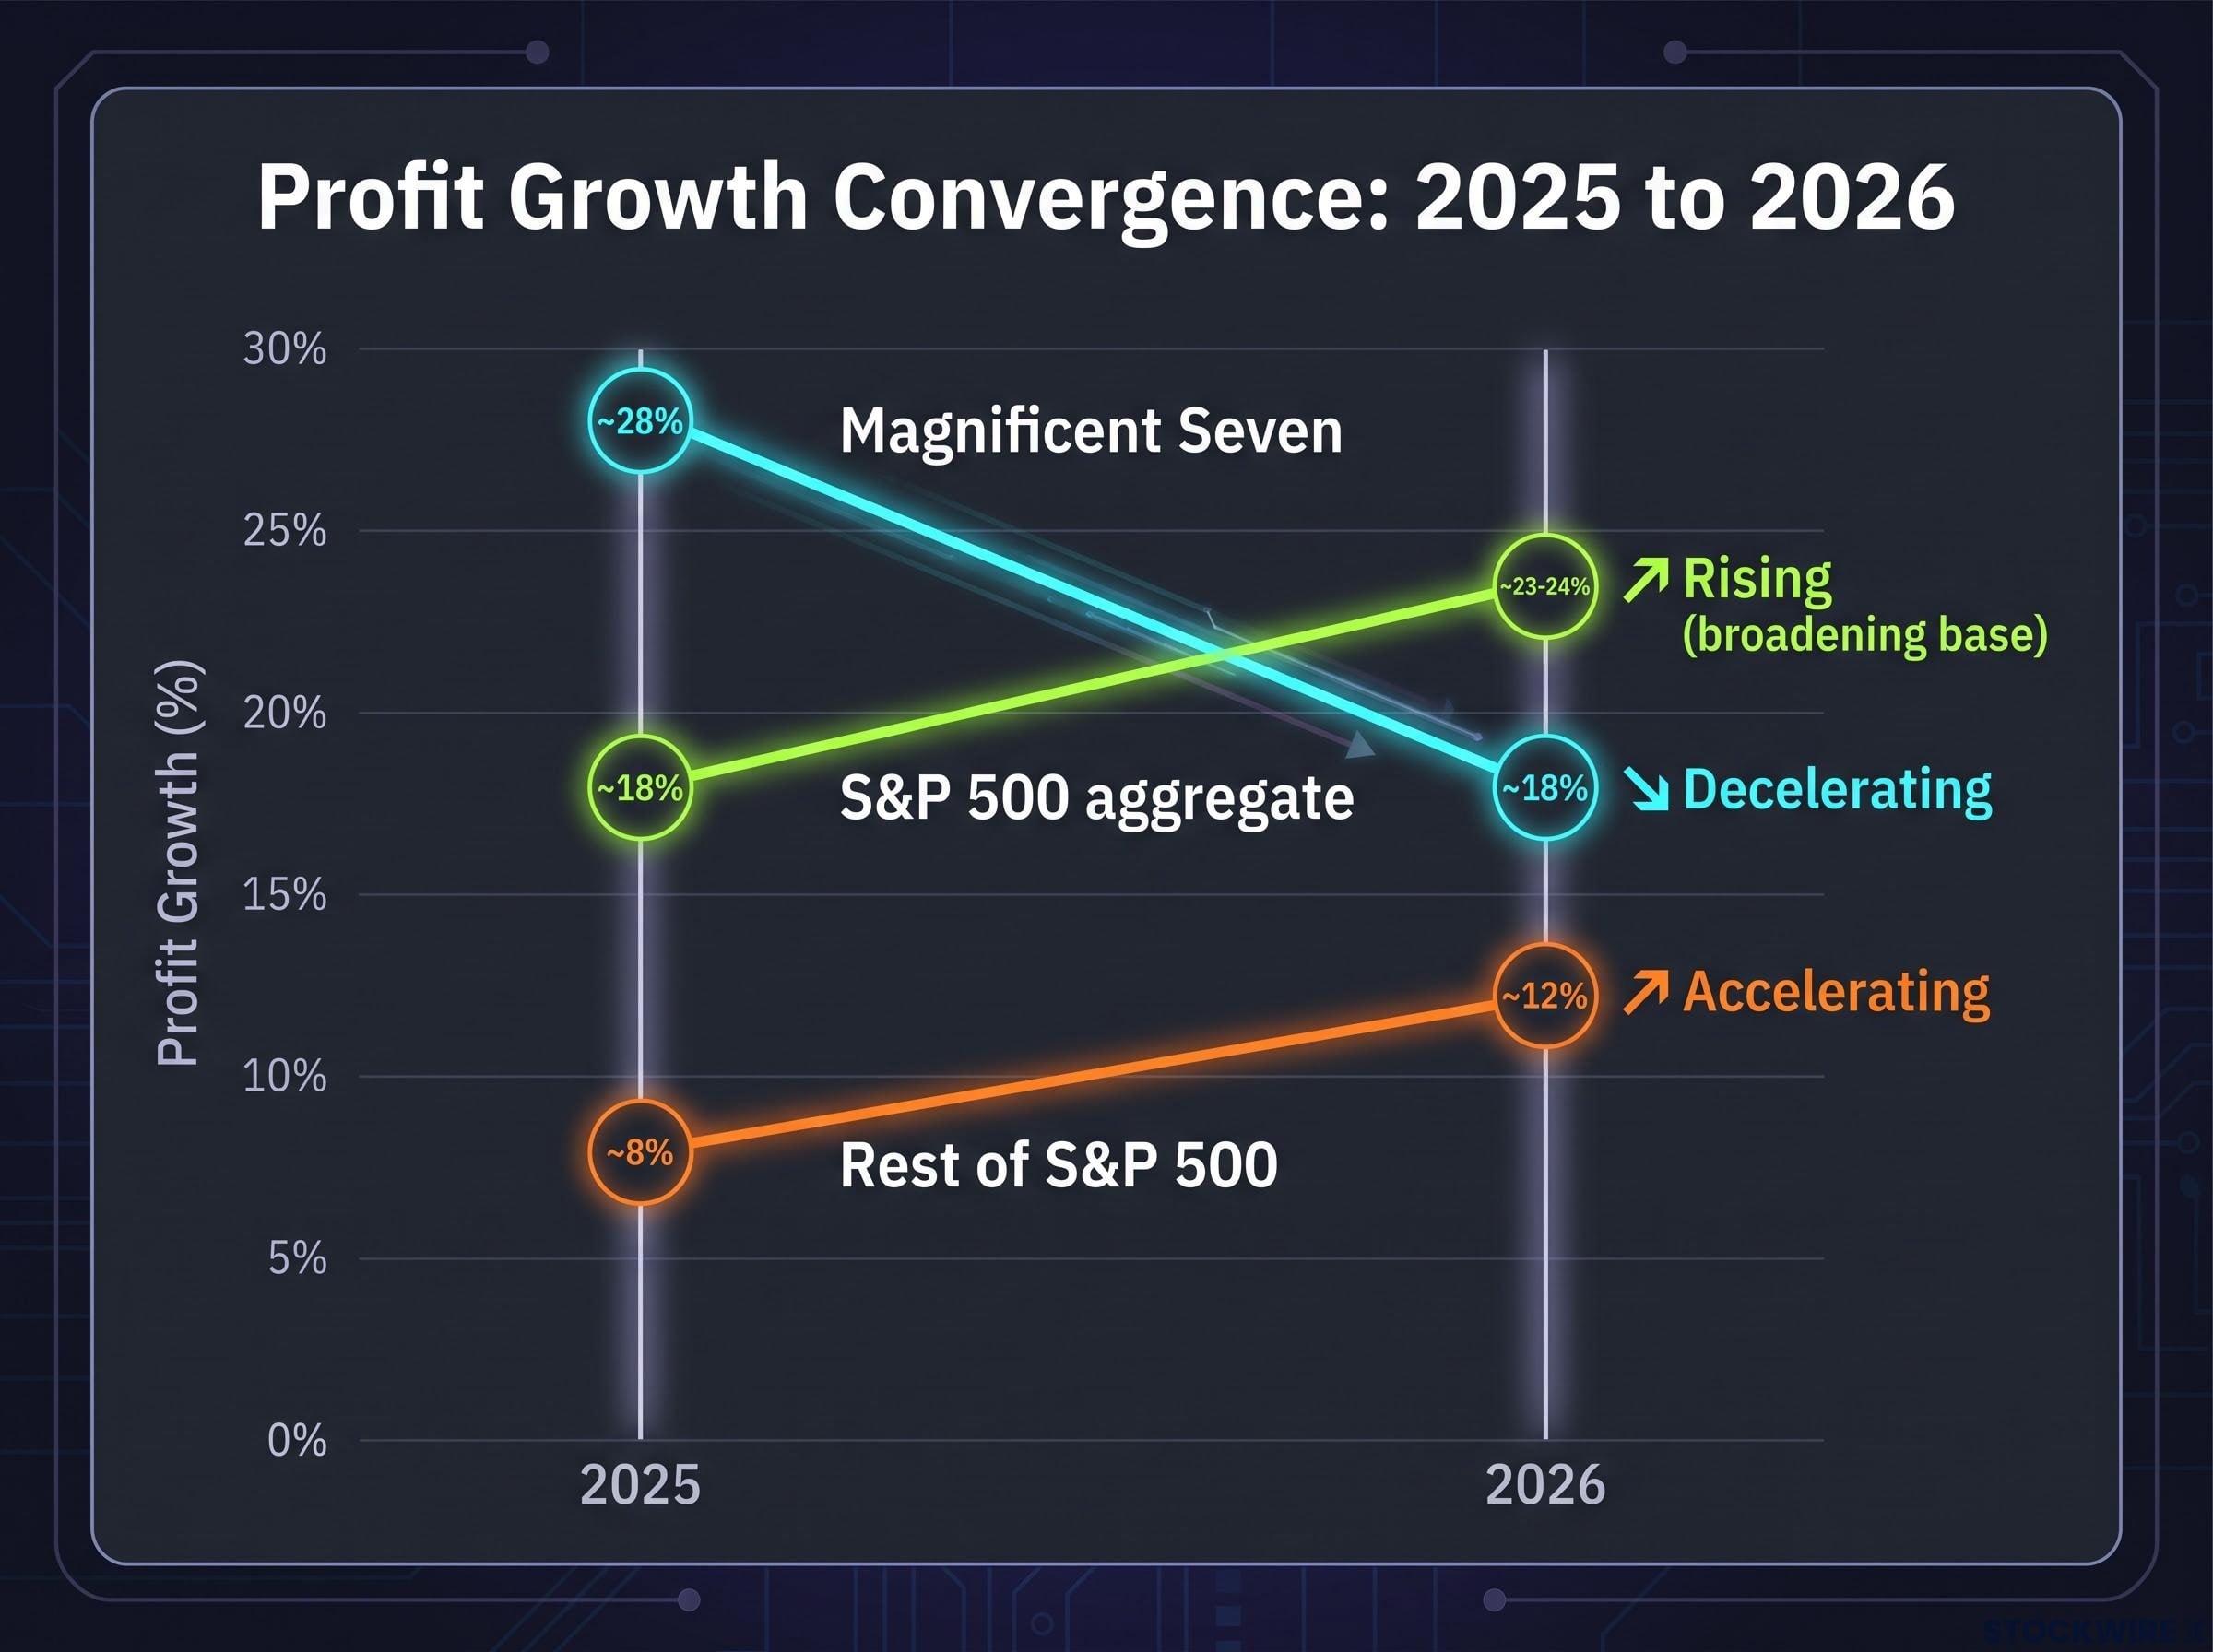
| Magnificent Seven | ~28% | ~18% | Decelerating |
| Rest of S&P 500 | ~8% | ~12% | Accelerating |
| S&P 500 aggregate | ~18% | ~23-24% | Rising (broadening base) |
The convergence in growth rates does not mean tech is losing its edge. Q2 2026 technology sector profits are still expected to grow approximately 65%, well above the roughly 23% aggregate rate (LSEG). What it means is the edge is spreading. For you as an investor, that distinction determines whether a portfolio needs to be concentrated to capture the market’s gains or can afford to be diversified. In 2023 and 2024, concentration was rewarded. The 2026 data suggests that equation is shifting.
Magnificent Seven underperformance through mid-2026 reflects four simultaneous headwinds identified by Deutsche Bank: extreme crowded positioning, a capex credibility test, a more hawkish Fed compressing growth multiples, and rising chip costs squeezing platform margins, factors that help explain why the convergence in growth rates shown in Q2 data reflects structural pressure rather than a temporary rotation.
Which sectors are now carrying their own weight
The broadening story gains specificity when you look at which industries are generating their own profit momentum rather than riding the coattails of index-level gains.
A St. Louis Fed analysis finds that the post-pandemic surge in U.S. corporate profits has been driven by domestic non-financial industries, with especially marked increases in:
- Retail and wholesale trade: benefiting from sustained consumer spending and margin recovery
- Construction: driven by infrastructure spending and reshoring demand
- Manufacturing: gaining from supply chain normalisation and operational efficiency
- Health care: expanding on demographic demand and service delivery scale
Bloomberg and Los Angeles Times reporting corroborates that industrials, consumer products, and healthcare are increasingly contributing to index returns independently of technology and communication services. BNY’s multi-asset research notes that earnings across the broader market are expected to grow more than 10% in 2026 and 2027, and characterises the perceived risk of overly concentrated market leadership as something that “may not be founded.”
Where AI efficiency is showing up outside tech
Morgan Stanley’s strategists argue that AI adoption is now generating operational efficiency gains in non-tech companies, not just among the hyperscalers building the infrastructure. This is showing up in margin data across sectors where companies are deploying AI tools for cost optimisation, supply chain management, and customer operations.
BNY corroborates this observation, noting that while companies directly benefiting from AI capital spending remain among the main earnings drivers, “strength is no longer confined to that group.” For a U.S. investor evaluating sector exposure, the St. Louis Fed data and the BNY forward projection together suggest the case for moving beyond a tech-heavy concentration has a quantifiable earnings basis behind it, not just a narrative one.
The sustainability question: what could interrupt this broadening trend
A strong earnings season is a positive signal. It is not a guarantee of permanence. The broadening thesis has real evidence behind it, but it also faces specific conditions that could reverse the trend:
- Elevated expectations now set a higher bar: Reuters coverage emphasises that strong earnings expectations themselves pose a sustainability challenge. Beats that merely meet elevated consensus may not be rewarded by the market.
- Robust growth already priced in: BNY reaches a similar conclusion: broad earnings strength supports durability, but the market is pricing in robust growth, which limits incremental upside from further beats alone.
- Profit share remains historically atypical: The St. Louis Fed notes that corporate profits as a share of national income remain elevated relative to pre-pandemic norms, a condition that is supportive for now but not typical by long-term historical standards.
- AI efficiency gains may plateau before broadening fully: If operational efficiency improvements from AI adoption reach diminishing returns outside the technology sector, one of the key mechanisms supporting the broadening story could slow.
Reuters coverage notes that high earnings expectations now pose the primary challenge for sustaining the equity rally, even with strong current results. When the bar is already high, clearing it does not generate the same market reward.
The sustainability caveat does not reverse the broadening thesis. It tells you that the most valuable edge from here comes from identifying which companies and sectors are most likely to continue beating elevated expectations, not from simply observing that the market overall is doing well.
For investors wanting to stress-test the broadening thesis against the specific risks flagged by J.P. Morgan and Morgan Stanley, our full explainer on fragile market rally signals examines how corporate beats are failing to produce price gains when forward guidance quality and pre-priced expectations dominate market reactions.
Past performance does not guarantee future results. Financial projections are subject to market conditions and various risk factors.
What the breadth data changes about how to read this rally
The analytical movement of this piece points in one direction: the broadening is real, measurable across multiple independent sources, and structurally significant. It is not a replacement for tech’s continued outperformance; it exists alongside it. The Q2 2026 data provides three mutually reinforcing signals that all point toward the same conclusion.
Morgan Stanley’s figures show that the median Russell 3000 stock achieved profit growth of 15% (the highest rate since 2021) and median revenue growth of 8% (among the strongest readings since 2023). The proportion of industry groups with positive upward earnings revisions stands at 76%, a level that puts revision breadth close to cycle highs. The equal-weight S&P 500’s outperformance of the cap-weighted index confirms the data at the market level.
The convergence trajectory between the Magnificent Seven (decelerating from 28% to 18%) and the rest of the S&P 500 (accelerating from 8% to 12%) is the structural shift that matters most. Three signals to monitor from here:
- Revision breadth sustainability: Whether the 76% positive revision share holds near cycle highs through Q3, or begins to narrow back toward tech-only strength
- Mag 7 vs. rest growth convergence: Whether the rest of the S&P 500 continues to close the growth gap, or whether the deceleration in Magnificent Seven earnings stalls the convergence
- Non-tech sector margins: Whether the AI-driven efficiency gains appearing in non-tech operating margins persist through the next two reporting cycles
For U.S. investors, the convergence in growth rates and the equal-weight outperformance together mean the market’s risk-reward profile is shifting. Diversification is offering more structural support in 2026 than it did in 2023 or 2024. That is a concrete, data-backed change worth incorporating into how you evaluate index-level returns, sector allocation, and portfolio concentration. Investors who continue to read this market exclusively through the lens of mega-cap tech performance are reading a partial story, and Q2 2026 is the quarter where the evidence base for a broader interpretation became difficult to dismiss.
This article is for informational purposes only and should not be considered financial advice. Investors should conduct their own research and consult with financial professionals before making investment decisions.