
JPMorgan has formalised what was once its bull-case fantasy: an S&P 500 year-end target of 8,000, published 10 August 2026 and backed by the broadest earnings upgrade cycle the firm’s strategists have described in years.
With the S&P 500 trading at approximately 7,757 at the time of the announcement, the new target implies roughly 3% further upside by year-end. What makes this revision notable is not the number itself but the justification behind it: JPMorgan is anchoring the call on earnings growth, not on investors paying more per dollar of profit. The distinction matters.
Here is what the bank’s own EPS data reveals about the quality of current index earnings, why the valuation multiple was deliberately held steady, and what three variables will determine whether the market can sustain 8,000 once it arrives there.
From bull-case fantasy to base case: JPMorgan’s target climbs to 8,000
The number did not arrive in a single leap. JPMorgan’s S&P 500 year-end target moved four times across 2026, each step grounded in a specific analytical upgrade:
- 7,200: Set earlier in 2026 after the prior target of 7,500 was cut amid concerns about rates and risk asset repricing.
- 7,600: Raised as stronger earnings and AI-driven growth materialised.
- 7,800: Lifted at mid-year, citing what strategists described as an “unprecedented” earnings upgrade cycle.
- 8,000: Formalised on 10 August 2026 by Dubravko Lakos-Bujas and his team at JPMorgan Global Research, driven by a Q2 earnings season characterised as both strong and broadly distributed.
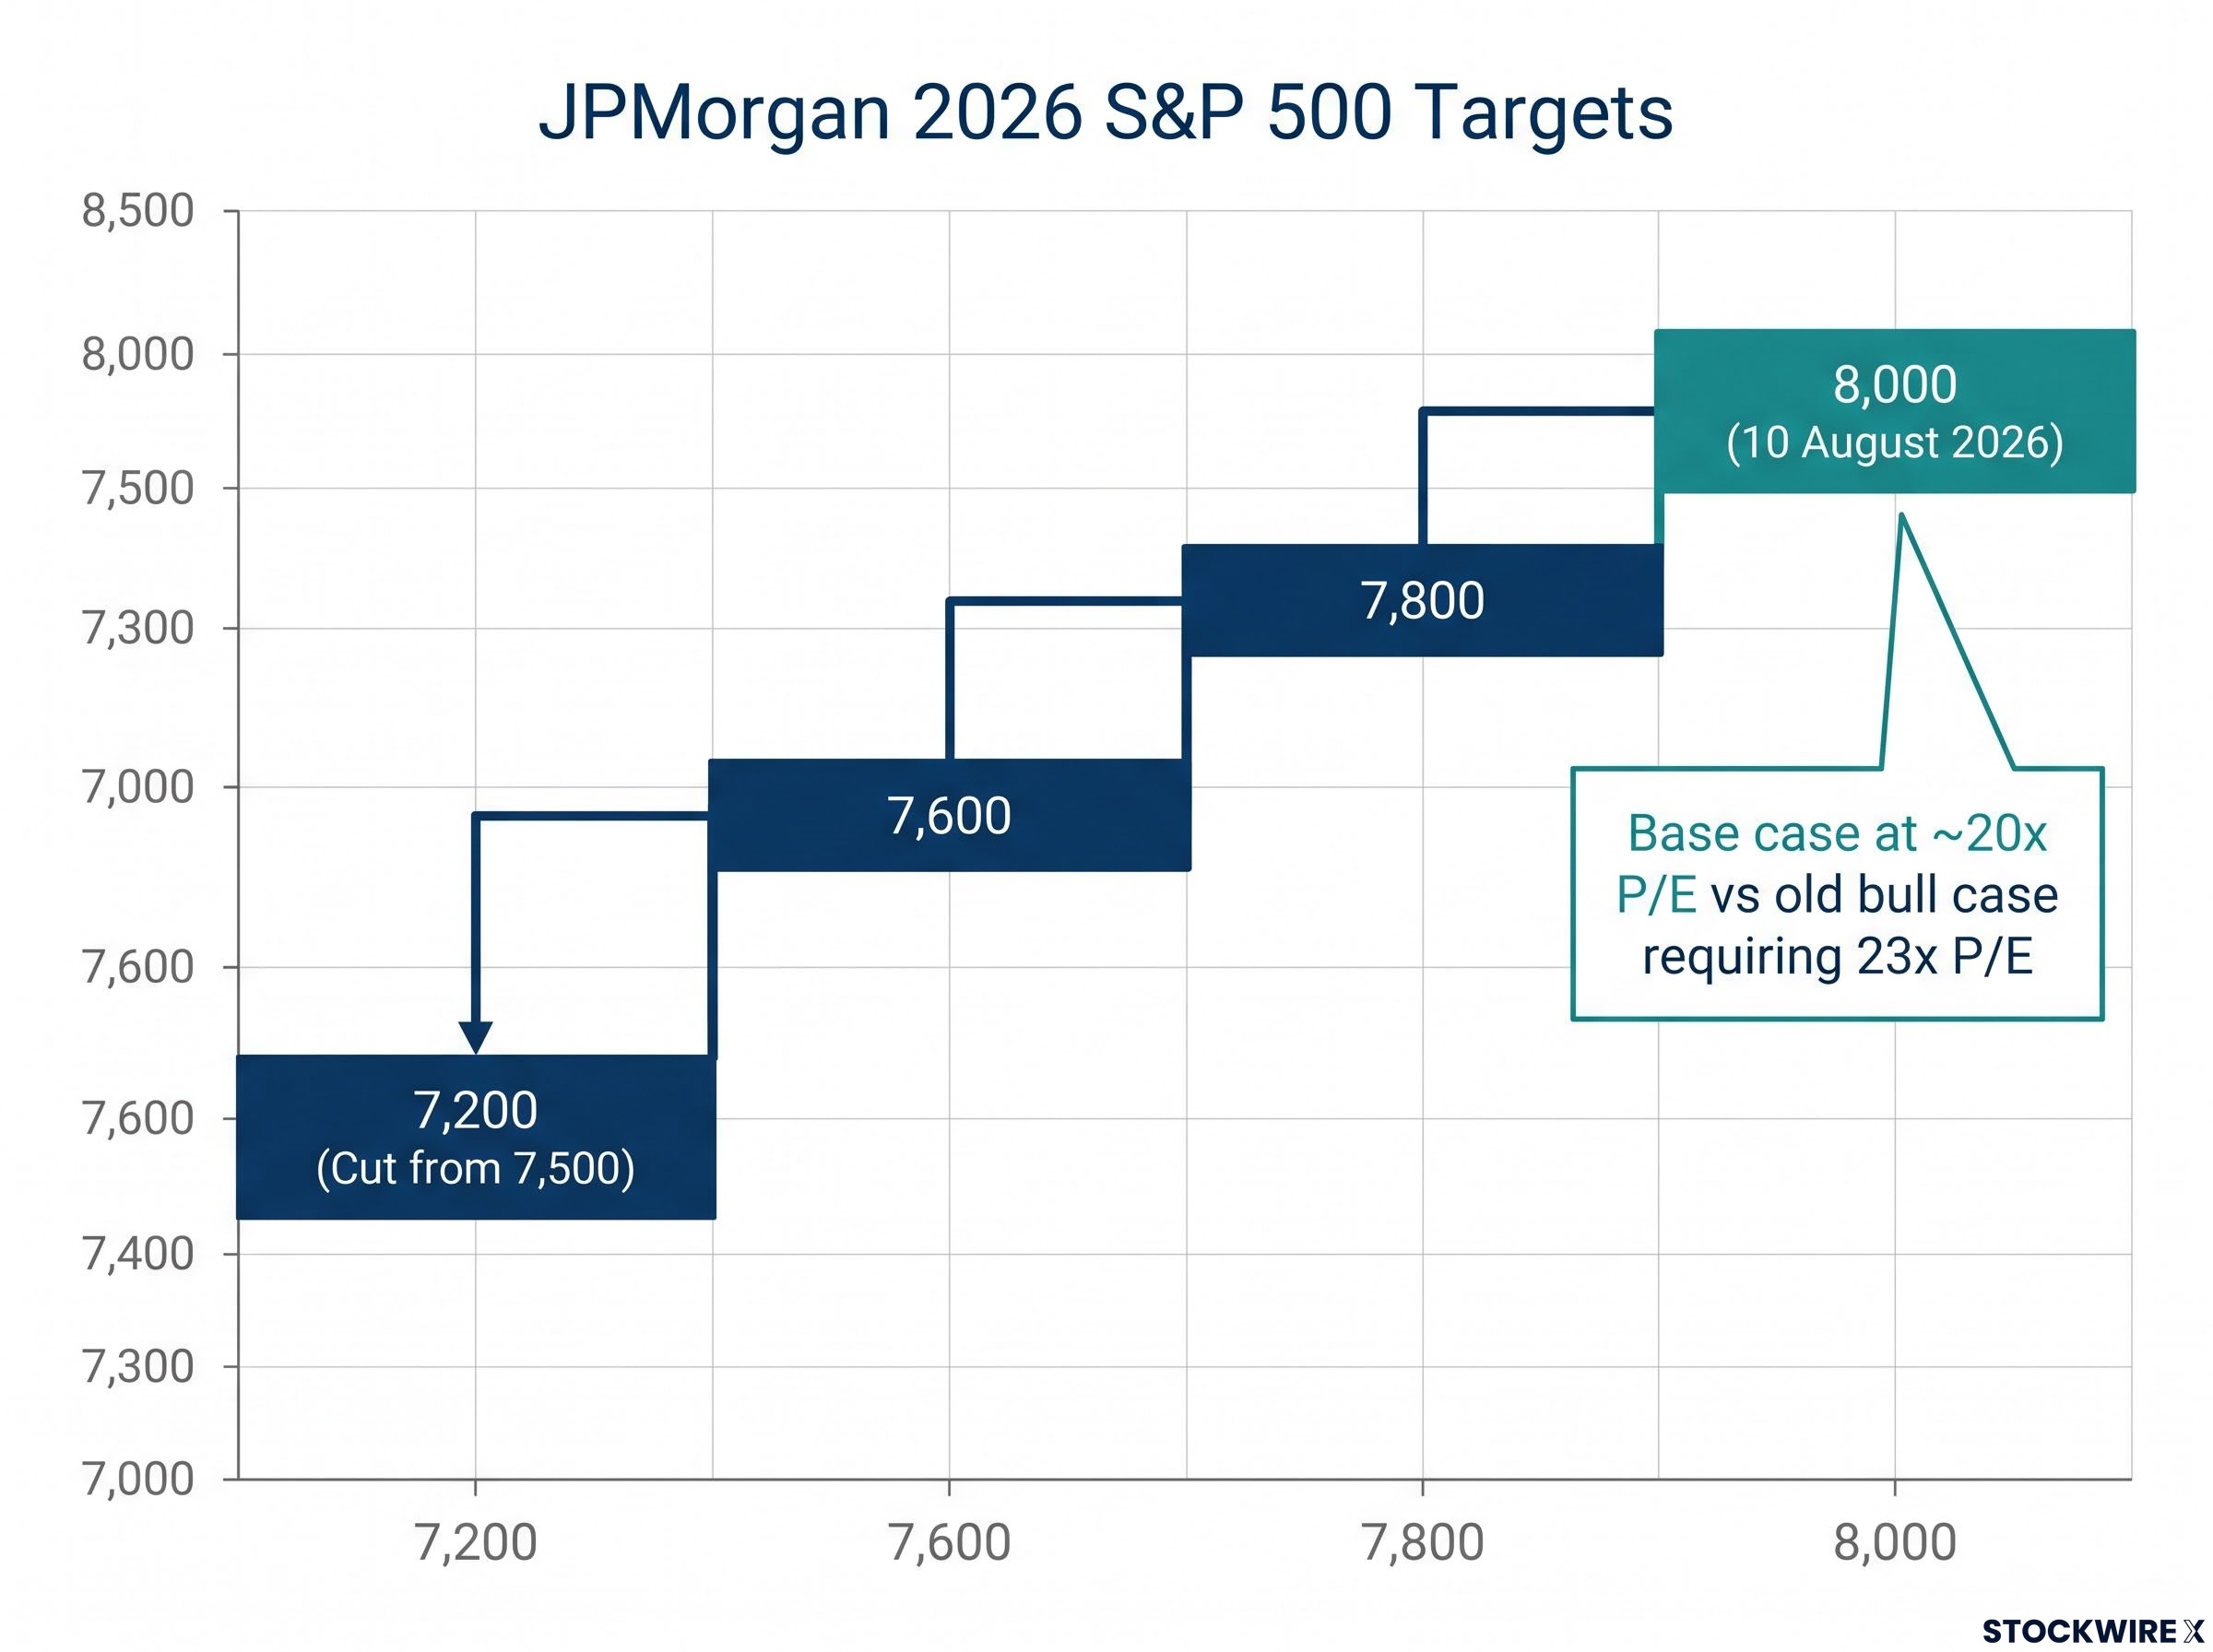
Prior to this revision, 8,000 was explicitly described in JPMorgan notes as a bull or “blue-sky” scenario, reachable only if the forward price-to-earnings (P/E) multiple, the amount investors pay per dollar of expected earnings, re-expanded from approximately 22x to 23x or the Fed eased more aggressively.
That framing has now changed. The fact that a prior bull scenario has become the official base case tells you that JPMorgan’s internal confidence threshold has shifted materially. The earnings strength was sufficient to reach 8,000 without needing investors to pay a premium multiple, and that is a meaningful quality upgrade in the firm’s own framework.
The Q1 2026 blended growth rate of 27.1% came in nearly double the pre-season consensus estimate of 13.1%, with an 84% beat rate and an aggregate surprise almost three times the five-year norm, establishing the trajectory that made JPMorgan’s mid-year target upgrades analytically defensible.
When big ASX news breaks, our subscribers know first
What made Q2 earnings strong enough to move the target
The headline beat is not where the story sits. The story sits in the breadth.
By the time of the 10 August revision, roughly nine in ten S&P 500 constituents had already published Q2 results. The signal that resonated with JPMorgan’s strategists was not the aggregate index-level performance; it was that gains were spread across a wide range of sectors rather than driven by a narrow cluster of large-cap technology companies.
The Q2 2026 earnings season entered with analysts having already raised estimates by 3.4% during the quarter, the opposite of the historical pattern of pre-season cuts, meaning the 23.6% projected growth rate represented a genuinely harder hurdle than headline consensus figures typically signal.
That breadth is the quality signal. In JPMorgan’s analytical framework, broad-based earnings outperformance is treated as a stronger and more durable foundation than narrow concentration. Key sectoral breadth signals included:
- Positive surprises from industrials and healthcare, not just technology
- Consumer-facing sectors delivering margin stability despite higher input costs
- Financials contributing meaningfully to aggregate earnings growth
- Energy names sustaining profitability even as commodity prices normalised
Mid-year, strategists described the ongoing earnings upgrade cycle as “unprecedented,” with consensus growth for the next two years revised up approximately 20% on average.
For a reader holding a diversified equity portfolio, this changes the risk calculus. Broad-based earnings strength means the market’s foundation is wider than it was during the 2023-2024 mega-cap-dominated period, when a stumble from three or four names could drag the entire index. That concentration risk has meaningfully diminished.
AI returns and earnings quality: what the headline EPS figure actually includes
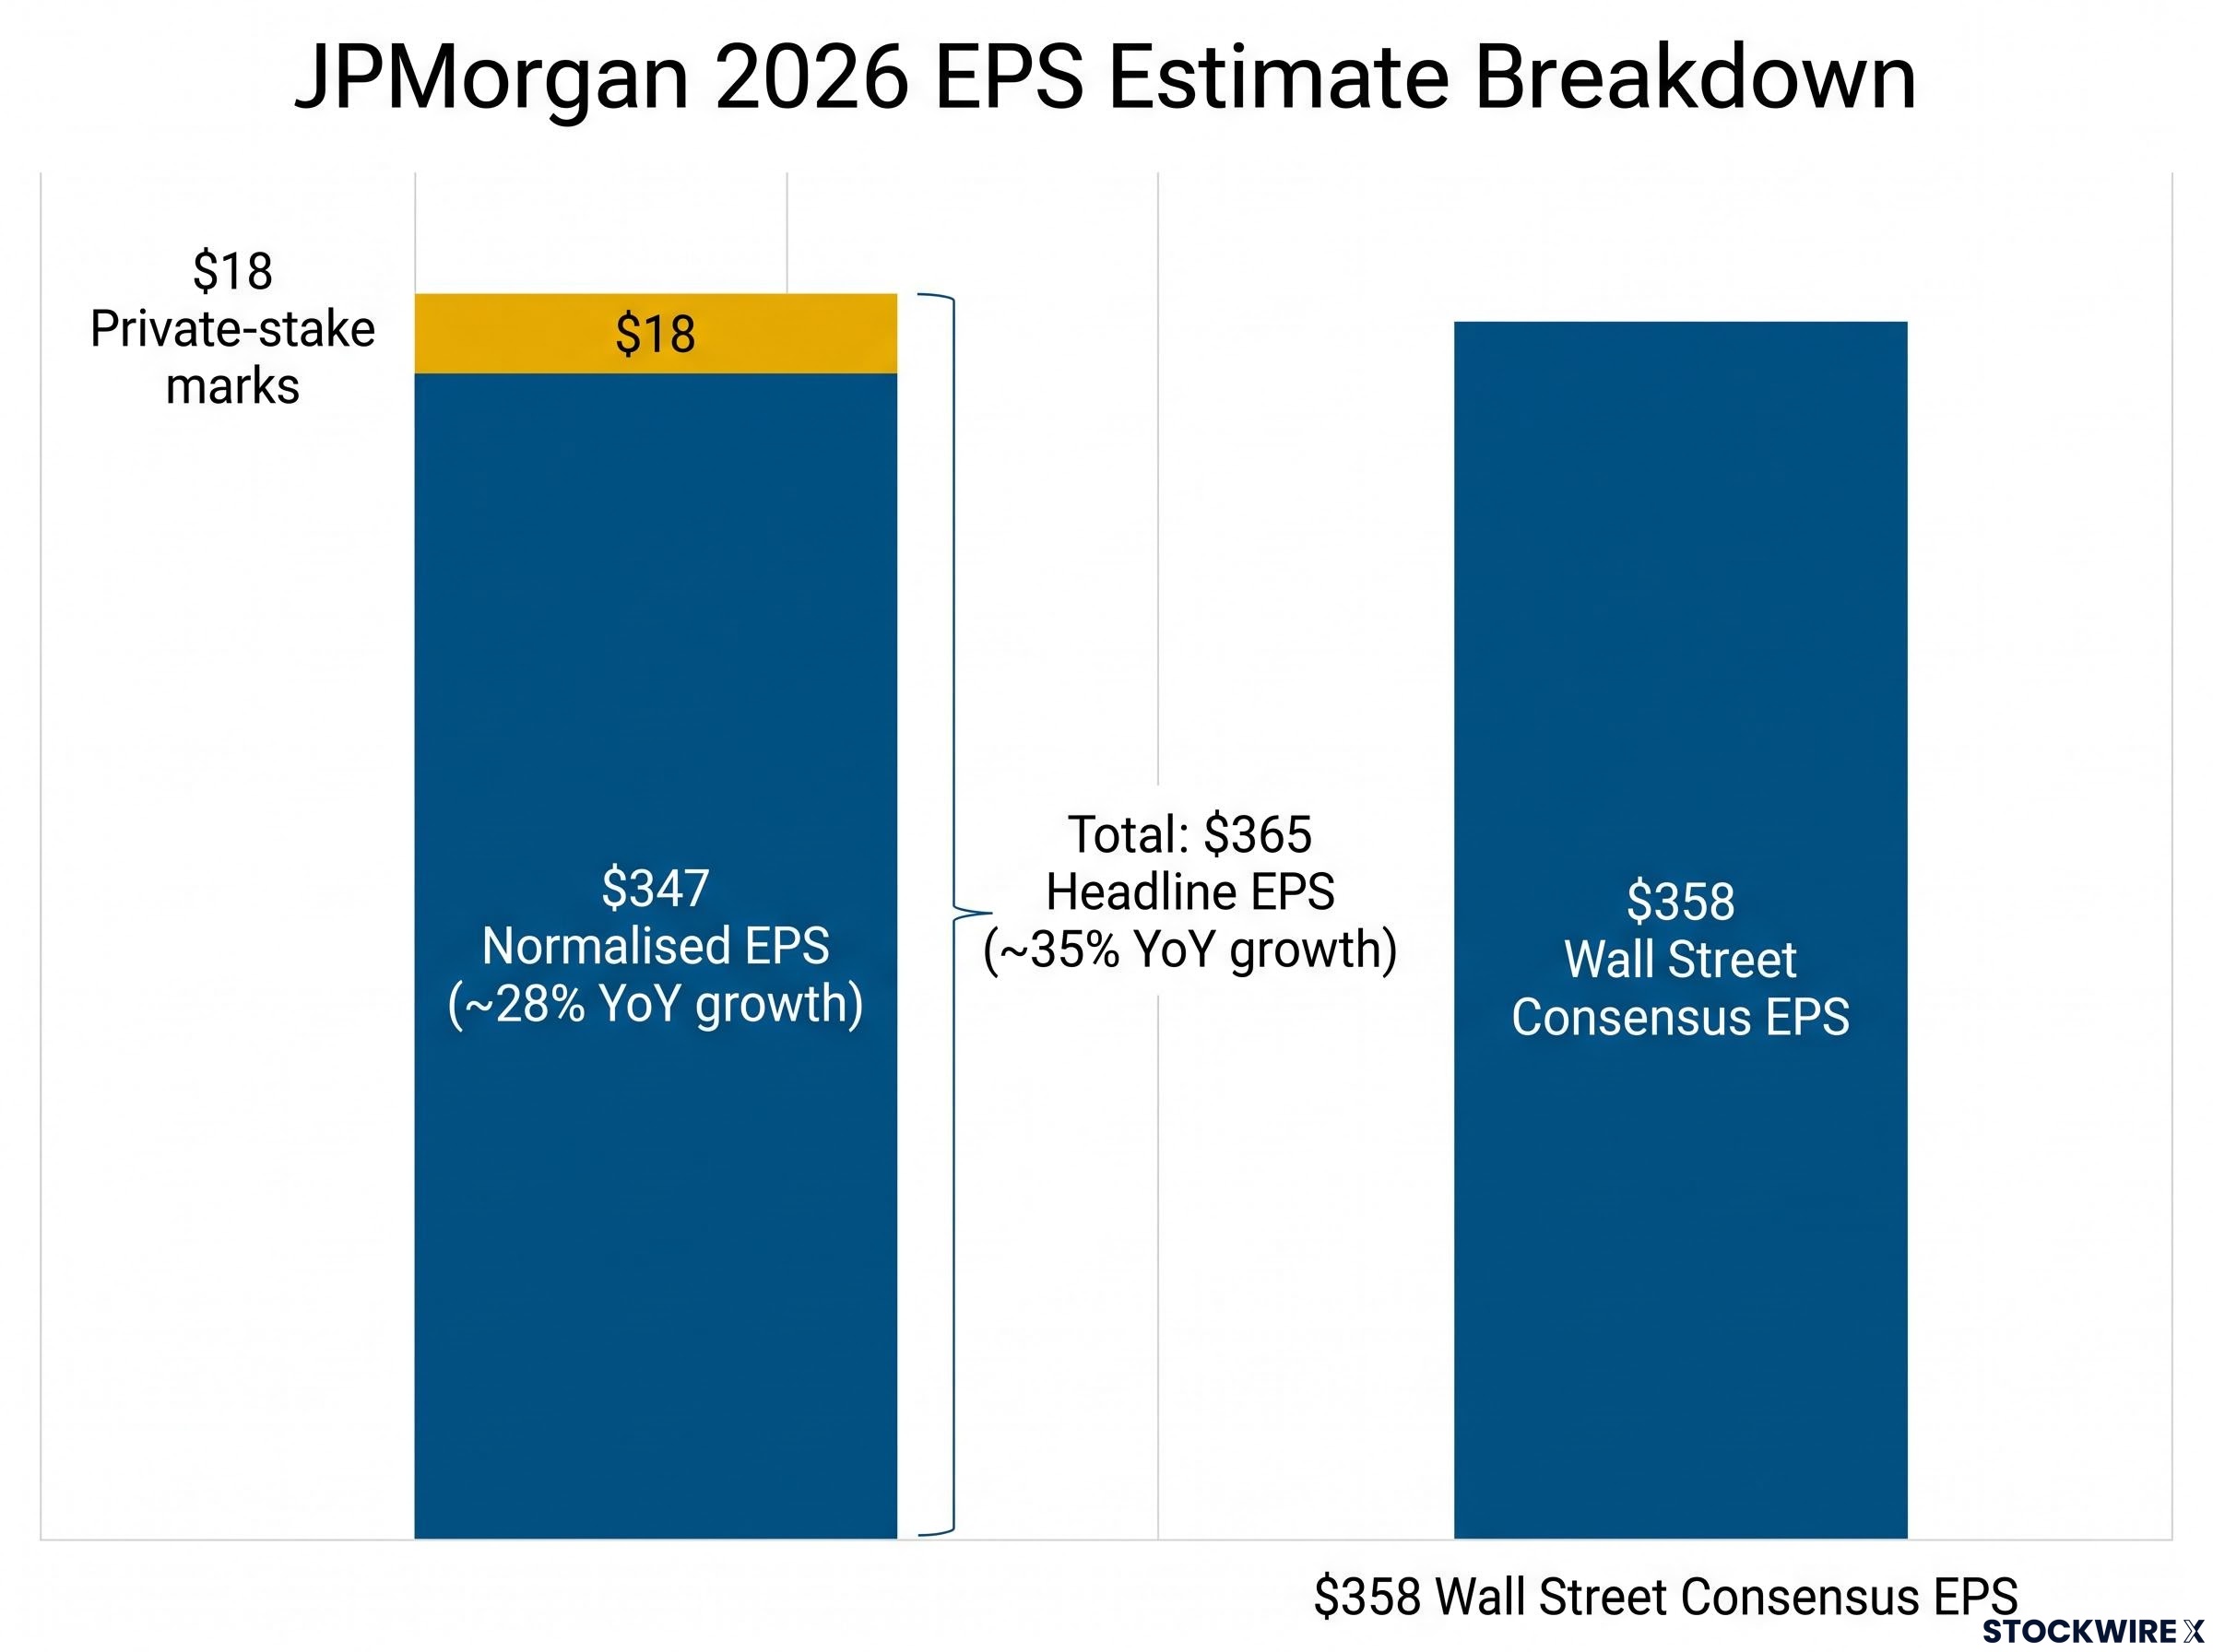
Start with the numbers as JPMorgan presents them. The bank’s 2026 S&P 500 earnings per share (EPS) estimate, the total profit generated by index constituents divided by the number of shares, has been revised to $365, a figure that points to approximately 35% year-over-year growth and sits ahead of the Wall Street consensus at $358. The 2027 projection was lifted to $420, equating to roughly 15% year-over-year growth, though strategists positioned it modestly below an earlier interim figure to reflect emerging risks around diminishing AI-related pricing power.
The AI capex link is direct. A near doubling of AI-related capital expenditure by large technology and hyperscaler firms is embedded in these EPS upgrades as a driver of both top-line growth (new AI products and services generating revenue) and margin expansion (productivity and automation gains reducing unit costs).
Those are strong numbers. Now the quality lens.
According to JPMorgan’s own analysis, around $18 of the $365 headline 2026 EPS figure is attributable to the estimated fair value of private-company equity stakes, marked to first-half 2026 levels. Private-stake valuations are the estimated market value of shares a company holds in non-publicly-traded businesses. These marks can fluctuate significantly and may not recur year to year.
The FASB fair value disclosure requirements governing how companies report private-company equity stakes establish the accounting framework that determines how these marks flow into headline EPS figures, which is why the roughly $18 contribution from private-stake valuations in JPMorgan’s $365 estimate is treated as a distinct quality consideration rather than a core earnings signal.
Remove that $18 component and the underlying 2026 EPS figure falls to roughly $347, representing year-over-year growth of approximately 28%. Still strong, but materially different from the headline.
| Metric | Figure | YoY growth | Key note |
|---|---|---|---|
| 2026 Headline EPS (JPMorgan) | $365 | ~35% | Includes ~$18 from private-stake marks |
| 2026 Normalised EPS (ex-private stakes) | $347 | ~28% | Core operational earnings only |
| 2026 Consensus EPS (Wall Street) | $358 | — | JPMorgan above consensus partly due to private-stake inclusion |
| 2027 EPS (JPMorgan) | $420 | ~15% | Set below earlier interim figure; reflects AI pricing power risk |
The number to interrogate: Normalised 2026 EPS of approximately $347. A reader applying a 20x multiple to the $365 headline figure is implicitly applying a higher multiple to core earnings than the headline P/E suggests. The market is slightly more expensively priced on a normalised basis than it appears at first glance.
That is not a reason to dismiss the call. It is a reason to understand exactly what is being priced into the market at these levels.
This article is for informational purposes only and should not be considered financial advice. Investors should conduct their own research and consult with financial professionals before making investment decisions.
Why JPMorgan held the valuation multiple steady and what that signals
The entire path from 7,600 to 8,000 has been driven by EPS upgrades, not by investors paying materially more per dollar of earnings. That is the analytically preferable basis for index appreciation, and it is worth understanding why JPMorgan was deliberate about it.
When the target sat at 7,600 and then 7,800, the base-case forward P/E was approximately 22x. The bull case of 8,000 required re-expansion to approximately 23x, contingent on Fed easing and geopolitical resolution.
When the 10 August formalisation arrived, JPMorgan left its forward multiple at roughly 20x, a figure below either of the prior base-case assumptions, even as strategists characterised the fundamental backdrop as among the most supportive seen since the Global Financial Crisis.
How the path to 8,000 changed from the original bull case
Three structural constraints explain why the firm is bullish on earnings but not on multiples:
- Elevated real and nominal interest rates compress the present value of future earnings, limiting how high the P/E can stretch
- Ongoing geopolitical risks, including U.S.-Iran tensions cited in JPMorgan notes, maintain a risk premium in valuations
- Persistent equity and debt issuance volume continues to compete for investor capital, capping the upward drift in multiples
Real yield pressure on multiples is one of the three structural constraints JPMorgan cites for keeping its forward P/E at 20x rather than re-rating toward the 22x-23x range that characterised earlier 2026 base cases; the 10-year TIPS real yield reaching a 12-month high of 2.22% establishes a materially higher hurdle rate for equity valuations than models built on sub-1% real rate assumptions can accommodate.
The original bull case required the market to pay 23x earnings to reach 8,000. The formalised base case reaches the same level at 20x because earnings grew enough to close the gap. That is a meaningful quality upgrade in JPMorgan’s own framework.
A market reaching 8,000 on earnings rather than on multiple expansion is one where valuations are not stretched by sentiment alone. That changes how resilient the index is likely to be if earnings disappoint in a quarter or two, but it also means there is less cushion if the earnings story itself falters.
Three variables that will determine whether 8,000 holds through year-end
The target is set. The question is whether the market can sustain it. JPMorgan’s own analytical framework points to three specific, trackable variables.
| Variable | Positive signal | Deterioration signal |
|---|---|---|
| Earnings breadth | Sector-wide distribution continues; gains not narrowing back to mega-cap concentration | Breadth contracts; index returns become dependent on five or fewer names |
| AI monetisation | AI capex continues translating into measurable productivity gains, margin expansion, and pricing power | AI spending accelerates but revenue conversion stalls; the 2027 EPS estimate of $420 comes under pressure |
| Earnings quality | Proportion of EPS from non-core sources (private-stake marks, one-off gains) normalises toward core operations | Private-stake marks and non-recurring items grow as a share of headline EPS, widening the gap between $365 and $347 |
JPMorgan’s stance is constructive but not euphoric: bullish on earnings, more cautious on valuation re-rating, and treating the 8,000 target as analytically visible but not inevitable.
For an investor already holding broad S&P 500 exposure, these are not abstract macro concerns. They are the specific data points to watch in Q3 earnings season to assess whether the bank’s 8,000 call remains on track.
Past performance does not guarantee future results. Financial projections are subject to market conditions and various risk factors.
What JPMorgan’s 8,000 call means for how you read the rest of earnings season
JPMorgan’s call has two layers, and both matter. The headline layer is optimistic: strong, broad earnings plus AI returns justify 8,000. The embedded layer is more cautious: earnings quality, the private-stake contribution, and disciplined multiples all suggest the bank sees limits to how far sentiment alone can carry the index.
The 8,000 target implies approximately 3% upside from recent closes. That is not a moonshot. It is a call that says the market is close to fair value on JPMorgan’s numbers, with the remaining upside driven by earnings delivery rather than speculative re-rating.
The benchmark to carry forward: Normalised 2026 EPS of approximately $347. When Q3 results arrive, watching whether that normalised figure is holding, expanding, or compressing will tell you more about the durability of JPMorgan’s thesis than headline beats alone.
The 2027 EPS estimate of $420 is the next major data point for the AI monetisation thesis, and its deliberate positioning below earlier interim figures signals that even JPMorgan sees diminishing pricing power as a risk worth pricing in.
A headline target of 8,000 from JPMorgan is news. Understanding what the bank’s own data says about the quality of the earnings behind that target is what gives you an edge in evaluating it.
For readers wanting to compare JPMorgan’s earnings-driven framework against a peer bank’s methodology, our full explainer on Morgan Stanley’s S&P 500 target examines how a rival firm applied similar earnings expansion logic to its own price target, including the $339 EPS projection and the role of earnings revision breadth in validating the thesis.