Gold gained 0.90% on Friday to trade at approximately $4,386, and the move was not a random risk-off pop. It followed the worst US retail sales print in over a year, a consumer sentiment reading that dropped to its lowest level since early 2026, and a futures market that quietly slashed September Fed hike odds from roughly 55% to 31% in the space of a single week.
That sequence matters. A specific chain of macro data reset what the market believes the Federal Reserve will do next month, the dollar fell below a psychologically significant level, real yields drifted lower across the week, and gold pushed to within striking distance of a price ceiling that bulls have not convincingly cleared.
Here is what the data, the dollar, and the chart are each telling you about whether this rally holds, and what needs to happen next for each signal to confirm.
One week of data that repriced the September Fed meeting
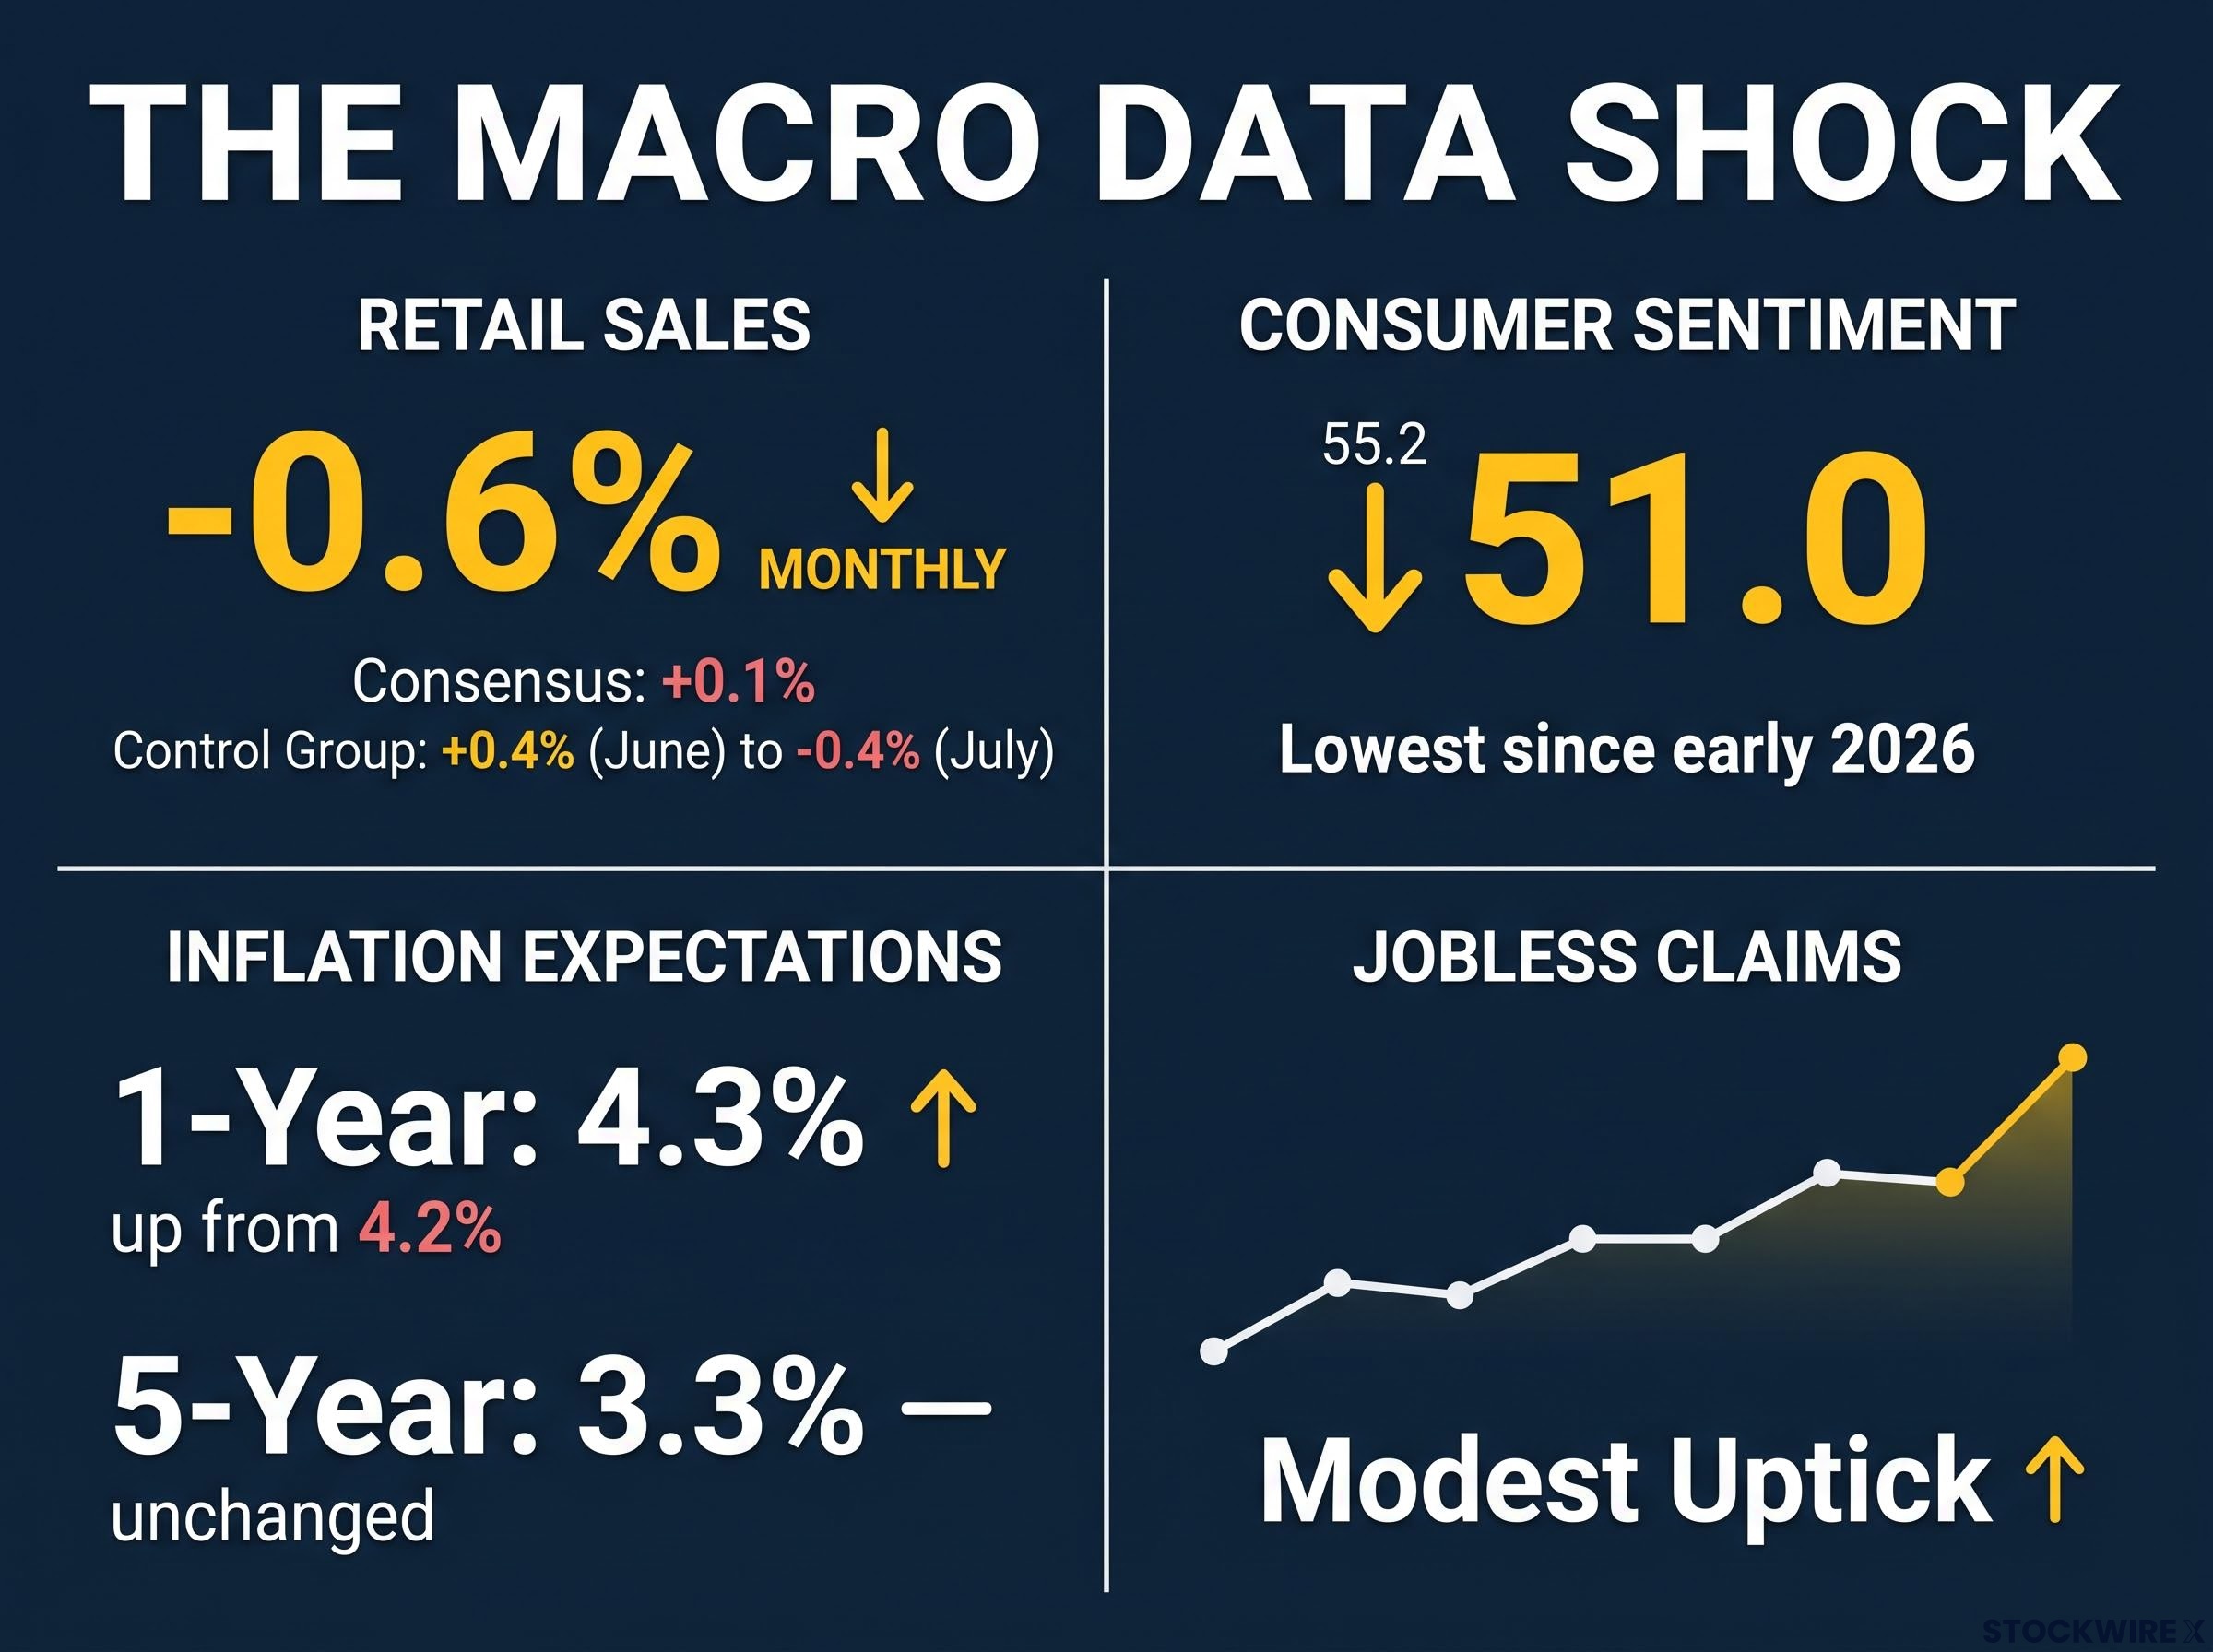
The headline shock landed on Friday. Monthly retail and food services sales came in at -0.6%, breaking a run of five consecutive months of growth and falling well short of the +0.1% expansion that consensus had pencilled in.
-0.6% monthly, the largest monthly decline in over a year
That alone would have been enough to move rate expectations. But the detail underneath made it worse. The retail control group, the subset of retail data that feeds directly into GDP consumer spending calculations, swung from a +0.4% gain in June to a -0.4% contraction in July, according to the US Commerce Department. The part of the data the Fed watches most closely did not just cool; it flipped.
The US Census Bureau retail trade data for July 2026 confirmed the -0.6% monthly print, marking the sharpest single-month decline in over a year and the first contraction after five consecutive months of growth.
Layer in what arrived alongside it:
- University of Michigan Consumer Sentiment (preliminary August): 51.0, down from 55.2
- One-year inflation expectations: 4.3%, up from 4.2%
- Five-year inflation expectations: 3.3%, unchanged
- Weekly jobless claims: a modest uptick, reinforcing the softer labour market signal
None of these individually would have forced a major repricing. Taken together, they painted a picture of synchronised softening across consumer spending, sentiment, and the labour market at the start of Q3.
The market responded accordingly. Prime Terminal data show that swap markets were pricing just a 31% chance of a Fed rate hike at the September meeting by 14 August, roughly half the 55% probability assigned only a week earlier. What changed was not just what economists expect about growth; it was what the market believes the Fed will actually do next month.
The Fed’s dot plot revision in June already encoded at least one additional hike before December, meaning the September meeting the market is now repricing was flagged as a live possibility in the FOMC’s own projections before Friday’s retail sales data shifted the probability calculus.
When big ASX news breaks, our subscribers know first
How a softer dollar and falling yields set the table for gold
When September hike odds drop by nearly half in a week, two things happen mechanically. The dollar loses a forward-looking support pillar, because fewer expected rate increases mean less yield advantage for holding US currency. And real yields drift lower, because the market is pricing in less tightening ahead.
Both of those shifts improve gold’s relative appeal. Gold pays no yield; when the yields available from Treasury bonds fall, the opportunity cost of holding gold falls with them.
The real yield trajectory matters as much as the nominal rate move: with the 10-year TIPS real yield at 2.22%, its highest in over 12 months, the week’s drift lower in rate-hike expectations represents a meaningful shift in the hurdle rate that competing assets must clear relative to gold.
| Asset / Indicator | Friday’s reading | Direction of travel (week) |
|---|---|---|
| DXY (US Dollar Index) | 99.57 (down ~0.4%) | Lower |
| US 10-year Treasury yield | 4.684% (up 3.5 bps intraday) | Lower over the week |
| XAU/USD spot | ~$4,386 (up ~0.90%) | Higher |
The DXY’s drop to 99.57 placed the dollar index below the psychologically significant 100 level, which amplifies gold’s purchasing-power appeal for non-US buyers.
Why the daily yield number misleads
The 10-year yield was technically up 3.5 basis points on Friday, which might seem to contradict a gold rally. It does not. Intraday bond moves often reflect positioning and liquidity adjustments, not a fresh macro reassessment. The relevant signal for gold is the directional shift in real-rate expectations over the course of the week, and that direction was lower. The daily tick is noise; the weekly drift is where the actual signal lives for gold pricing.
What the $4,400 level means and where gold sits against it
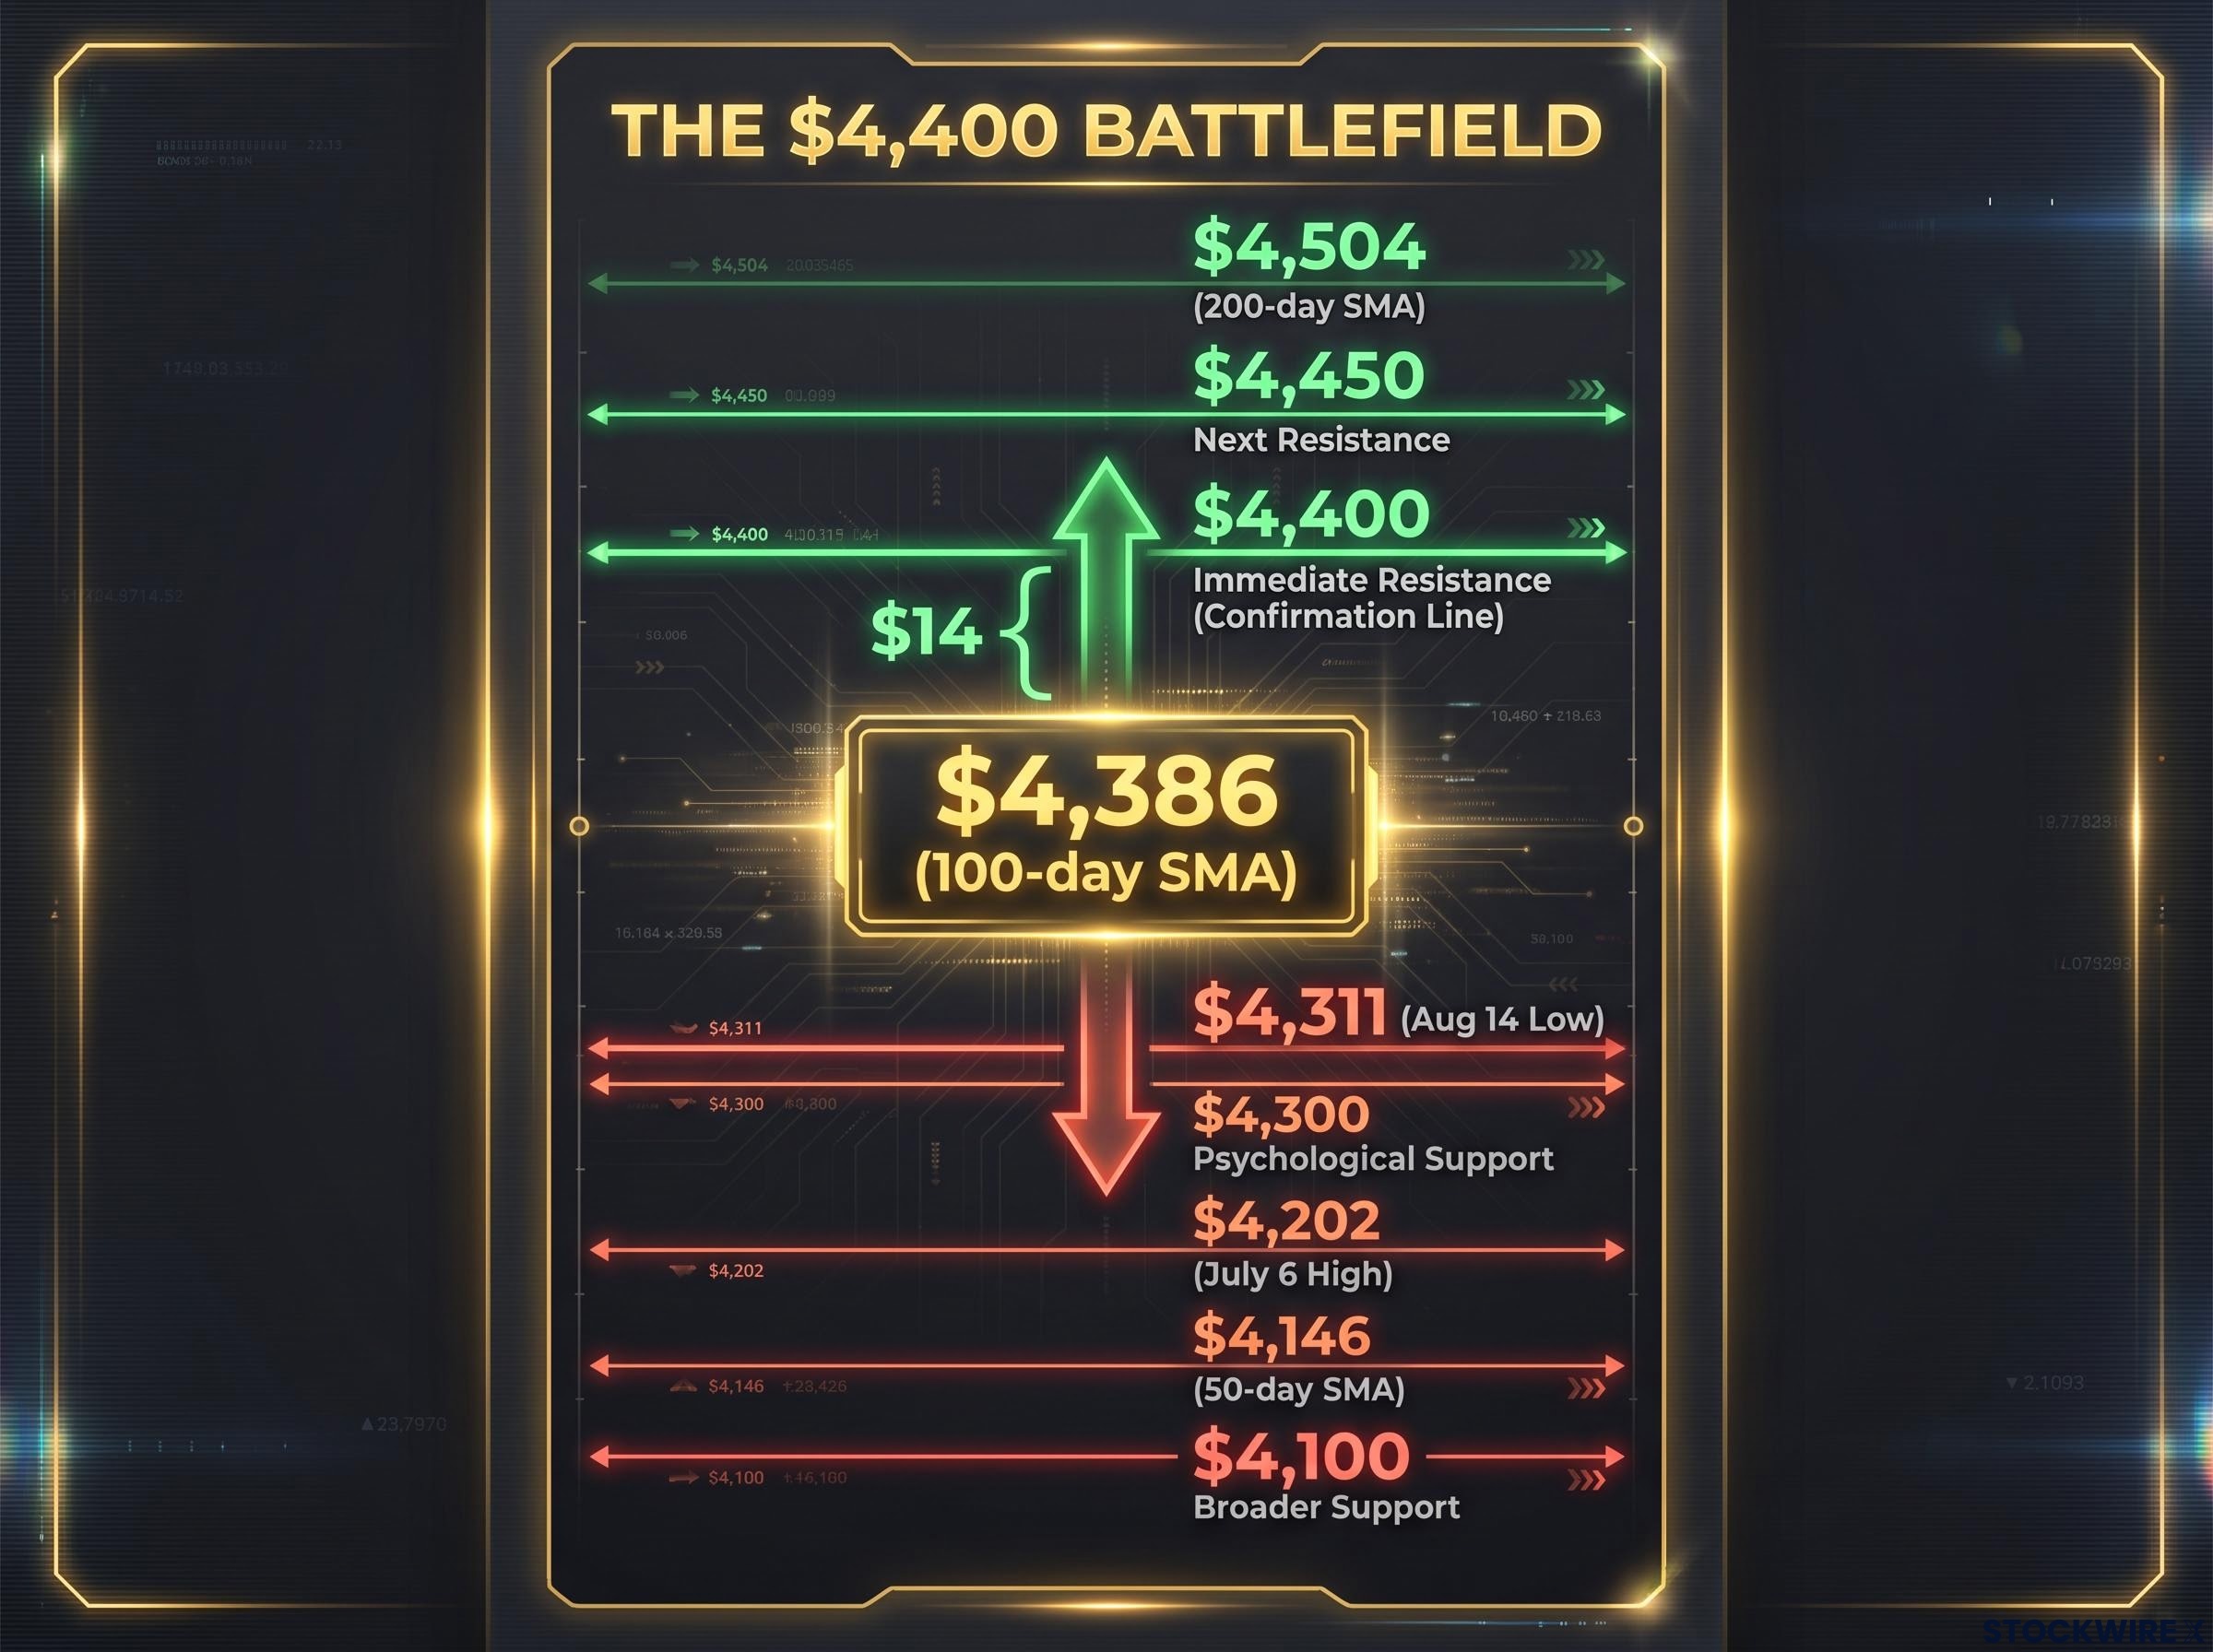
Trading at $4,386, gold is effectively pinned to the 100-day Simple Moving Average (SMA), which has served as the central reference point for recent consolidation. That positioning is not neutral. It is a compression point: either a confirmed breakout or a rejection becomes the next meaningful move, and each outcome leads to a different set of levels.
The level that matters is $4,400. Buyers have approached it repeatedly but have not convincingly cleared it. “Convincingly cleared” means a daily close above, preferably on expanding volume, not just an intraday touch.
“A daily close above $4,400 is the technical confirmation bulls need; anything short of that keeps this rally categorised as unconfirmed”
If $4,400 breaks on a closing basis, the path opens to the next set of targets. If it does not, the downside levels come into play.
| Level | Significance |
|---|---|
| Upside targets | |
| $4,400 | Immediate resistance; the breakout confirmation line |
| $4,450 | Next resistance if $4,400 breaks on a closing basis |
| $4,504 | 200-day SMA; extended bullish objective |
| Downside supports | |
| $4,311 | Session intraday low (14 August); first downside support |
| $4,300 | Psychological support; a break below risks leveraged long unwinding |
| $4,202 | July 6 high |
| $4,146 | 50-day SMA |
| $4,100 | Broader support area |
What this tells you is that the distance between the current price and the confirmation level is narrow, roughly $14, but the distance between confirmation and the next target ($4,450-$4,504) is considerably wider. That asymmetry shapes how you should think about risk and reward at this level.
The gold-dollar relationship explained for readers new to the trade
If you are watching gold for the first time in this cycle, the question you are probably asking is straightforward: why does a weak dollar push gold up?
The mechanism works in three steps:
- The dollar weakens. Gold is priced in US dollars, so when the dollar falls, gold becomes cheaper in other currencies. That supports demand from non-US buyers.
- Real yields fall. Gold competes with Treasury bonds for capital. When expected yields decline (as they do when rate-hike odds drop), the opportunity cost of holding a non-yielding asset like gold falls with them.
- Gold’s relative appeal rises. With the dollar softer and yields lower, capital that might otherwise sit in Treasuries finds gold more attractive on a relative basis.
The DXY at 99.57, below the psychologically significant 100 level, and September hike probability at roughly 31% (down from 55% the prior week) mean both steps one and two are active right now.
Rate repricing vs. risk-off: two different gold setups
This distinction matters for durability. A rate-repricing rally, where gold rises because the market expects less tightening, tends to hold as long as the macro data continues to support the new expectation. A fear-driven spike, where gold surges on a geopolitical shock or a sudden risk-off event, tends to reverse once the catalyst passes.
The current move is a rate-repricing story. There were no major new Middle East escalation headlines during Friday’s session. Analysts note that retail sales are still approximately +5% higher year-on-year, indicating cooling momentum rather than outright consumer collapse. The economy is slowing, not breaking, and that is a different and more durable setup for gold than a panic bid.
What has to happen for this rally to hold, and what breaks it
The setup reduces to two variables, one technical and one fundamental.
Bull case conditions:
- A sustained daily close above $4,400, confirming the breakout and opening a path toward the $4,450-$4,504 corridor
- Subsequent US data releases and Fed communication continuing to validate softer growth without triggering a hard-landing narrative
Bear case conditions:
- A Fed speaker delivering hawkish pushback along the lines of “one weak month does not change our plans,” which would likely lift hike odds, support the dollar, and cap the gold move
- An upside surprise in upcoming US data that reverses the softening trend and pushes September hike probability back toward where it started the week
“Hawkish Fed pushback after a single soft data print is a historically common pattern, making this a live risk even as the underlying data trend softens”
Should $4,400 give way and the macro narrative shift against gold, the initial downside targets cluster at $4,311 and $4,300. A sustained deterioration in the data picture could then pull price further toward $4,202 and the 50-day SMA sitting at $4,146.
The bear case price targets circulating among institutional desks are considerably more severe than the $4,311-$4,300 immediate support cluster: Bank of America’s technical team identified five concurrent bearish signals in mid-July, including an RSI reading of 90 that has only appeared at the 1980 and 2011 secular peaks, and flagged a downside scenario as deep as $3,315.
The asymmetry in outcomes is real. The bull case has a defined trigger, and the bear case has a defined trigger, which means this is a situation where watching for the triggers matters more than acting on Friday’s move alone.
This article is for informational purposes only and should not be considered financial advice. Investors should conduct their own research and consult with financial professionals before making investment decisions.
Past performance does not guarantee future results. Financial projections are subject to market conditions and various risk factors.
Whether $4,400 holds or not, the macro shift is the signal to watch
The week’s data collectively shifted what the market believes about September, and that shift, not Friday’s session move alone, is the structural driver worth tracking. A brief failure at $4,400 would not invalidate the macro thesis if data continues to soften; it would simply delay the technical confirmation.
Two variables matter from here: the next US data releases bearing on Q3 momentum, and the next Fed speaker appearance for any pushback against the soft-data narrative. Gold’s position is conditionally supportive given current conditions, but the condition is specific. The data trend needs to hold, and the Fed needs to let it breathe. Watch for both before treating this rally as confirmed.
Investors wanting to frame the current rally within the broader 2026 cycle context will find our deep-dive into gold’s H2 2026 price scenarios, which models the one-hike versus multi-hike Fed paths and their corresponding price targets in detail.
—