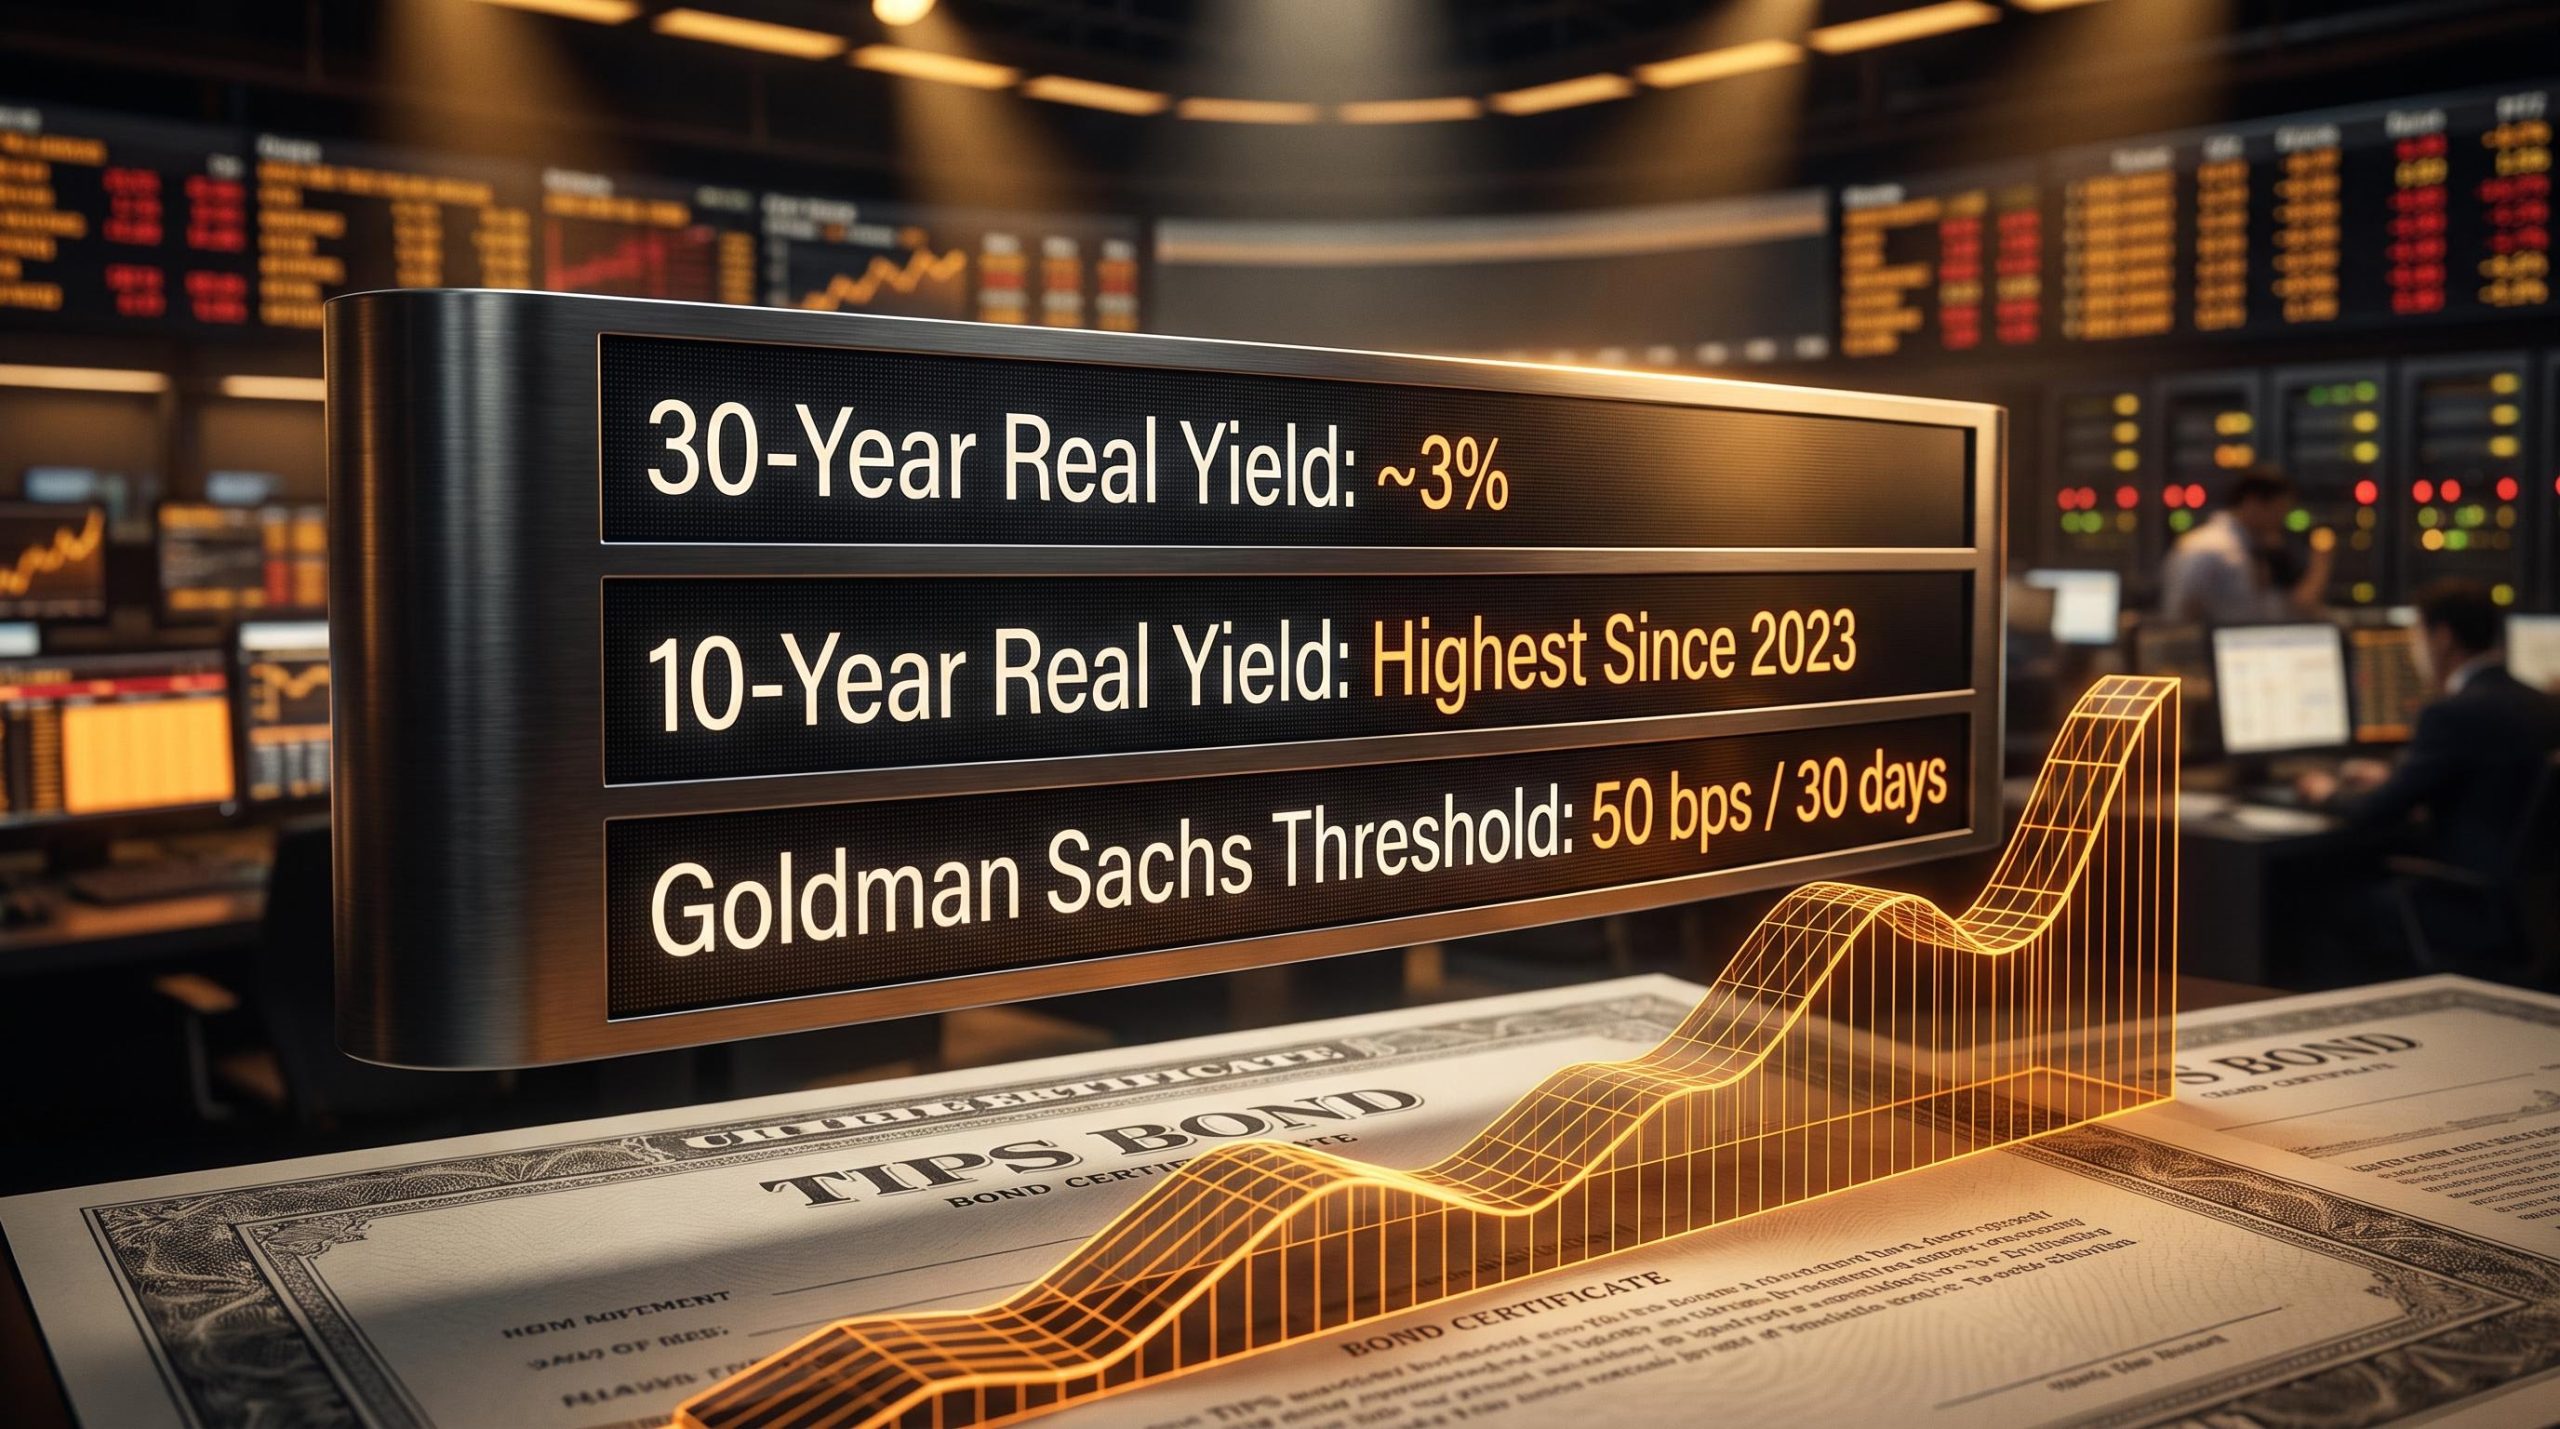
The real 30-year Treasury yield has climbed to nearly 3%, while the real 10-year has not been this elevated since 2023. Most investors tracking interest rates are watching the wrong number, and the one that actually matters for equity valuations is flashing a signal that deserves more attention than it is getting.
What makes this moment distinct from the general noise about rates is what real yields represent. They strip out inflation expectations, leaving the clean measure of what risk-free assets are actually offering in purchasing-power terms. When Treasuries deliver a meaningful positive real return, the structural case for holding equities at current multiples faces a direct challenge, one that has nothing to do with earnings revisions or recession risk.
Here is the framework for reading real yields as a live market signal: the specific mechanism through which they pressure equities, the threshold Goldman Sachs has identified as historically problematic, the 2023 precedent that maps onto today’s environment, and the portfolio variables worth monitoring right now.
Why real yields are the rate signal that actually matters for stocks
When a headline says “the 10-year yield rose to 4.5%,” that single number bundles together two very different forces: the real rate of return investors demand above inflation, and the inflation compensation they expect to receive. That bundling makes the nominal yield a noisier signal than most investors realise.
Real yields, the return left over after stripping out expected inflation (approximately: nominal yield minus expected inflation), are the cleaner measure. The U.S. Treasury publishes a Daily Real Yield Curve derived from Treasury Inflation-Protected Securities (TIPS), available at 5, 7, 10, 20, and 30-year maturities.
The distinction between nominal and real yields is foundational to reading bond yields as market signals: the nominal figure bundles inflation compensation together with the true risk-free return, obscuring the mechanical force that actually drives equity discount rates higher.
Why does this distinction matter for equities? Three mechanisms do the work:
- Cost-of-capital effect: Real yields represent the true risk-free rate. When they rise, the hurdle rate for every other investment rises with them.
- Present value compression: Higher real discount rates mathematically reduce the present value of future corporate earnings, independent of any change in those earnings expectations.
- Equity risk premium (ERP) compression: The ERP, roughly the earnings yield of stocks minus the real risk-free rate, shrinks unless stock prices fall or earnings estimates rise to compensate.
In U.S. Treasury analysis of the 2023 rate move, officials noted that the rise in 10-year nominal yields was “largely due to higher real yields as measured by TIPS,” while breakeven inflation stayed relatively stable.
That finding tells you something specific: when real yields drive the move rather than inflation expectations, the pressure on equity valuations is direct and mechanical. There is no buffer from the nominal earnings growth that higher inflation can sometimes provide. The discount rate rises, and the maths does the rest.
When big ASX news breaks, our subscribers know first
How rate velocity determines whether equity markets absorb or break under yield pressure
Not every yield increase creates the same stress. The level matters, but the speed of the move matters independently, and sometimes more.
According to Goldman Sachs strategists, equity markets have historically struggled when rates climb by more than two standard deviations across a given period. At present, that two-standard-deviation threshold works out to approximately 50 basis points on the 10-year yield over the course of a single month.
That number is worth treating as a live tripwire rather than a piece of research trivia. Here is why the speed of a move matters independently of where rates end up:
- Rebalancing lag: Portfolio allocation and hedging models cannot fully adjust in real time when yields spike sharply, leaving institutional portfolios temporarily mispositioned.
- Leveraged-strategy deleveraging: Margin calls triggered by fast rate moves force selling that has nothing to do with fundamental views on equities; it is mechanical unwinding.
- Discount-factor repricing: Equity indices can fall as discount rates rise even without any new negative earnings news, simply because the present value of the same earnings stream drops.
Measured against recent history, the real 10-year has not been this high since 2023, and the real 30-year has reached close to 3% as of late July 2026, meaning the baseline is already stretched. A yield move that would look modest on a year-to-date chart could, if it arrives within a single month, trigger the kind of forced institutional selling that has little to do with company fundamentals and everything to do with rate mathematics. That 50-basis-point threshold gives you a concrete benchmark for when to treat a yield move as a potential catalyst for broader equity volatility rather than background noise.
What the 2023 rate spike teaches us about navigating today’s environment
The 2023 episode offers the closest available case study for the configuration investors face right now. Walking through what happened, and why, turns today’s environment from something that feels unprecedented into a recognisable pattern with a documented playbook.
The sequence unfolded across roughly four months. Real 10-year TIPS yields climbed to around 1.8-2.0%, the highest since 2009. Nominal 10-year yields briefly touched 5%, a 16-year high. At the long end, 30-year nominal yields surged more than 120 basis points between early Q3 and late October 2023.
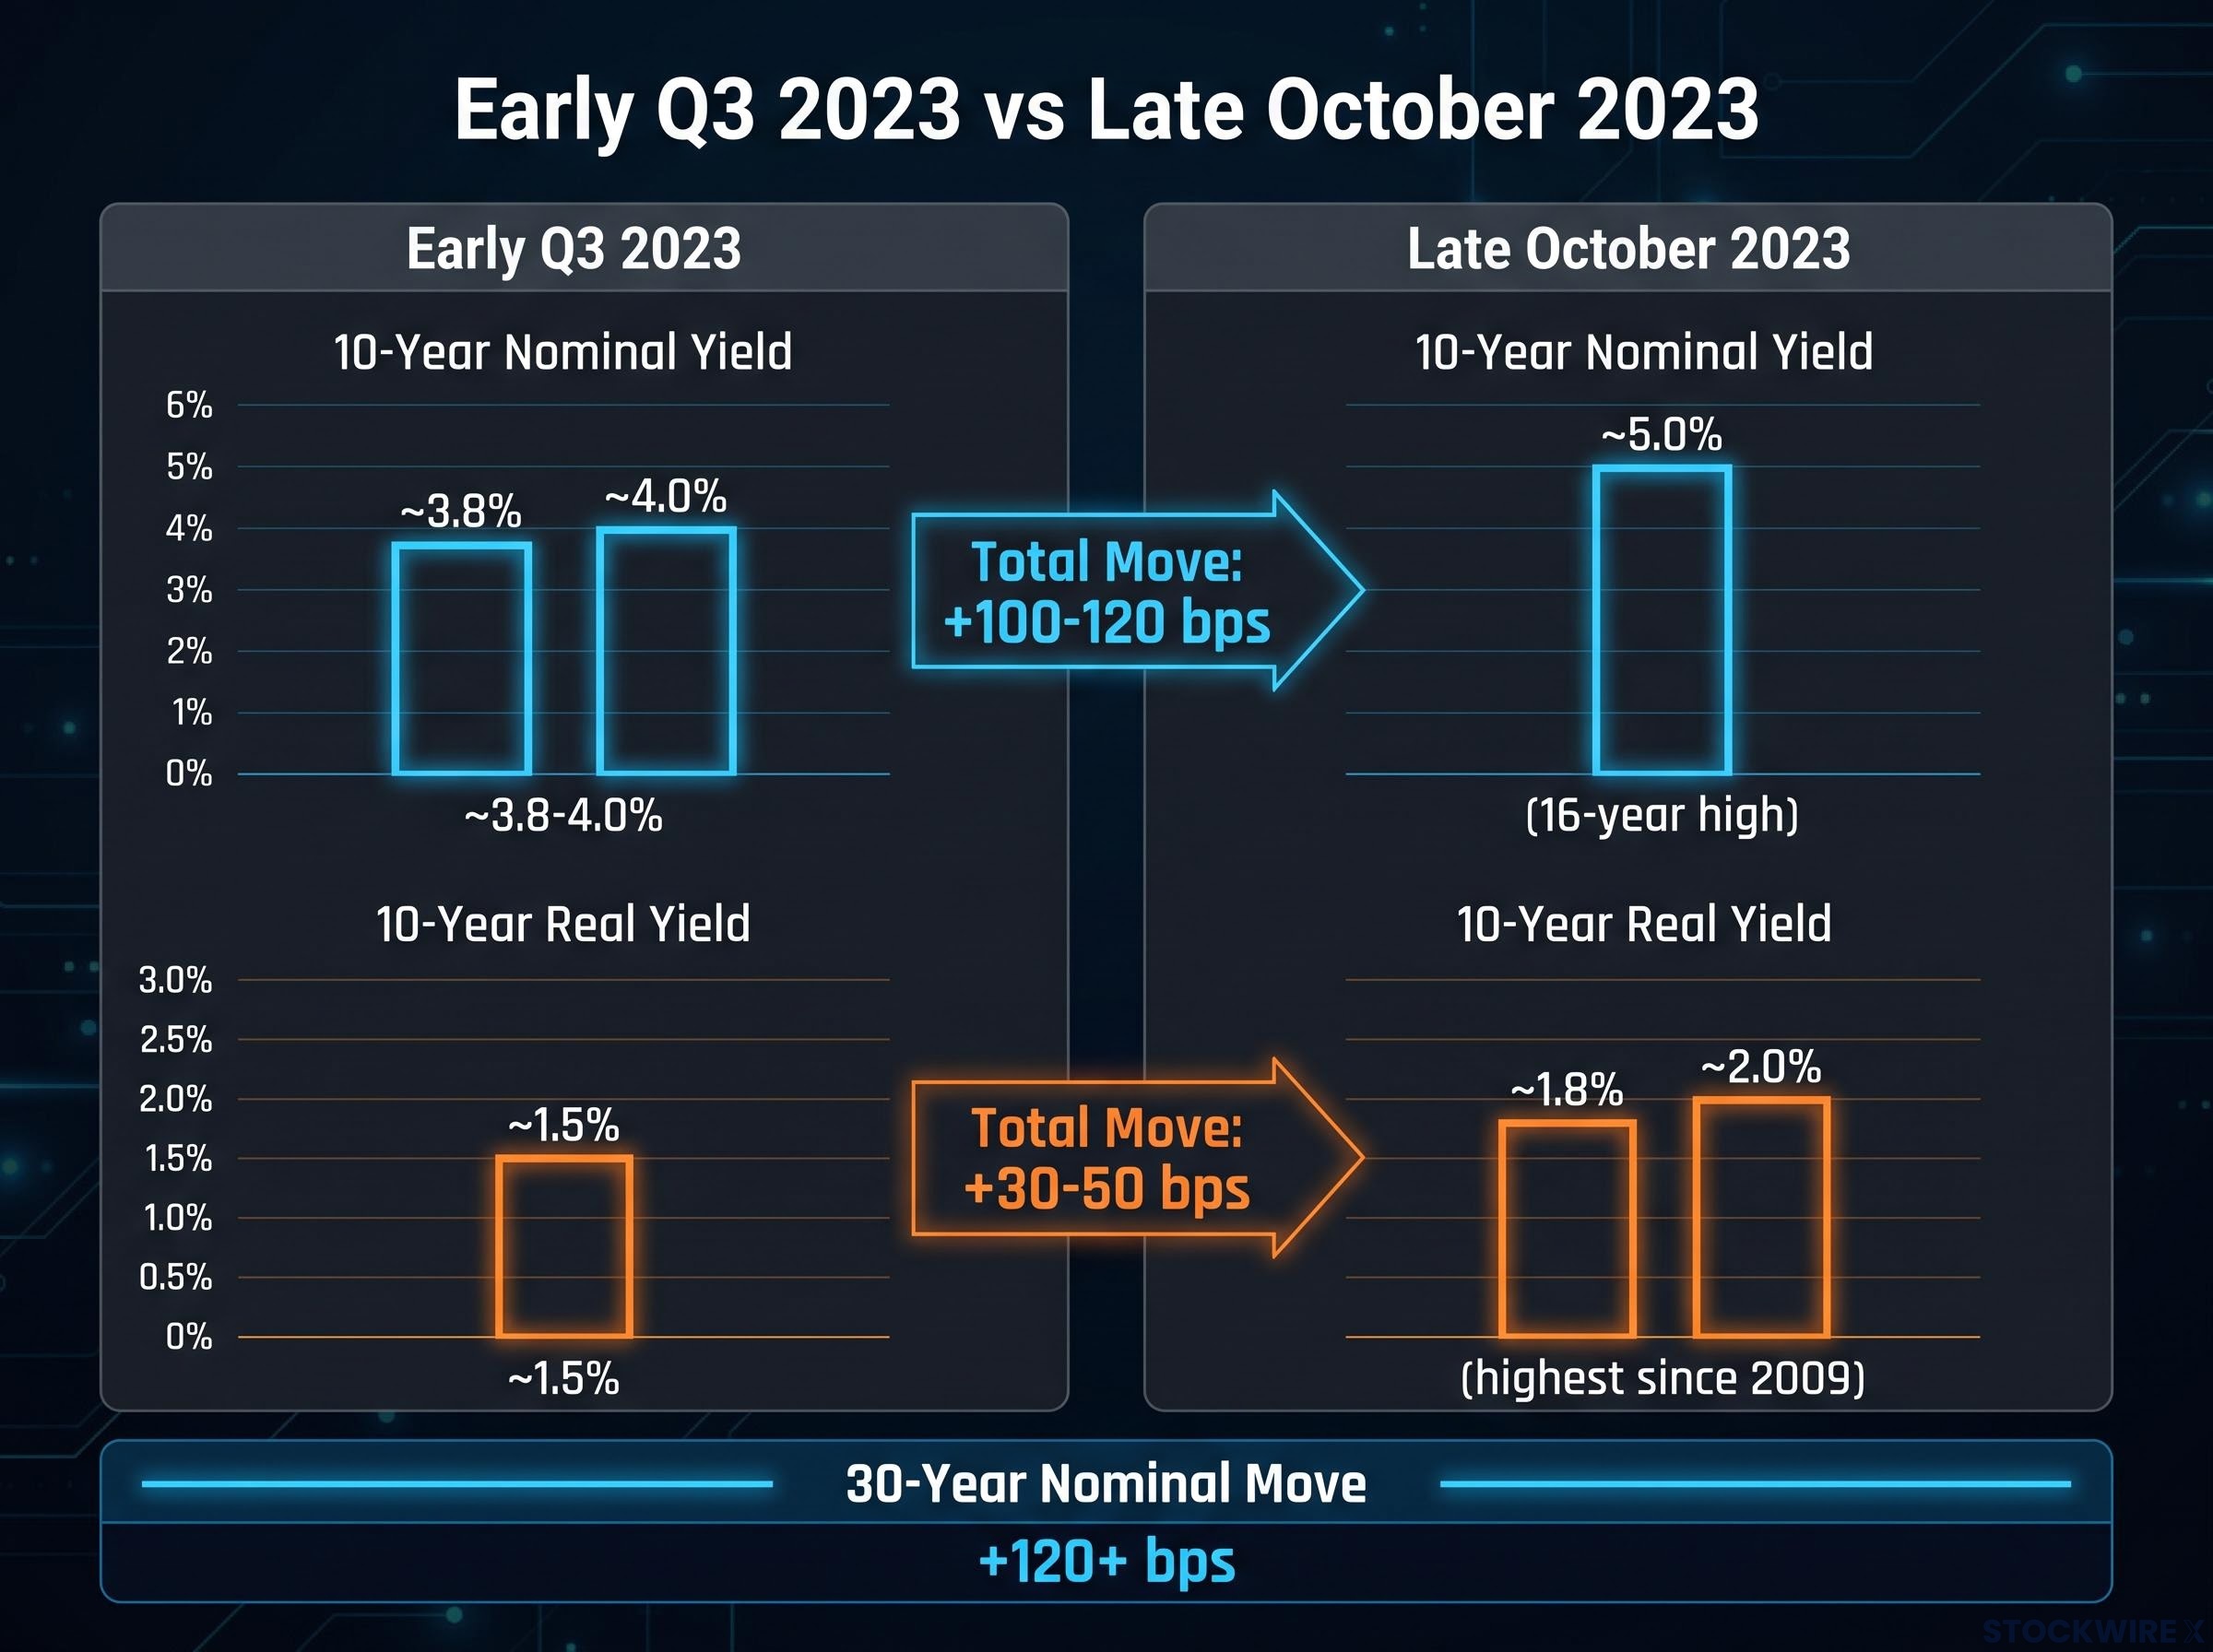
| Timepoint | 10-Year Nominal Yield | 30-Year Nominal Move | 10-Year Real Yield | Primary Driver |
|---|---|---|---|---|
| Early Q3 2023 (baseline) | ~3.8-4.0% | Baseline | ~1.5% | Stable policy expectations |
| Late October 2023 (peak) | ~5.0% | +120 bps from Q3 start | ~1.8-2.0% | Term premium expansion |
| Total move | +100-120 bps | +120+ bps | +30-50 bps | Real yields, not inflation expectations |
Federal Reserve staff analysis found that the move in longer-term yields was driven mainly by a rise in the term premium, the extra compensation investors demand for holding duration risk, rather than a dramatic change in near-term Fed rate expectations. Treasury officials separately emphasised that higher real yields accounted for most of the nominal move at longer maturities.
The Federal Reserve FEDS Note on the 2023 yield move concludes that the rise in long-term yields was primarily driven by an increase in term premiums rather than a shift in near-term policy rate expectations, a finding that directly supports reading today’s configuration as a discount-rate story rather than a growth-outlook revision.
The lesson for today is specific: what looked like a bond market event landed directly in equity portfolios even when earnings estimates were unchanged. The repricing was a discount-rate story, not a fundamentals story. The question to ask now is not whether the economy is weakening but whether rate velocity is approaching the territory where mechanical repricing becomes unavoidable. The same driver dynamic, term premium expansion layered on top of already-elevated real yields, is the configuration worth watching right now.
The real yield hurdle rate has shifted structurally under the Warsh Fed, with the 10-year TIPS benchmark reaching 2.22% in June 2026 and the FOMC median projecting the policy rate near 3.8% for the remainder of the year, reinforcing why investors still running sub-1% real rate assumptions in valuation models are producing systematically optimistic outputs.
Not all stocks are exposed equally: where the pain concentrates
The impact of rising real yields is structurally uneven because it is a function of how far into the future a company’s cash flows are expected to arrive. That creates a graduated spectrum from most exposed to least, and your portfolio’s position on it determines how much real-yield risk you are actually carrying.
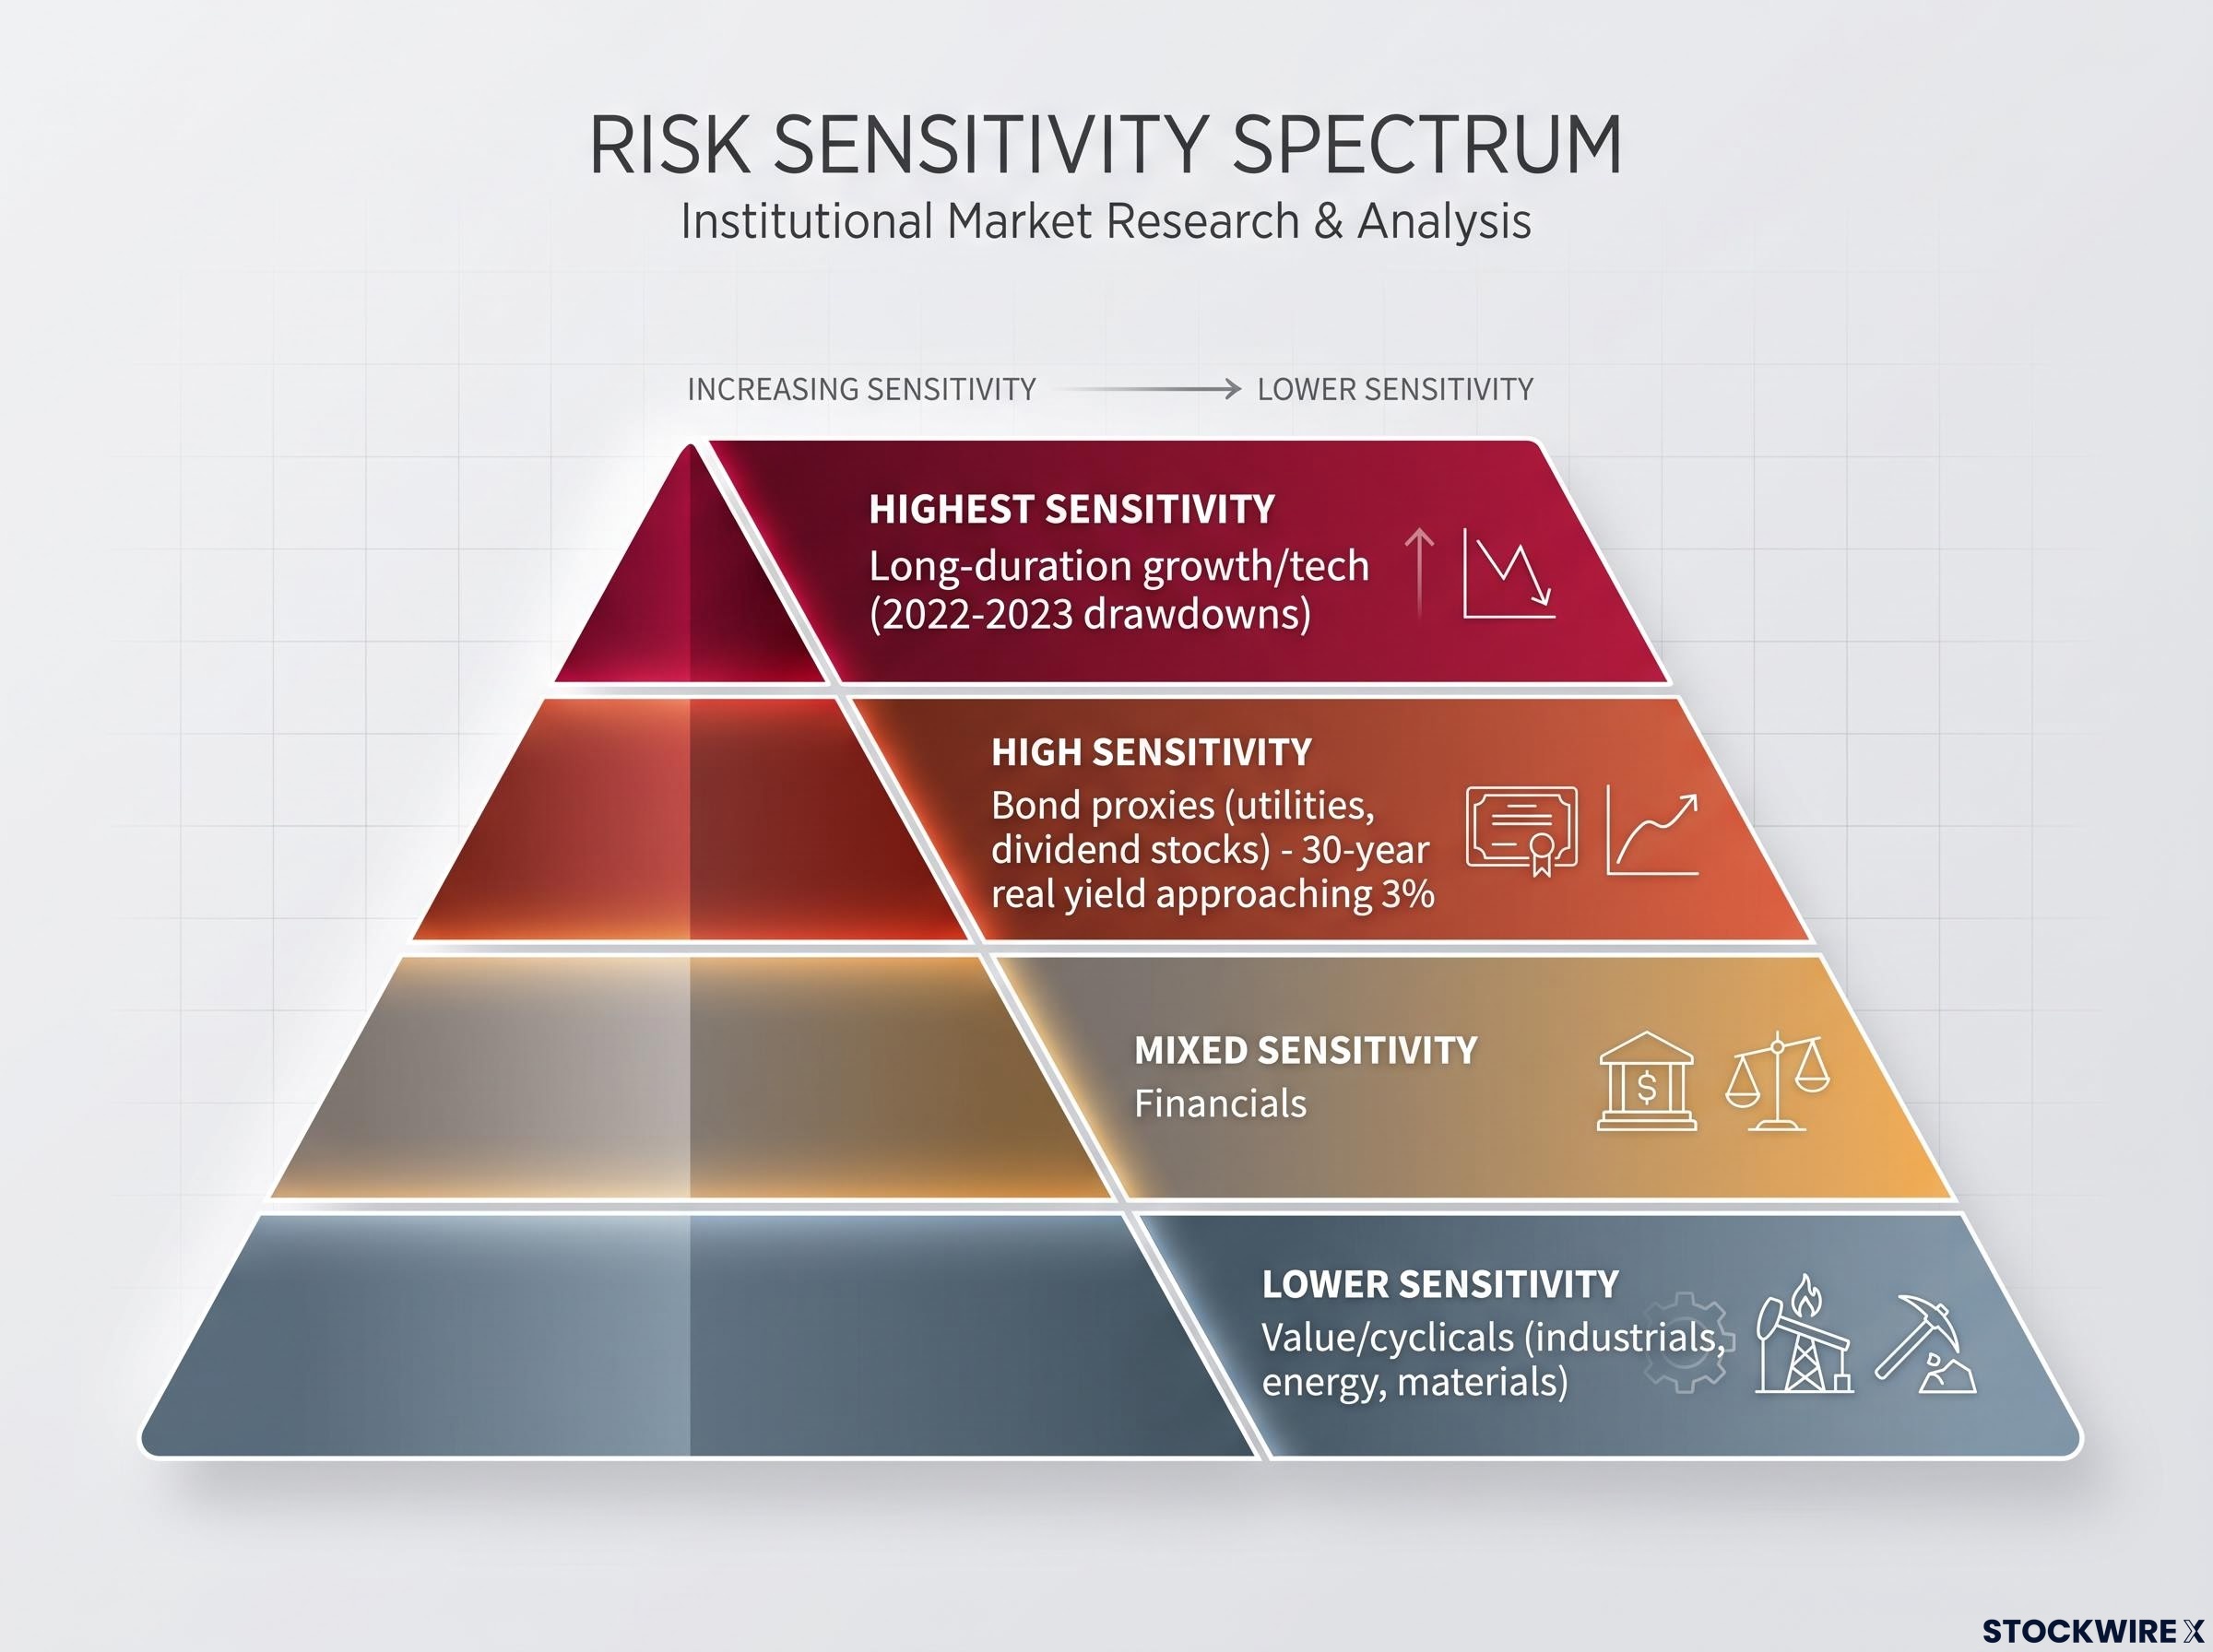
| Sector | Real Yield Sensitivity | Primary Mechanism | Current Environment Note |
|---|---|---|---|
| Long-duration growth/tech | Highest | Value concentrated in distant future earnings; discount rate has outsised impact | 2022-2023 saw substantial drawdowns before fundamentals weakened |
| Bond proxies (utilities, dividend stocks) | High | Yield advantage over Treasuries narrows as real rates rise | 30-year real yield approaching 3% makes risk-free alternative materially competitive |
| Financials | Mixed | Net interest margin benefit, offset by asset-value and credit-risk sensitivity | Benefit erodes if higher real rates tighten conditions enough to slow growth |
| Value/cyclicals (industrials, energy, materials) | Lower | Valuations anchored to near-term cash flows; less discount-rate sensitivity | Relative safe harbour if yield rise reflects growth strength, not fiscal concerns |
At the high end, long-duration growth and technology names carry the most real-yield sensitivity because a large share of their value is priced into earnings years or decades away. The 2022-2023 cycle demonstrated this in real time: substantial drawdowns arrived before fundamentals materially weakened, illustrating the pure discount-rate effect.
Bond-proxy equities, utilities, and dividend-oriented stocks, face a different but equally direct challenge. With the 30-year real yield approaching 3%, the risk-free alternative is now materially competitive with the yields these stocks offer, and without the equity risk.
Where financials and cyclicals sit in the picture
Financials occupy a genuinely mixed position. Higher yields widen net interest margins for banks, supporting earnings. But that benefit erodes if conditions tighten enough to increase credit losses, and the value of longer-duration securities sitting on bank balance sheets is directly sensitive to rate spikes.
Value and cyclical sectors, industrials, energy, and materials, are the relative safe harbour in a real-yield spike, but only conditionally. Their near-term cash-flow orientation makes them less sensitive to discount-rate changes, provided the yield rise reflects genuine growth strength rather than fiscal credibility concerns.
If your portfolio skews toward high-multiple technology or defensive yield plays, the current real yield environment creates a specific structural headwind that is entirely distinct from any view on whether those companies are executing well operationally.
Five signals to track as real yields move through the summer
The analytical framework above translates into five specific monitoring signals. For each, the question is not just what to watch but what a worrying reading looks like versus a benign one.
- Level and 30-day change in 10-year real yields. Track the TIPS-based real yield on the U.S. Treasury’s daily curve. A move of several dozen basis points over a rolling 30-day window warrants attention.
- Concern threshold: A monthly move approaching or exceeding the Goldman Sachs 50-basis-point two-standard-deviation benchmark.
- Shape of the real yield curve. A rise concentrated at the long end (20-year and 30-year maturities) has the biggest impact on long-duration assets and growth stocks. Front-end moves are more tied to near-term Fed policy expectations.
- Concern threshold: Steepening driven by long-end real yields rising faster than short-end rates.
- Driver of the move. Not all yield increases carry the same implications. Fed staff analysis of 2023 found the long-rate move was driven by term premium expansion, not policy rate revisions.
- Concern threshold: Moves driven by fiscal concerns or loss of confidence in inflation management are more malign than those driven by improved growth expectations.
- Equity risk premium. The ERP (earnings yield of major indices minus the real risk-free rate) measures the buffer equities offer above risk-free Treasuries.
- Concern threshold: Compression below historical averages signals reduced margin against shocks.
The equity risk premium stood at 4.24% as of 1 May 2026 on Damodaran’s implied measure for the S&P 500, placing valuations in a moderate return zone historically, but that buffer compresses directly as the real risk-free rate rises toward 3% on long-dated Treasuries.
- Federal Reserve communication and balance-sheet policy. The Fed’s stance on the neutral rate, quantitative tightening, and Treasury issuance directly affects both expected short rates and term premiums.
- Concern threshold: Any indication the Fed is less concerned about financial-conditions tightening, reducing the likelihood of a policy response that could cap yields.
For reference: Goldman Sachs calculates that the two-standard-deviation threshold for a single month currently sits at around 50 basis points on the 10-year yield, the point at which equity markets have historically come under pressure.
These signals work together. A 40-basis-point monthly move in real yields is less alarming if driven by improved growth expectations and accompanied by widening ERP. It is considerably more alarming if term-premium driven and ERP is already compressed. The collective reading tells you whether a rate move is the market efficiently repricing for growth or the beginning of a dislocation that will force equity repricing regardless of fundamentals.
What elevated real yields mean for how you position a portfolio today
The framework above moves from diagnosis to decision. Four portfolio-level responses deserve evaluation against your own situation, framed as stress-testing and positioning considerations rather than predictions about where yields go next.
- Reassess duration exposure in equity holdings. In an equity context, “duration” means exposure to far-future cash flows. Early-stage growth, speculative technology, and high-beta unprofitable names are the equity equivalents of long-dated bonds. Identify them specifically in your portfolio rather than assuming sector labels tell the full story.
- Stress-test valuations with higher real discount rates. Model scenarios with real discount rates 50-100 basis points higher than current levels. Pay particular attention to positions whose valuation multiples implicitly assume a return to the near-zero real rate regime of the 2010s.
- Compare equity earnings yields against current real bond yields. With the 30-year real yield approaching 3%, this comparison is especially material for income-oriented and bond-proxy equity allocations.
With the 30-year real yield having climbed to nearly 3%, Treasuries now offer an after-inflation return that is directly competitive with equity earnings yields on a risk-free basis, a situation that has not persisted for most of the past decade.
- Align leverage and liquidity management with the possibility of a rate shock. Treat the Goldman Sachs 50-basis-point monthly threshold as the benchmark for scenario planning. If your portfolio includes leveraged positions or illiquid holdings, assess whether you could absorb the forced selling that a fast yield move has historically triggered.
The practical implication of approaching-3% real yields is not necessarily to sell equities. It is to know exactly which positions in your portfolio would be mechanically repriced if a fast rate move arrives, before that move happens.
This article is for informational purposes only and should not be considered financial advice. Investors should conduct their own research and consult with financial professionals before making investment decisions. Past performance does not guarantee future results. Financial projections are subject to market conditions and various risk factors.
The rate environment has shifted structurally; the adjustment window is still open
Real yields at 2023-high levels are not inherently catastrophic for equities. But the combination of elevated levels and proximity to the Goldman Sachs velocity threshold means the margin for error in portfolio positioning is narrower than it has been in the recent low-rate era.
The distinction to carry forward is level versus speed. Gradual moves can be absorbed; fast ones force disorderly repricing that has little connection to whether the companies in your portfolio are performing well.
Three variables will determine whether the current environment stabilises or escalates: the driver of further yield moves (growth optimism versus term premium expansion), Fed communication on quantitative tightening and the neutral rate, and whether the 50-basis-point monthly threshold is approached or breached. Those are the conditions to watch, not as predictions, but as a defined framework for knowing when the rate signal shifts from background noise to something that demands a portfolio response.
Macro risks converging on stretched valuations create a compounding dynamic: S&P 500 earnings growth projected to decelerate from 29.3% in Q1 2026 to 22.9% in Q2 2026 reduces the fundamental cushion precisely when elevated real yields are already compressing the discount-rate buffer.