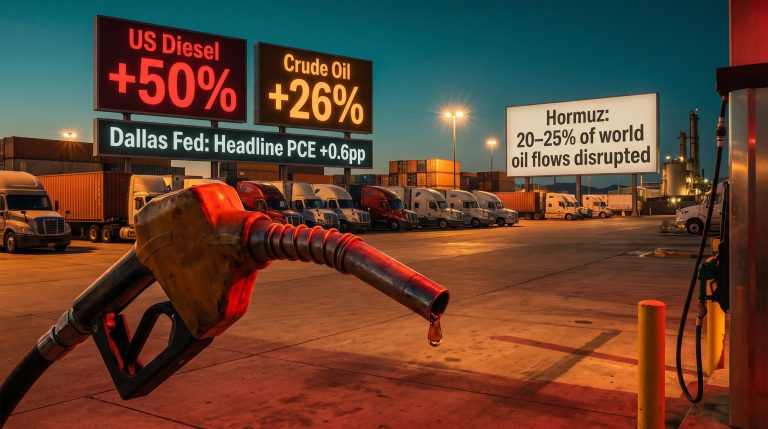
Most market commentary frames the Strait of Hormuz conflict as a risk to the equity bull case. The data suggest the opposite is true. The disruption has become a load-bearing pillar of that bull case, and its resolution is what investors have not priced.
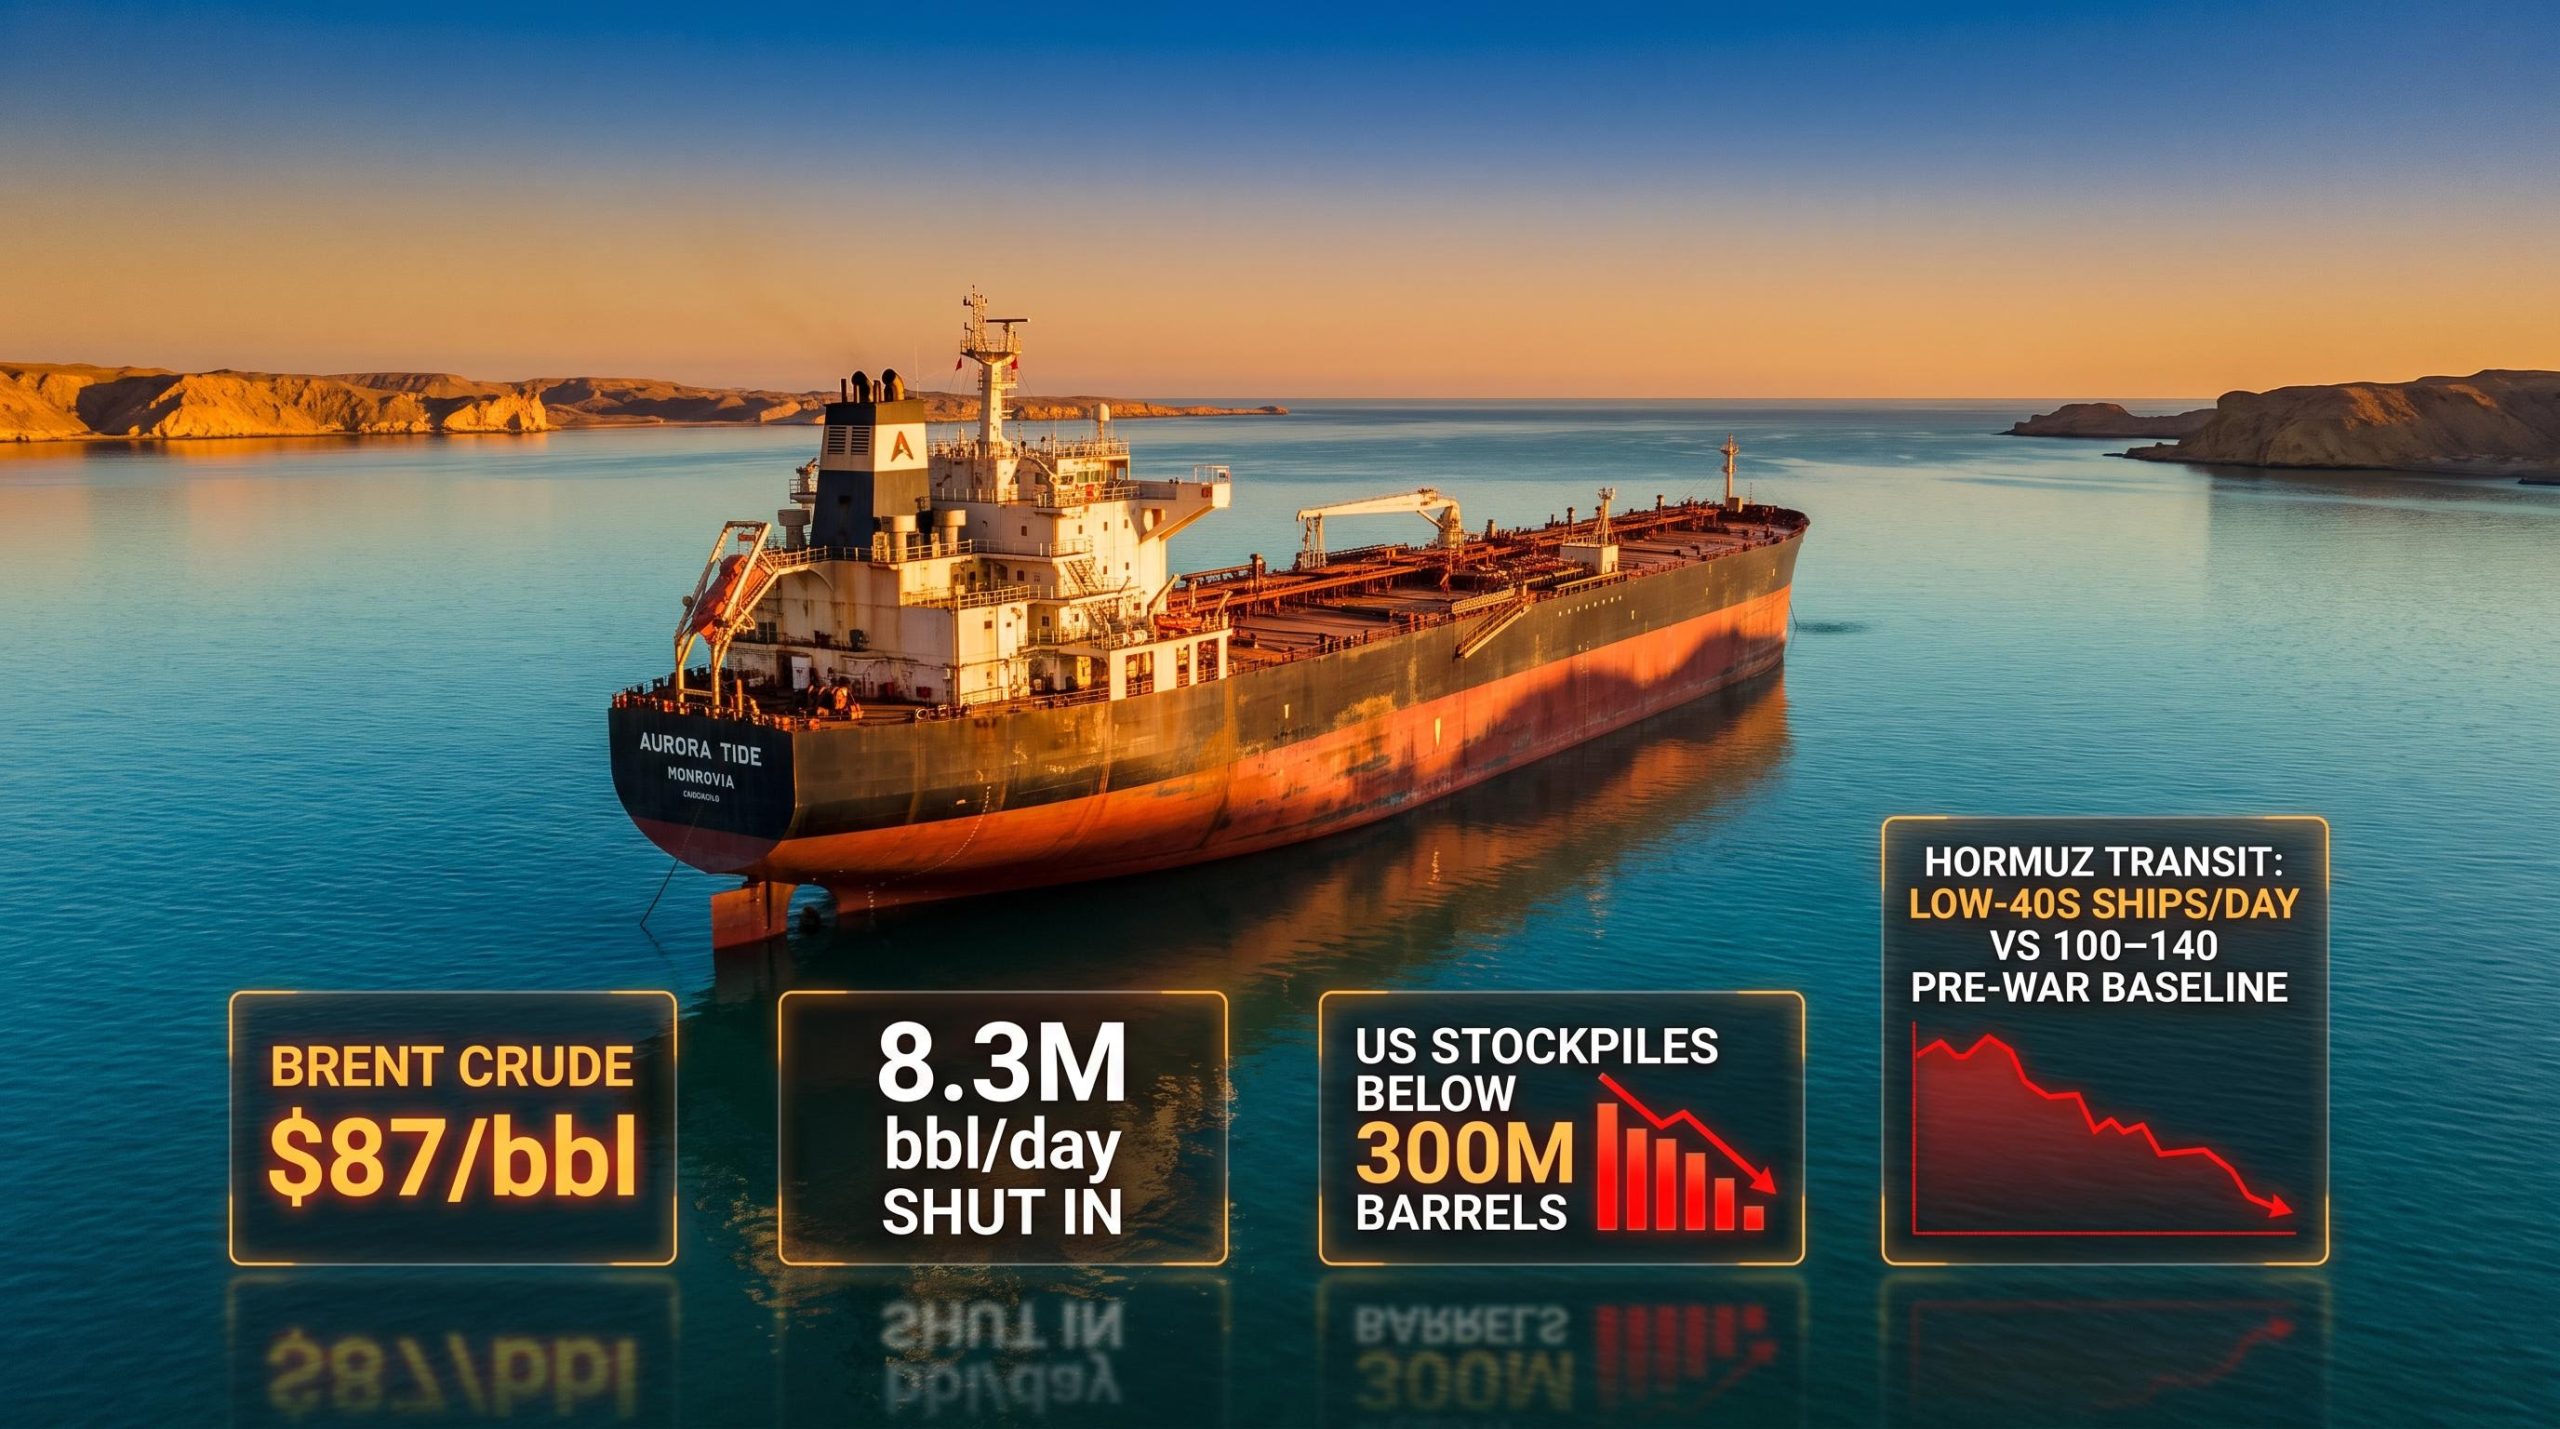
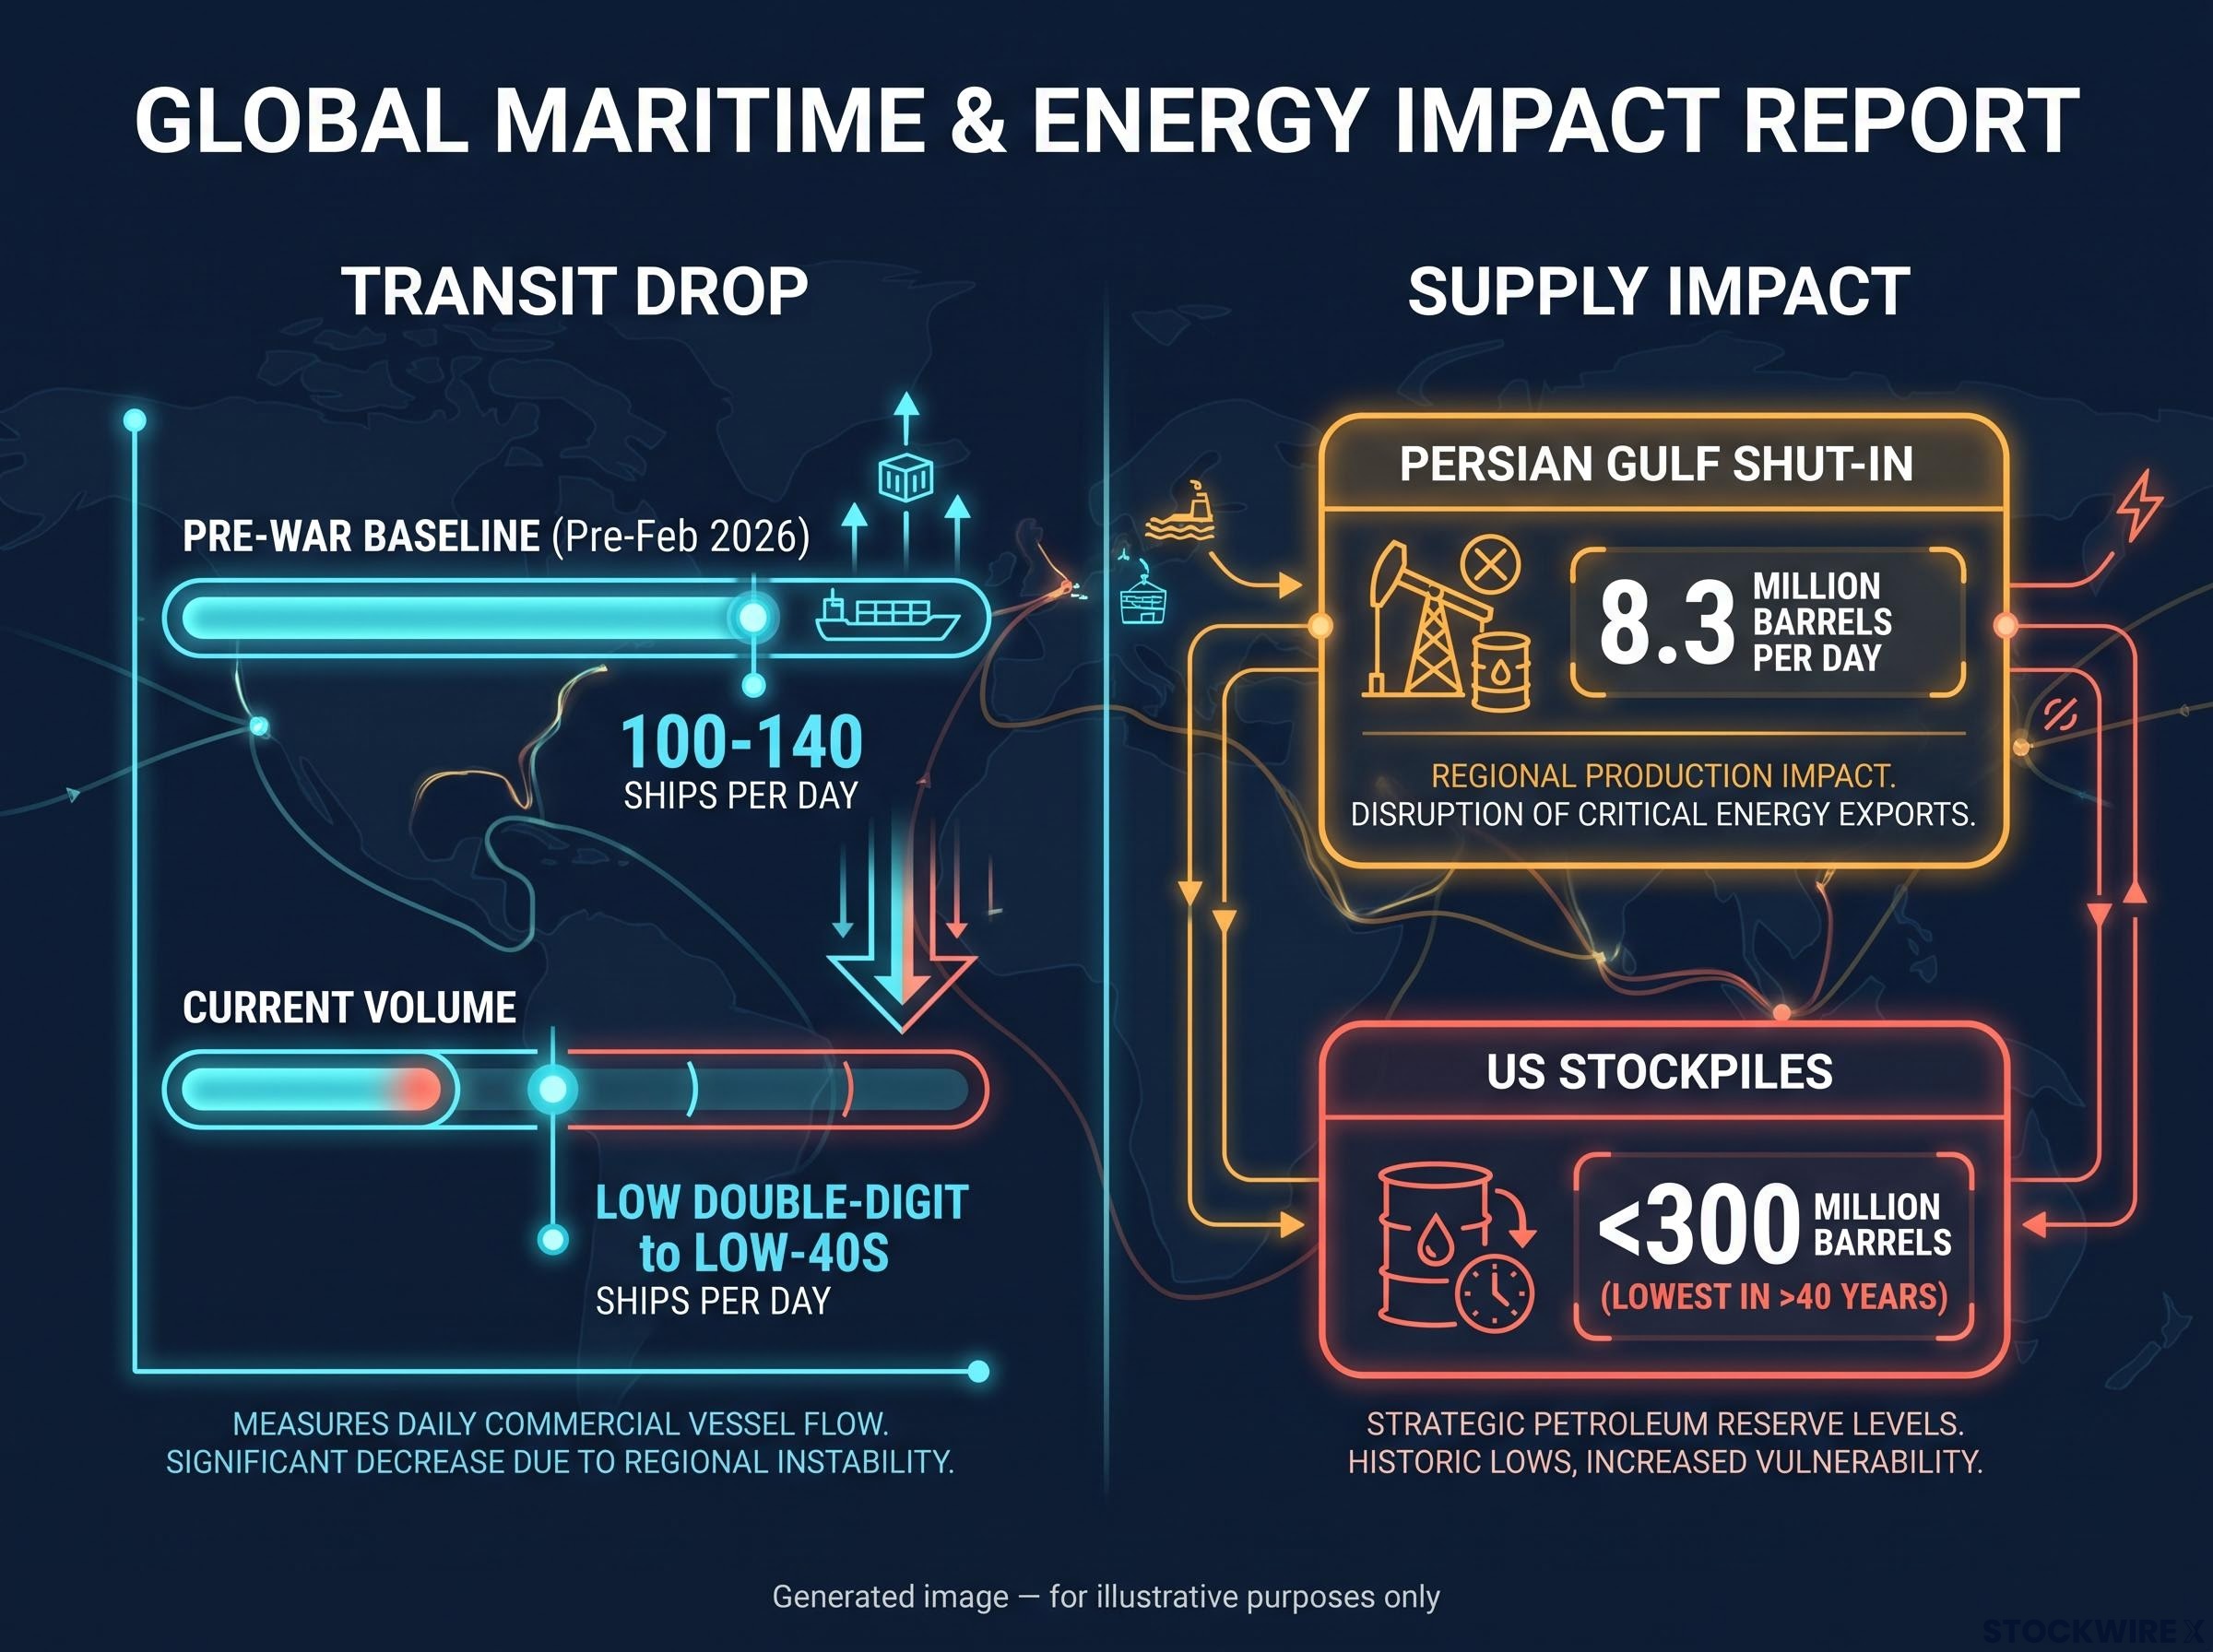
The stakes are specific. Brent crude has settled around $87 per barrel, while approximately 8.3 million barrels per day of Gulf production is currently shut in, US stockpile levels have slipped beneath 300 million barrels for the first time in more than forty years, and Iran-Oman diplomatic talks on a temporary shipping route are in their final stages. These are not background conditions. They are architecture. Year-end index targets rest on them.
Here is how to tell which parts of a bullish equity forecast depend structurally on continued disruption, and which do not. That distinction is where the edge sits for anyone holding equities through the second half of 2026.
How the Hormuz closure became a market baseline, not a market risk
The conventional framing treats the Strait of Hormuz closure as a geopolitical risk factor, something to monitor, hedge against, or worry about on the margins of an otherwise constructive equity view.
The data tell a different story:
- Conventional framing: The Hormuz closure is a tail risk that could escalate and disrupt markets further.
- What the data show: The closure has already been absorbed into sell-side models as the operating environment, making it the baseline assumption, not the risk.
From geopolitical flare-up to structural baseline
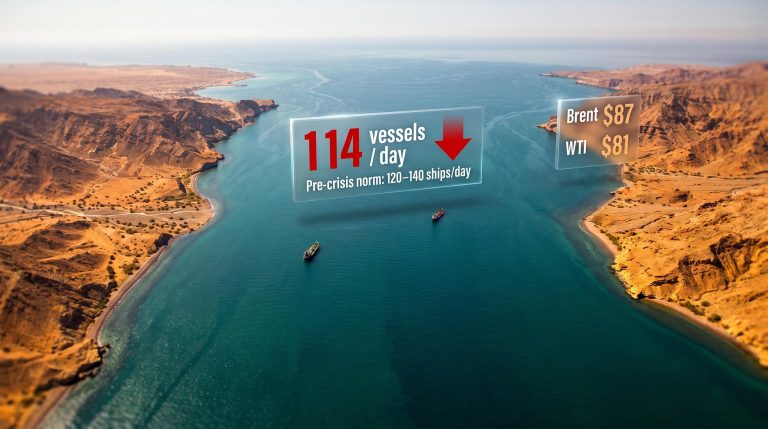
The escalation began in February 2026. Six months later, vessel transit volumes through the Strait have fallen to low double-digit to low-40s ships per day, according to Kpler data, against a pre-war baseline of approximately 100-140 ships per day. Compared with a year ago, worldwide crude supply has contracted by around 6.3 million barrels per day.
Kpler transit volume data puts the practical scale of the shutdown in sharper relief: during the first week of August, as few as four vessels transited the Strait on a single day, against a pre-war daily norm of 130 to 140 ships, a reduction that makes the aggregate six-month supply contraction figure concrete rather than abstract.
When a disruption endures for this long, forward curves, earnings models, and index targets recalibrate around it. That migration from risk to baseline is standard market behaviour, but it creates a specific and under-labelled fragility. What has been absorbed as normal is now the condition most vulnerable to reversal.
The supply disruption mechanics driving the current inventory drawdown are not self-correcting through demand destruction alone: OPEC spare capacity of roughly 0.5 million barrels per day is structurally incapable of offsetting a Hormuz-scale supply gap running into the tens of millions of barrels per day.
The International Energy Agency issued a warning in mid-August 2026 on the urgency of reopening the waterway, citing accelerating global stockpile drawdowns.
The distinction matters for how you read any bullish forecast. The conflict is not a risk to watch for. It is already baked in, and its absence is the scenario that would force recalibration.
When big ASX news breaks, our subscribers know first
The earnings transmission mechanism that links oil to index targets
The connection between barrels offline in the Persian Gulf and year-end equity targets is not vague. It is mechanical, and each link in the chain is traceable.
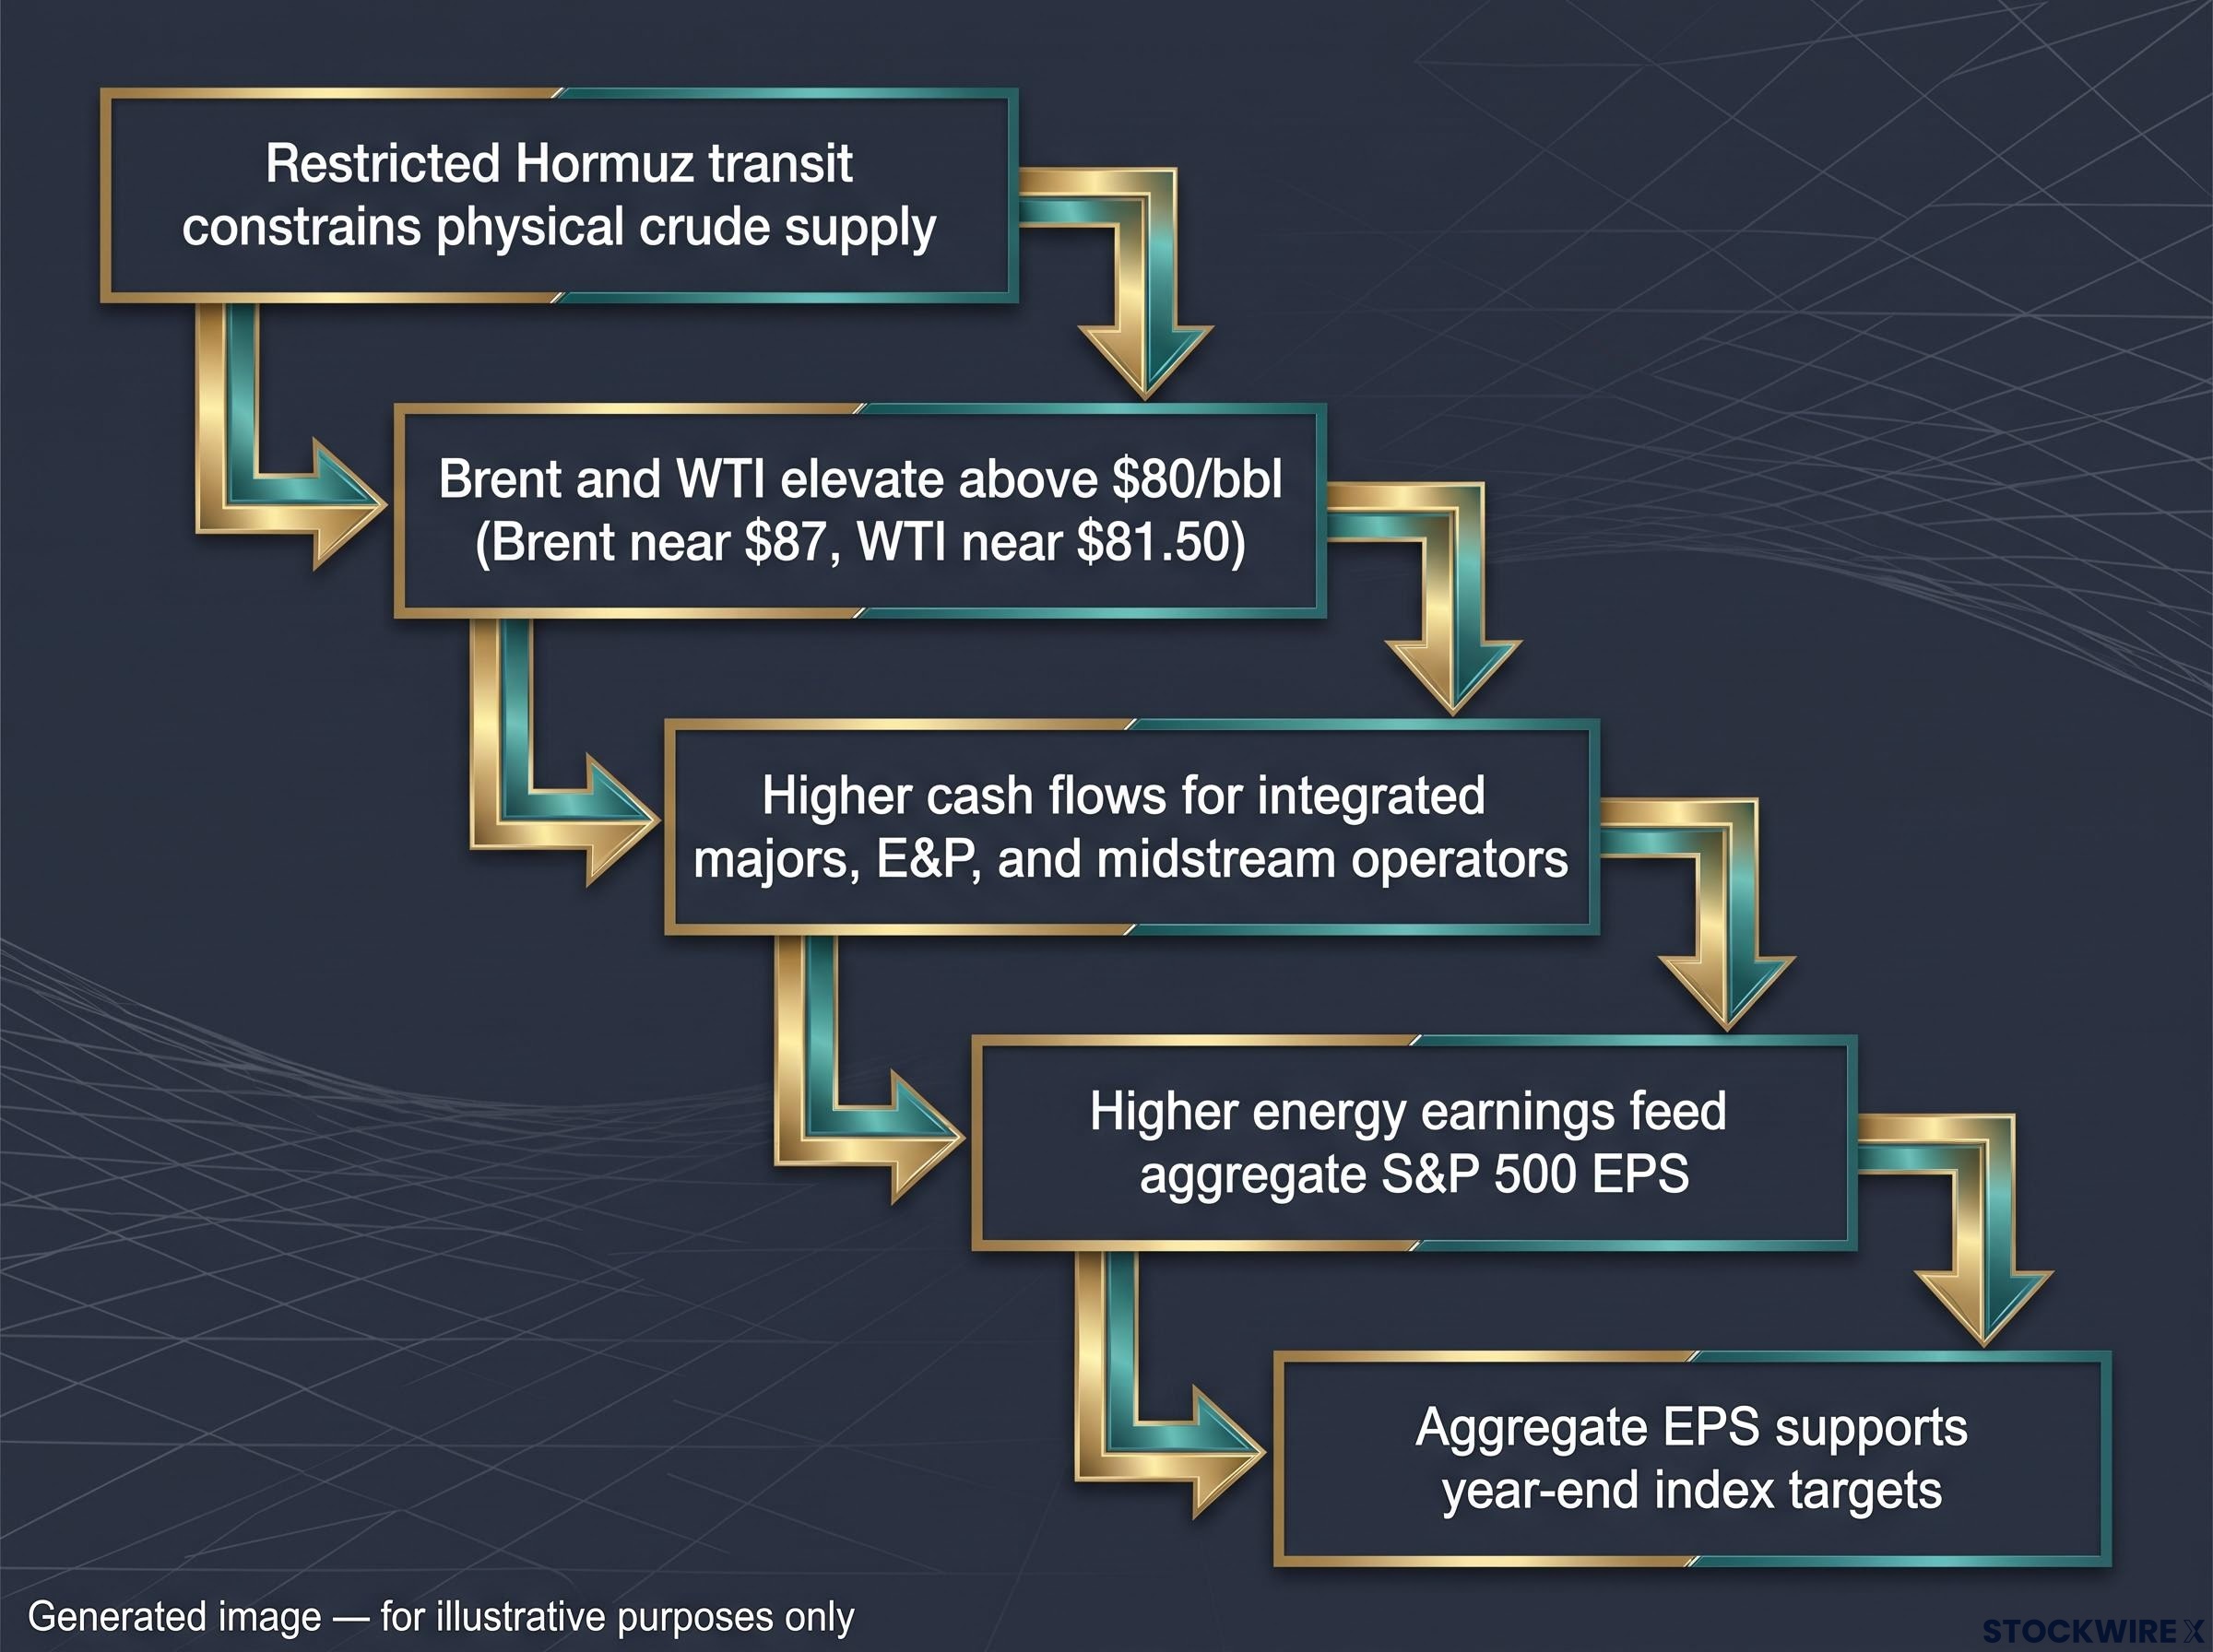
- Restricted Hormuz transit constrains physical crude supply
- Constrained supply elevates Brent and WTI prices above $80 per barrel
- Elevated prices drive higher cash flows for integrated majors, exploration and production firms, and midstream operators
- Higher energy sector earnings feed directly into aggregate S&P 500 earnings per share (EPS, the total profit generated per share of the index)
- Aggregate EPS supports the year-end index targets that strategists have published
Three conditions underpin the forecasts that strategists have put forward for year-end. All three are currently satisfied, and each one carries its own vulnerability if the environment shifts:
| Condition | Current status | What breaks if it reverses |
|---|---|---|
| Crude oil above $80/bbl | Brent near $87; WTI near $81.50 | Energy sector EPS falls; index-level earnings math weakens |
| Earnings growth near current levels | Supported by disruption-driven energy cash flows | Aggregate EPS declines even if non-energy sectors hold |
| Fed policy unchanged | Currently stable | Multiple compression if rate path shifts |
The $80 per barrel level is the key figure to watch. Sell-side models have absorbed the conflict as the operating backdrop, anchoring their earnings arithmetic to that price floor. Once crude falls beneath it, the numbers supporting year-end targets begin to break down. That floor exists because supply has been restricted, not because end-user demand is robust, and the gap between those two sources of support has significant consequences for how long the floor can hold.
Why oil priced on disruption is structurally different from oil priced on demand
High oil prices support energy earnings. That much is obvious. What is less obvious, and less often interrogated, is the source of those prices. Disruption-supported oil and demand-supported oil produce the same headline number but carry categorically different earnings implications.
| Attribute | Disruption-supported price | Demand-supported price |
|---|---|---|
| Price level | Brent near $87 | Could be similar or lower |
| Durability | Contingent on continued supply restriction | Sustained by consumption growth and balanced supply |
| Reversal trigger | A credible diplomatic reopening path, before physical supply changes | Demand destruction or recession |
| Earnings implications | Fragile; risk premia unwind on headlines alone | More durable; reflects organic economic activity |
US crude inventories, now sitting at their lowest point in over four decades at beneath 300 million barrels, are frequently cited as confirmation of a tight market. However, the mechanism behind that tightness is critical. Stocks have been drawn down because supply has been forcibly withheld, not because consumption has outpaced available production. Once the supply restriction lifts, that drawdown begins to reverse.
The inventory drawdown pace underlying the current sub-300 million barrel US stockpile figure reflects a Q2 2026 global draw running at 8.5 million barrels per day, more than double any previously recorded rate, which is the reason that stockpile tightness functions as a supply-restriction signal rather than a demand-strength signal.
The market distinction that matters is not whether oil is cheaper, but why it is cheaper. A price decline triggered by restored peace-time supply represents a fundamental shift in market regime, whereas one driven by gradual inventory normalisation is simply the cycle running its course.
That embedded fragility is the price of a disruption-supported oil market. The moment a credible reopening path appears, risk premia unwind before a single additional barrel flows. For anyone holding energy-heavy positions, the durability you assign to current earnings levels depends entirely on understanding this distinction.
What a peace deal would actually do to equity markets
A ceasefire is not a single event with a single market effect. A credible route-plus-ceasefire package would simultaneously trigger adjustments across five channels:
- Physical supply: Crude and LNG volumes begin to normalise
- Risk premia: The disruption premium embedded in oil prices starts unwinding on the announcement, well before physical flows change
- Insurance costs: Maritime insurance premiums, currently elevated for Gulf transit, begin compressing
- Derivatives positioning: Speculative long positions in crude built around continued disruption face forced unwinding
- US strategic stockpile policy: The heavy drawdown phase flips toward restocking in a lower-price environment, changing flow dynamics
The diplomatic state is live. Iran and Oman are in the final stages of technical route coordination. US-Qatar mediation remains active. Iran’s Supreme National Security Council has publicly stated the strait will not open until the US “corrects its behavior,” and IRGC demands remain on the table. These channels are not background geopolitics for you to monitor passively. They are leading indicators of supply normalisation risk, functioning as macro data points with the same market-moving potential as a central bank meeting.
Negative and positive normalisation effects at the sector level
What gets hurt:
- Energy sector earnings decline as the disruption premium exits oil prices
- Energy-linked credit faces short-term dislocation risk
- Equities carrying a risk-premium valuation in energy lose that support
What benefits:
- Consumer-facing sectors and manufacturing see lower input costs
- Real incomes strengthen as fuel and energy costs ease
- Global risk sentiment improves on reduced geopolitical tension
The defensible claim is precise: peace is more destabilising than continued conflict specifically for energy-linked earnings and for bull narratives that lean heavily on those earnings. The broader index-level effect would be a tug-of-war between these opposing forces, mediated by sector weights and rotation speed.
How to read a bullish equity forecast that does not label peace as a risk
Mainstream equity outlooks for 2026 identify escalation and recession as the principal downside scenarios. Virtually none of them treat a peace-driven return of supply as a threat to earnings narratives that depend on elevated oil. That gap is not an accident of analysis. It reflects a systematic tendency for forecasts to treat the current environment as the durable baseline rather than as one contingent outcome among several. Spotting that gap is the first practical step in evaluating any forecast you encounter.
Four lenses for evaluating any forecast in the current environment:
- Separate price level from price driver. A barrel of Brent at $87 supported by a closed chokepoint carries entirely different downside exposure than a barrel at $87 supported by genuine consumption growth. The headline price may be identical, but the conditions required to sustain it are not.
- Quantify the conflict-premium content of energy EPS. Ask explicitly what share of index-level earnings per share comes from disruption-supported energy profits, and at what oil price those earnings cease to be viable.
- Track diplomacy as a macro variable. The Iran-Oman route coordination, US-Qatar mediation, and IRGC and Supreme National Security Council negotiations are leading indicators of supply normalisation risk, not headline noise to filter out.
- Use asymmetric hedges rather than binary macro bets. Energy-sector put options and crude volatility instruments allow you to stay broadly constructive on equities while insuring against a specific peace-deal scenario.
The question that cuts through any year-end target built on the current environment is straightforward: how far does oil need to fall before the energy earnings underpinning these forecasts become unsustainable? Working out that number, and then tracking the conditions that could take prices there, is more useful than debating whether the bull case holds in the abstract.
These lenses let you remain invested while being correctly calibrated to the specific fragility the disruption creates, rather than making an all-or-nothing call on a geopolitical outcome you cannot predict.
For investors wanting to implement the asymmetric hedging approach outlined above, our dedicated guide to tail risk hedging structures covers collar mechanics, long-dated put sizing, and cost-efficient implementation for portfolios that need peace-deal protection without abandoning broad equity exposure.
What the conflict’s resolution would change, and what it would not
A peace deal would change specific things. It would remove the disruption premium from oil, lower energy sector earnings, and challenge any bull forecast that explicitly leaned on crude above $80 as a condition. Strategists anchoring their year-end targets to a combination of firm energy prices, broadly healthy earnings growth, and a stable Federal Reserve policy stance would find the first two of those supports directly impaired by a reopening. The policy stance would remain intact regardless.
What peace would not change:
- The Fed’s policy path, which responds to inflation and employment data, not Hormuz transit volumes
- Technology sector earnings trajectories, which have their own demand and adoption drivers
- Domestic consumption trends, which are shaped by labour markets and household balance sheets
The pace of diplomacy matters here. A partial Oman-brokered route deal and a full restoration of pre-war navigation produce meaningfully different market effects, and that distinction is explicit in current talks. Partial reopening compresses the premium gradually. Full reopening triggers the multi-channel shock described above.
Hormuz verification signals, including a formal signed agreement, independent monitoring, mine-clearance completion, and insurance underwriting resumption, each operate on a different timeline from any diplomatic announcement, meaning paper market pricing can run well ahead of physical barrel flows.
- What peace changes: Oil premium, energy earnings durability, any forecast assumption conditioned on disruption continuing
- What peace does not change: Fed path, technology earnings, consumption-driven growth pillars
For anyone holding a diversified equity portfolio, the actionable insight is not to sell equities if peace talks advance. It is to understand which slice of your return assumption is disruption-dependent and size that exposure accordingly. The conflict has made part of the bull case fragile. The rest of it stands on its own foundations.
This article is for informational purposes only and should not be considered financial advice. Investors should conduct their own research and consult with financial professionals before making investment decisions. These statements are speculative and subject to change based on market developments and company performance.