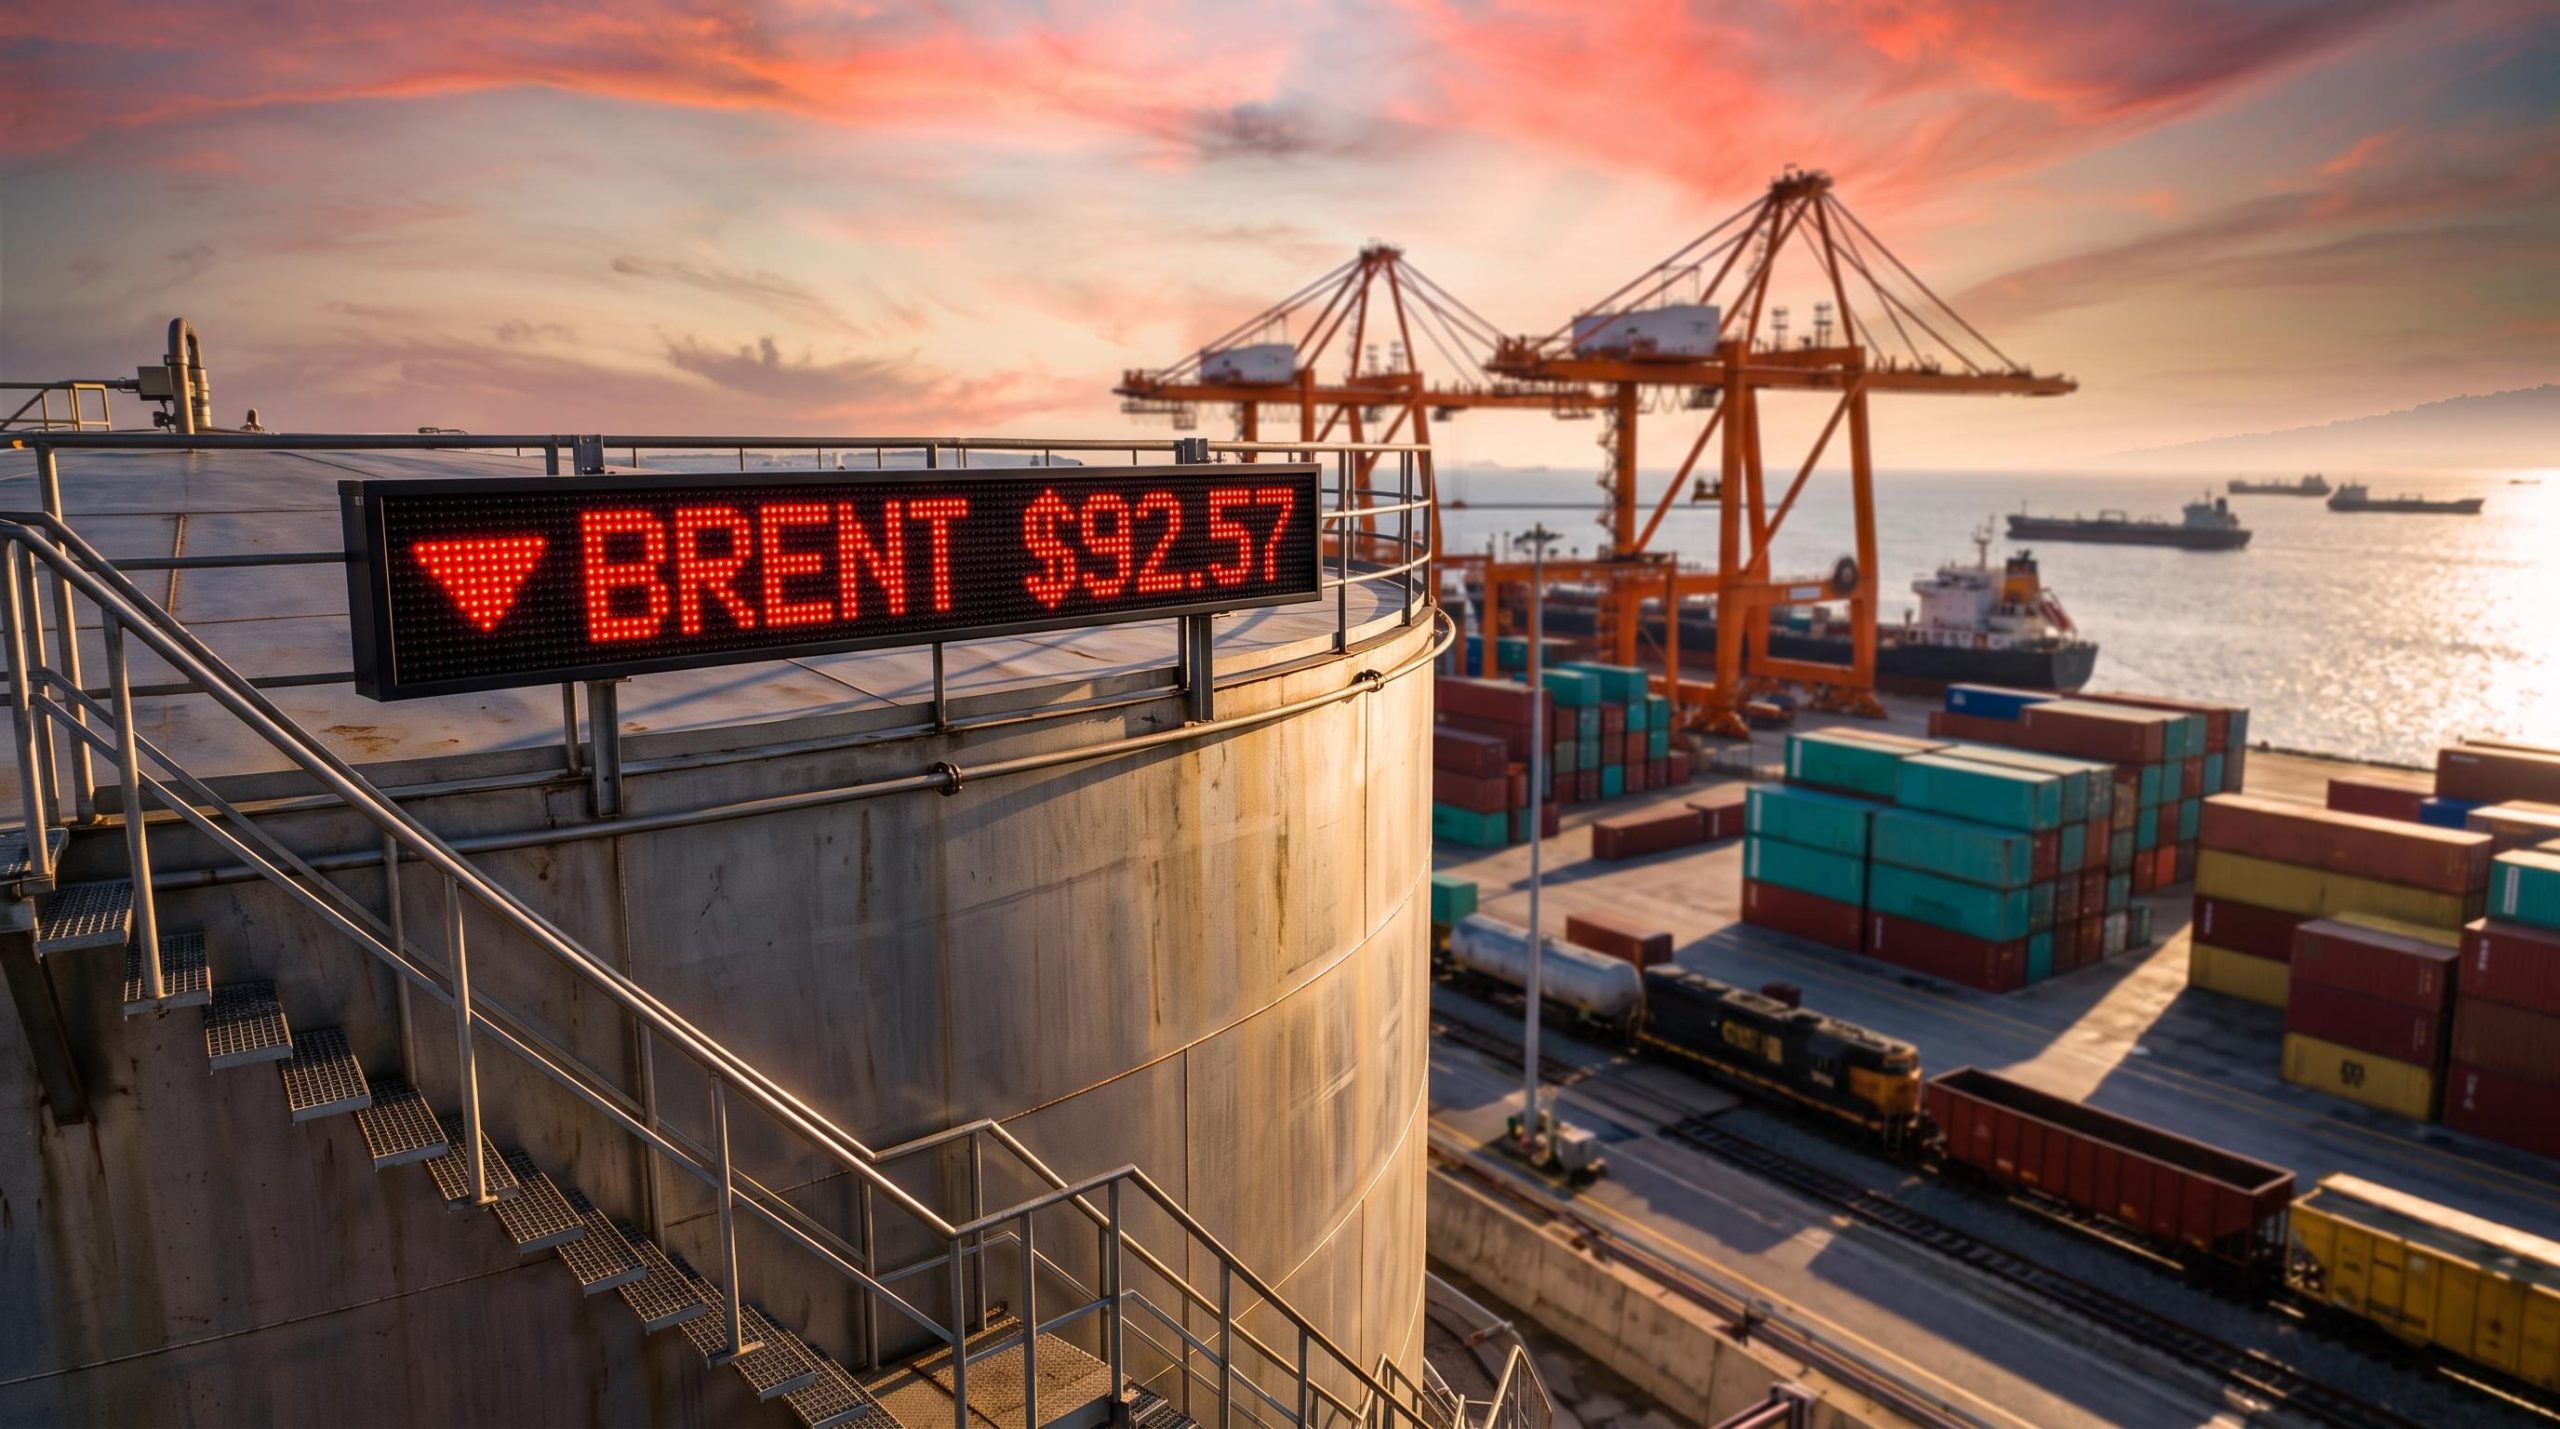
Oil fell almost 6% on Monday 9 November 2026 and the S&P 500 jumped 2.35%, yet technology did not lead the rally. Industrials did, as Brent crude settled at $92.57, down 5.85%, and money moved toward sectors that spend heavily on energy.
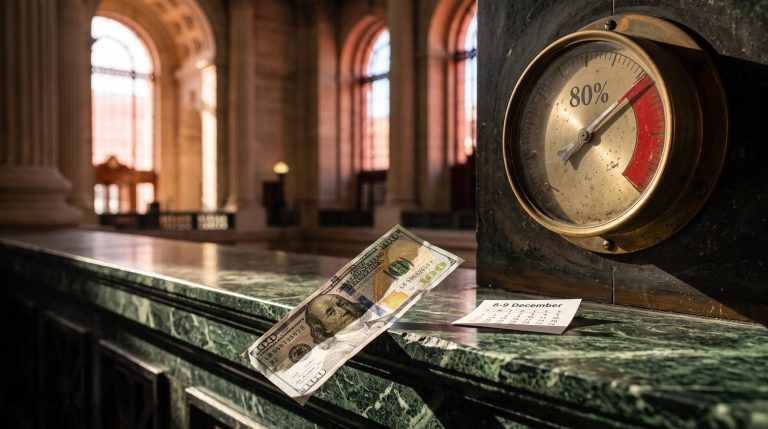
The bond market did not join in. The US 10-year Treasury yield rose to 4.88% even as oil slid, and US consumer price data (CPI) is due on Tuesday 10 November at 8:30 a.m. Eastern. Cheaper oil and a rising bond yield on the same day are what make this rally worth a closer look.
Here is how oil prices, rate expectations and hard-asset sectors fed into one another on Monday, and the signals that will show you whether the shift holds.
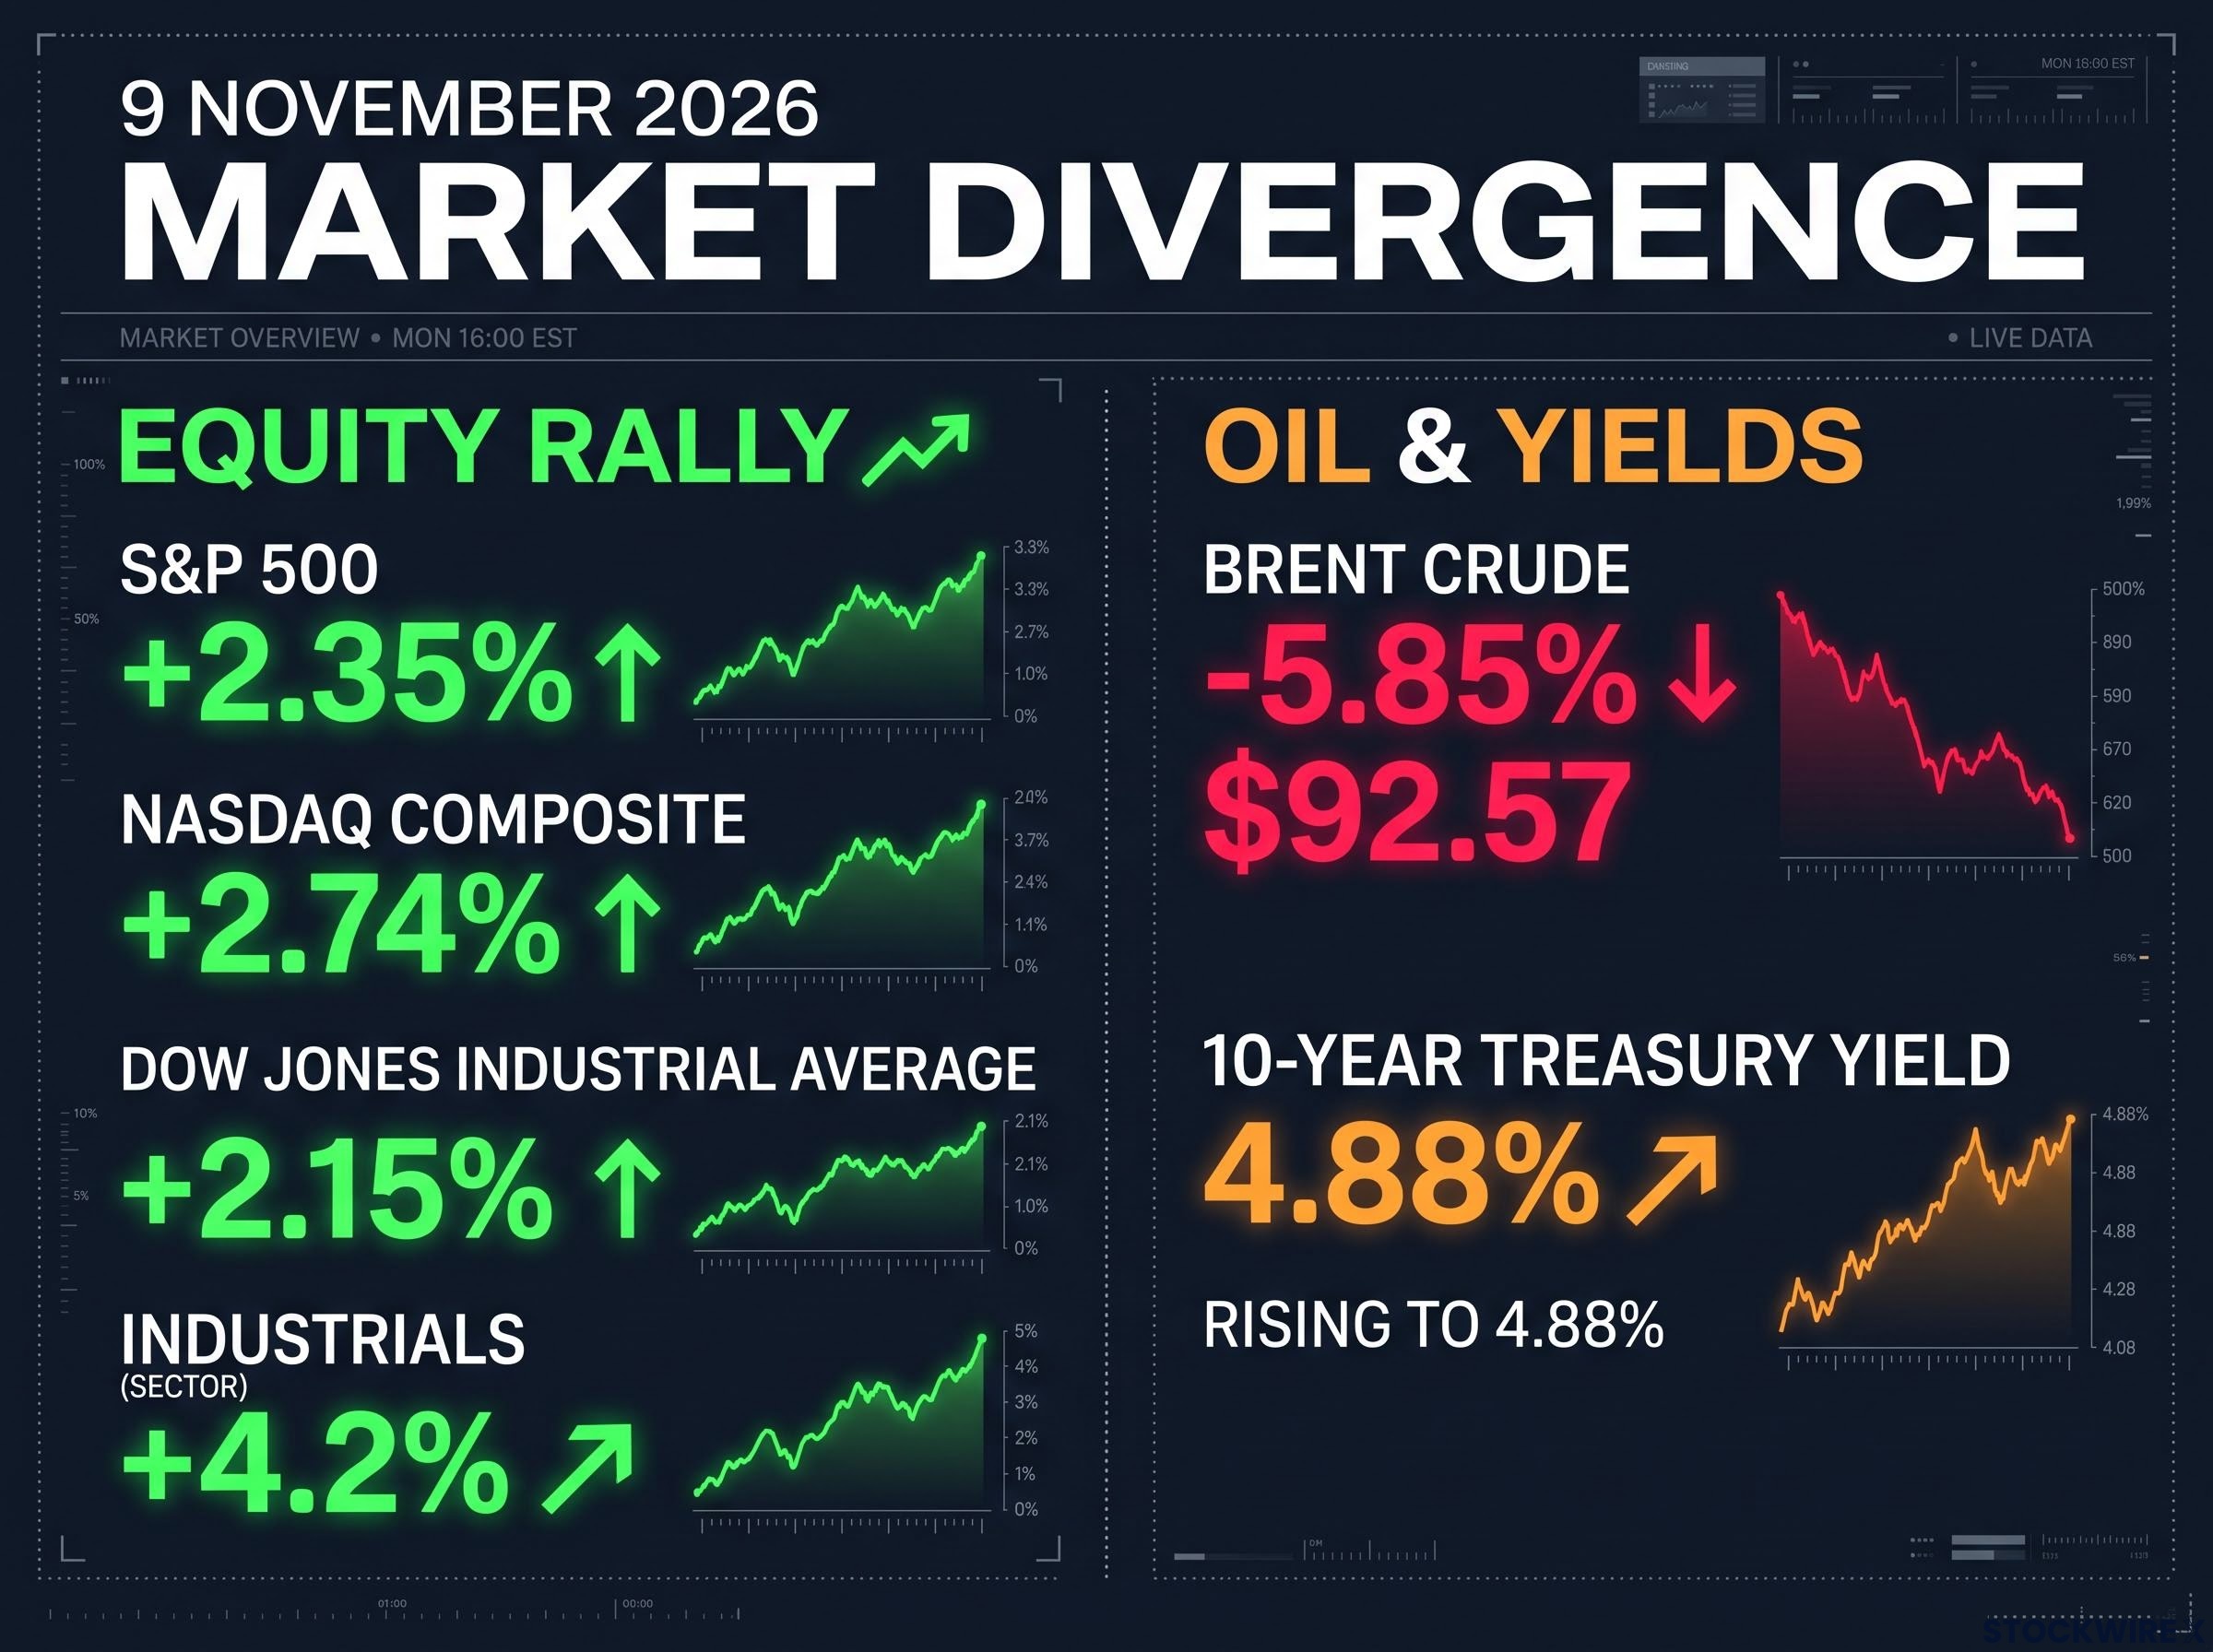
On 9 November 2026, the S&P 500 rose +2.35% and Industrials jumped +4.2%, contrasting with a -5.85% drop in Brent Crude to $92.57 and a 4.88% 10-Year yield.
Why did falling oil lift industrials and materials ahead of tech?
Start with the scoreboard. Every S&P 500 sector closed higher, energy lagged, and the cyclical end of the market moved furthest.
| Instrument or sector | Close or move (9 November 2026) |
|---|---|
| S&P 500 | 7,549.94 (+2.35%) |
| Nasdaq Composite | 25,253.14 (+2.74%) |
| Dow Jones Industrial Average | 52,389.75 (+2.15%) |
| Industrials | +4.2% |
| Consumer discretionary | +3.7% |
| Information technology | +3.0% |
| Brent crude | $92.57 (-5.85%) |
| WTI crude | $86.85 (-4.38%) |
The sector figures are CNBC’s closing data. One strategist’s overnight summary gave different numbers: industrials up 4.5% and materials up 3.4%. Materials is the only figure available for that sector, so treat it with care.
The trigger was diplomatic. Investors grew more hopeful that talks involving Washington, Tehran and Qatar could reduce the risk of further US strikes and disruption around the Strait of Hormuz. President Trump said extensive strikes on Iran were highly unlikely, but only if Iran signed a strong agreement. Brent had been above $112 earlier in the month.
Weekend reports of strikes on a Saudi pipeline and a tanker also circulated. They were not confirmed as the driver of the oil move.
The rotation follows a five-step chain:
- Lower headline inflation pressure, because energy feeds into transport, chemicals and manufacturing costs.
- Higher real household income, as fuel bills shrink.
- Better industrial margins for transport groups, manufacturers and chemical makers.
- Softer rate pricing, as inflation risk recedes.
- A risk-on tilt toward cyclicals, the stocks most tied to economic activity and capital spending.
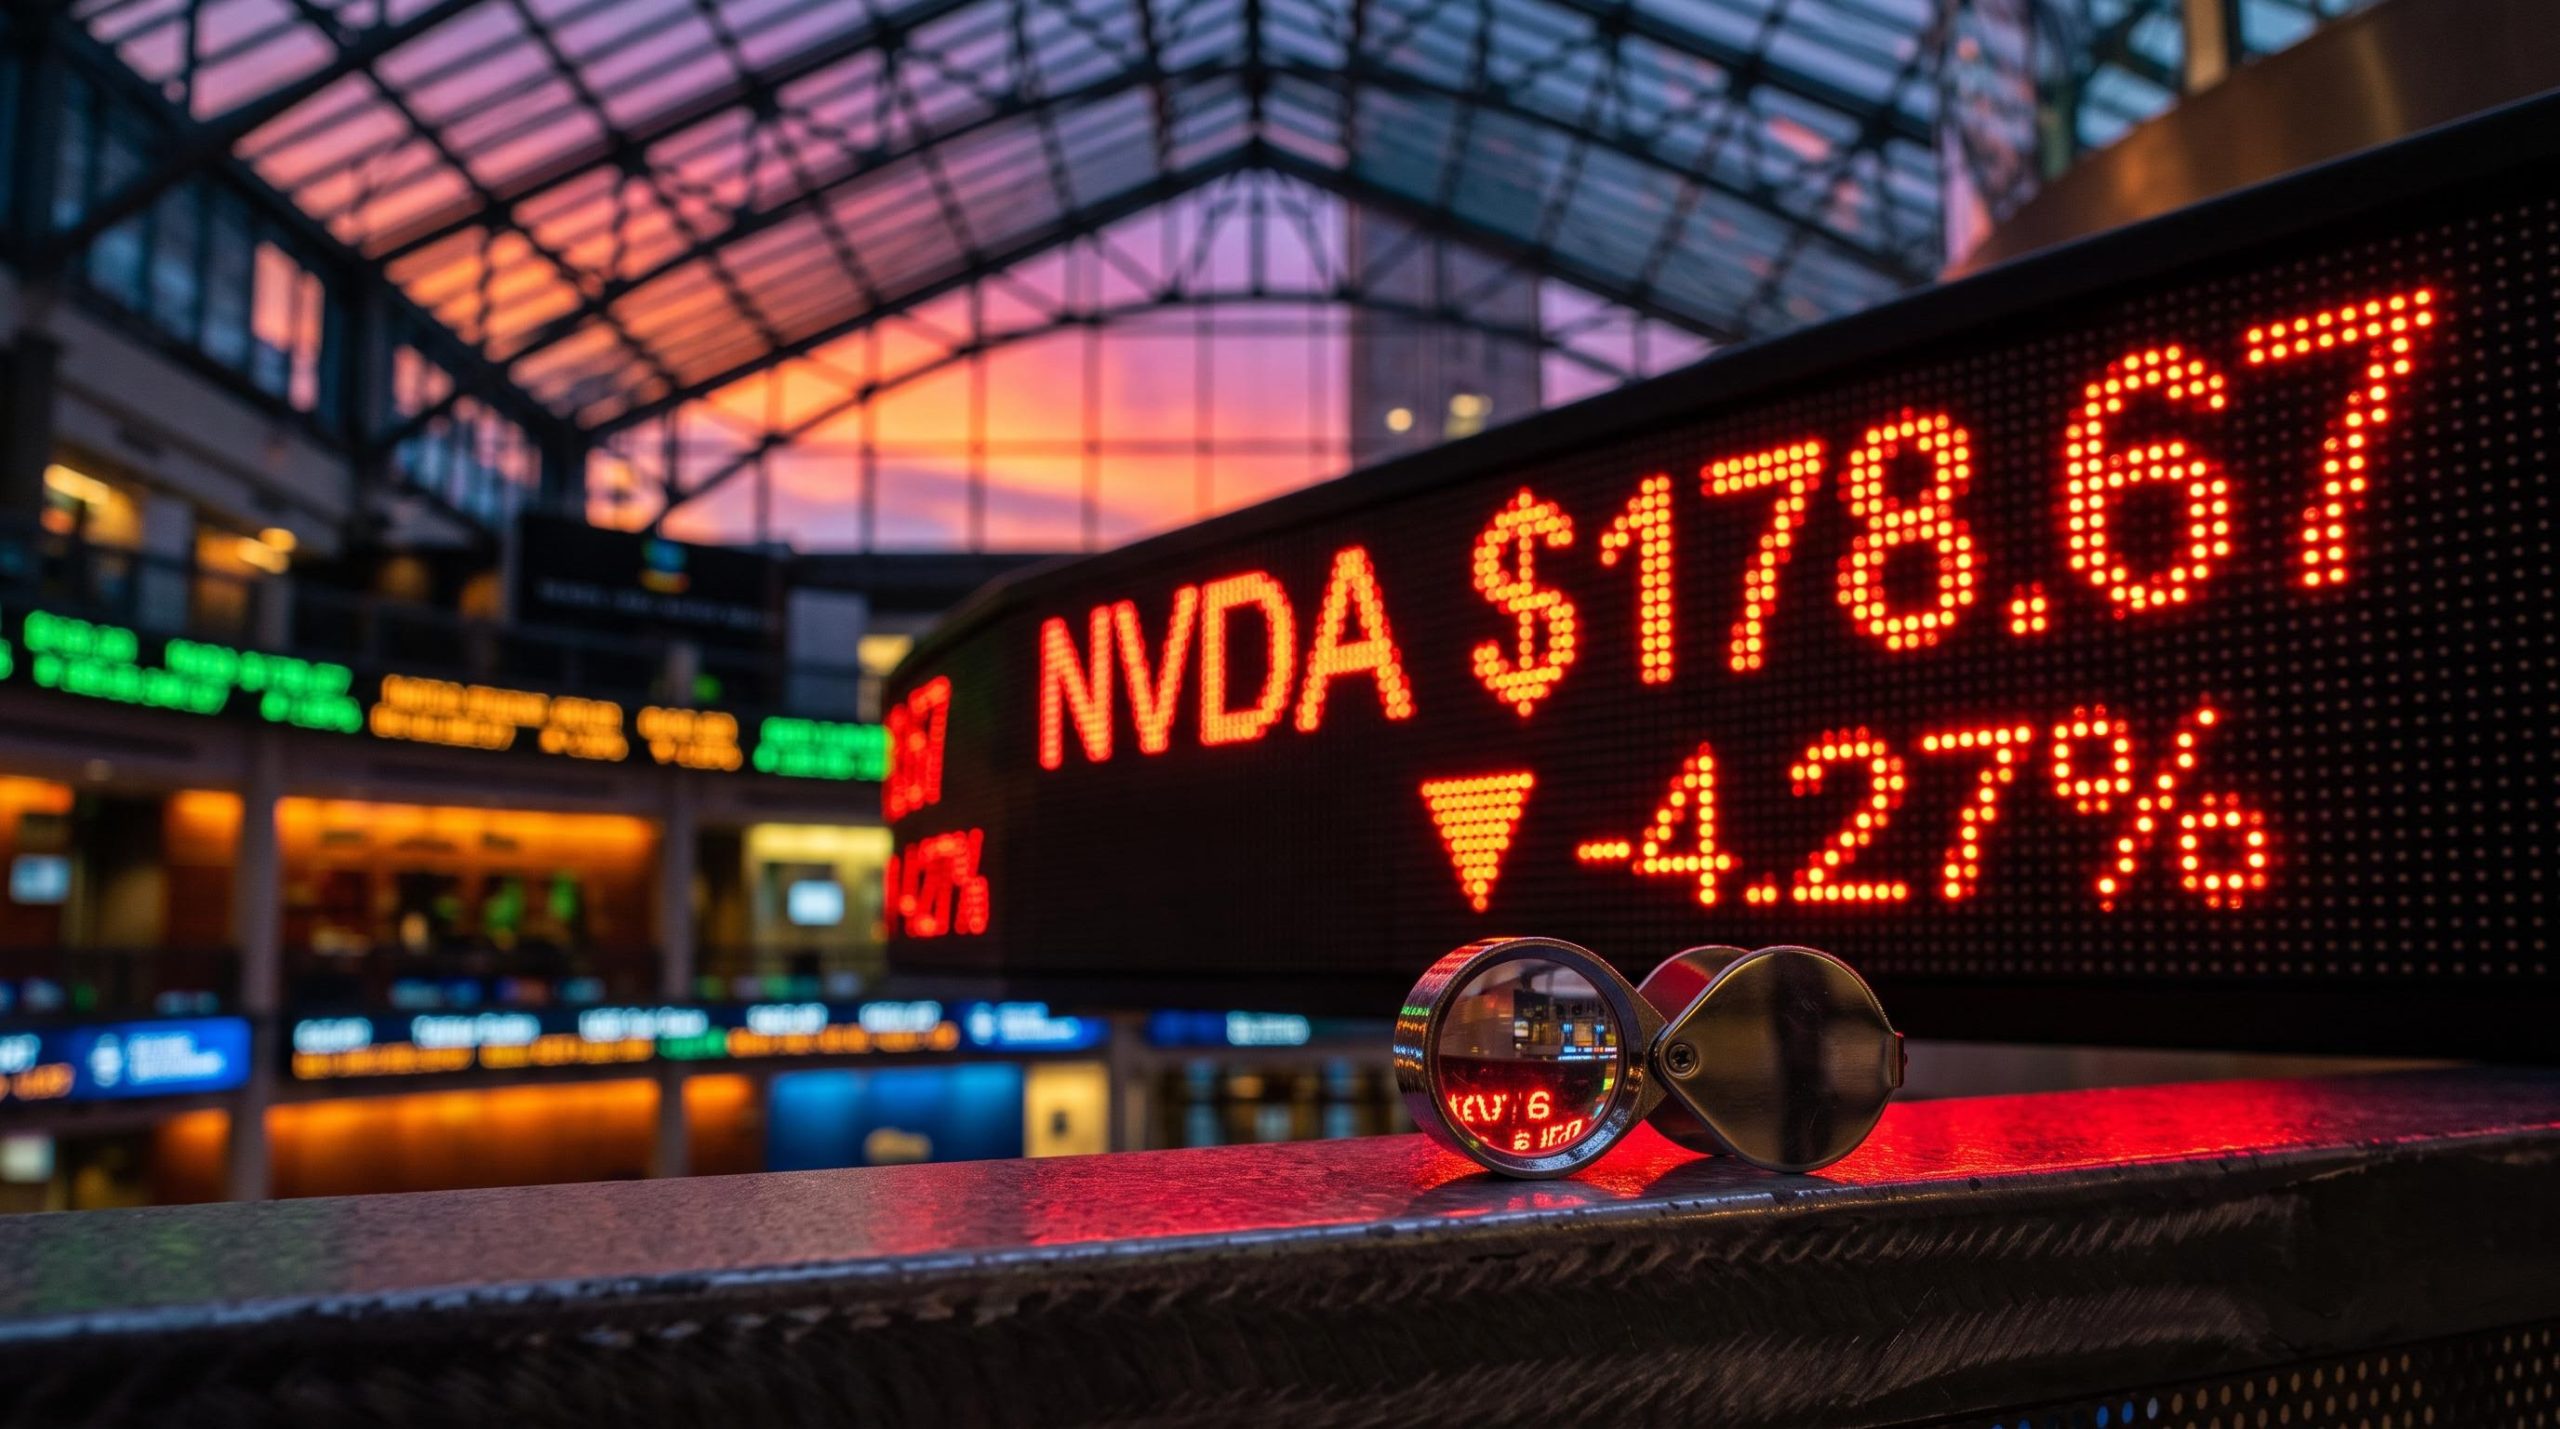
Technology still gained, led by AMD (up 13.3%) and Broadcom (up 8.8%), despite Nvidia falling 4.3%. This was a relief rally after the previous week’s sell-off. On 3 November, Reuters recorded a similar pattern: consumer discretionary rose 2.25%, materials 1.83% and energy fell 4% on hopes of a US-Iran deal. When leadership moves away from tech toward cost-exposed sectors, it shows you where risk appetite is heading.
Industrial sector indicators such as the ISM Manufacturing PMI and the Federal Reserve G.17 industrial production report have historically turned ahead of the broader market, which gives the sector’s leadership a signalling role beyond its index weight.
When big ASX news breaks, our subscribers know first
Why did yields rise when oil fell, and what does CPI decide?
On paper, cheaper oil should have pulled bond yields down. It did the opposite.
The split screen Brent fell 5.85%. The 10-year Treasury yield rose about 2 basis points, from 4.86% to 4.88% (Associated Press).
Oil prices and interest rates are not linked mechanically. Bond traders were also weighing resilient growth, government borrowing and uncertainty over the Federal Reserve’s next moves. Markets still price two Fed rate hikes by mid-2027, so lower oil reduces the risk of further hikes without removing it. The S&P 500, for all Monday’s gains, is flat since the US midterm elections.
That puts the weight on Tuesday’s CPI release. No authoritative consensus forecast was located, so the outcomes are best treated as scenarios:
- Hot CPI: strengthens the case for higher rates for longer, likely lifting yields and testing the cyclical rally.
- Soft CPI: supports the view that lower energy costs are easing inflation, giving the equity move the bond confirmation it lacks.
These scenarios are speculative and subject to change based on market developments.
For you, the takeaway is that the bond market has not confirmed the rally yet. CPI decides whether Monday’s gains rest on easing rate expectations or on relief alone.
Gold, copper, aluminium and uranium: where the hard-asset money went
Metals rose alongside cyclicals, but each had its own reason.
| Commodity | Level | Move | Main driver |
|---|---|---|---|
| Gold | About $4,150 | About +1.8% | Central-bank and ETF buying |
| Copper (LME 3-month) | $13,908/t | About +1% (source: +2.2%) | Grid, AI and defence demand |
| Aluminium (LME) | $3,071/t | +0.3% | Falling stockpiles |
| Uranium equities | Spot price not located | About +6% | Sentiment shift, AI power demand |
Gold
Gold rose on official-sector buying. The World Gold Council (WGC) reported Q3 central-bank purchases of 321 tonnes, up 42% year on year, while gold exchange-traded fund (ETF) holdings reached a record 4,256 tonnes. The People’s Bank of China added bullion again in October.
Copper and aluminium
Copper’s move depends on the source: about 1% on the LME, against 2.2% in a strategist’s summary. China’s Yangshan import premium hit a record $230 per tonne, pointing to strong Chinese demand, with grid building, AI data centres and defence spending providing the backdrop.
Aluminium moved less. LME inventories fell 4,600 tonnes to 231,200 tonnes, and cash metal traded at about a $92 premium to the three-month contract, a sign that nearby supply is tight.
Uranium
Uranium equities rose about 6%, with Constellation Energy up almost 11% after months of flat sentiment. Sprott scenarios point to cumulative supply deficits of 700 million to 1.7 billion pounds through 2040, and US AI power demand approaching 200 gigawatts by 2033. Those are long-term arguments, not proof that one day of cheaper oil repriced the sector. A rising metals basket does not mean everything moved for the same reason.
For readers wanting to judge the uranium move more closely, our full explainer on uranium spot and term prices shows why long-term contract pricing is the stronger fundamental signal.
What could unwind the rally, and where Nvidia fits
The gains have several weak points. Listed by how soon they could arrive:
- Hot CPI on Tuesday, which could lift yields and cut easing hopes.
- An oil rebound if the Iran talks fail, bringing back the geopolitical premium quickly.
- Rising yields, which put pressure on long-duration growth stocks.
- Crowding in industrials, materials and uranium, which could lead to sharp reversals.
- A growth scare, where falling oil starts to reflect weak demand rather than lower risk.
That last point matters most. Cheaper oil helps when the war premium is falling, but it signals trouble when recession fears are behind it. WisdomTree has argued that AI infrastructure is initially inflationary, and the WGC noted gold weakened in October as investors moved into higher-yielding Treasuries. The evidence supports a short-term relief pattern, not a reliable historical rule.
Past episodes of oil crossing $100, in 2008, 2011 and 2022, produced S&P 500 returns below the long-run average over the following year, which is why historical oil shocks tend to be read as a headwind rather than a verdict.
Nvidia’s board probe
Nvidia’s fall of about 4.3%, to its lowest close since 7 April according to Reuters, came from company-specific news. Its board opened an independent investigation into reports that CEO Jensen Huang was targeted by a foreign-intelligence effort. The board said it had no reason to believe secrets were compromised.
A class action has also been reported. Trump said the FBI was looking into the matter, but Reuters did not confirm a Department of Justice investigation. Keep this separate from the sector picture when you read tech’s performance.
Three signals that will show whether the rotation lasts
Monday was a relief and risk-repricing event. It did not confirm a structural rotation driven by Fed easing. Three signals will settle that:
- Tuesday’s CPI print, and whether it eases or reinforces hike pricing.
- The direction of Brent after the Qatar and Iran talks.
- Whether the 10-year yield moves away from 4.88%, and in which direction.
If all three point the same way, the case for industrials and hard assets gets much stronger. If they split, as oil and bonds did on Monday, treat the shift into cyclicals as a trade still waiting for confirmation.
This article is for informational purposes only and should not be considered financial advice. Investors should conduct their own research and consult with financial professionals before making investment decisions.