Richmond Fed President Tom Barkin said on 9 November that he has “no base case” for the Federal Reserve’s December meeting. Markets, meanwhile, price roughly an 80% chance of a 25 basis point hike.
Barkin was clear about where he sees the bigger danger. After nearly six years of inflation running above the Fed’s 2% target, he named inflation as the greater risk. The US dollar still slipped against most major currencies on the same day.
That gap between a hawkish tone and a softer dollar matters. Here is what the coming data and the currency’s reaction tell you about how the Fed’s December rate decision could play out.
Why does a Fed official with no base case still lean toward inflation?
Barkin offered no forecast, yet his speech carried a clear tilt.
Speaking to the Greater Greer Chamber of Commerce in Greer, South Carolina, he said he would weigh incoming inflation and jobs data before settling on December. He described the right direction for policy as fairly simple but said officials should move “with care.”
The lean shows up in how he framed the risks rather than in any call on December. The Fed has a dual mandate, meaning it must pursue both stable prices and maximum employment. On that mandate, Barkin left little doubt:
“The risk lies on the inflation side of our dual mandate.” Tom Barkin, President, Federal Reserve Bank of Richmond
He pointed to firms “trying to pass on higher costs” and called the economy “remarkably stable.” His caution still runs both ways. He put the policy rate “around or slightly below neutral” (the level that neither speeds up nor slows the economy) in a labour market where firms are neither hiring nor firing much.
Here is where policy stands:
- Target range: 3.75%-4.00%
- Last decision: held on 28 October, a 10-2 vote
- Next meeting: 8-9 December
- Market pricing: about 80% odds of a 25 bp hike, up from about 67% before the October jobs report
Barkin is not alone. Reuters reported on 5 November that Cleveland Fed President Beth Hammack favours a gradual hiking path, and Barkin’s view was reported as broadly consistent with hers. Mark Zandi of Moody’s Analytics expects one more hike after December.
When a policymaker declines to commit but names inflation as the main threat, it tells you the bar for holding in December is higher than the bar for hiking. The next data prints will decide which way it goes.
Part of the hawkish tilt reflects supply-driven inflation, since producer energy prices account for most of the recent rise in goods prices, which is why some analysts question how much a hike can actually fix.
What data and AI uncertainty will decide the December call?
The countdown starts tomorrow. Each release between now and 8 December is a live test of Barkin’s framing.
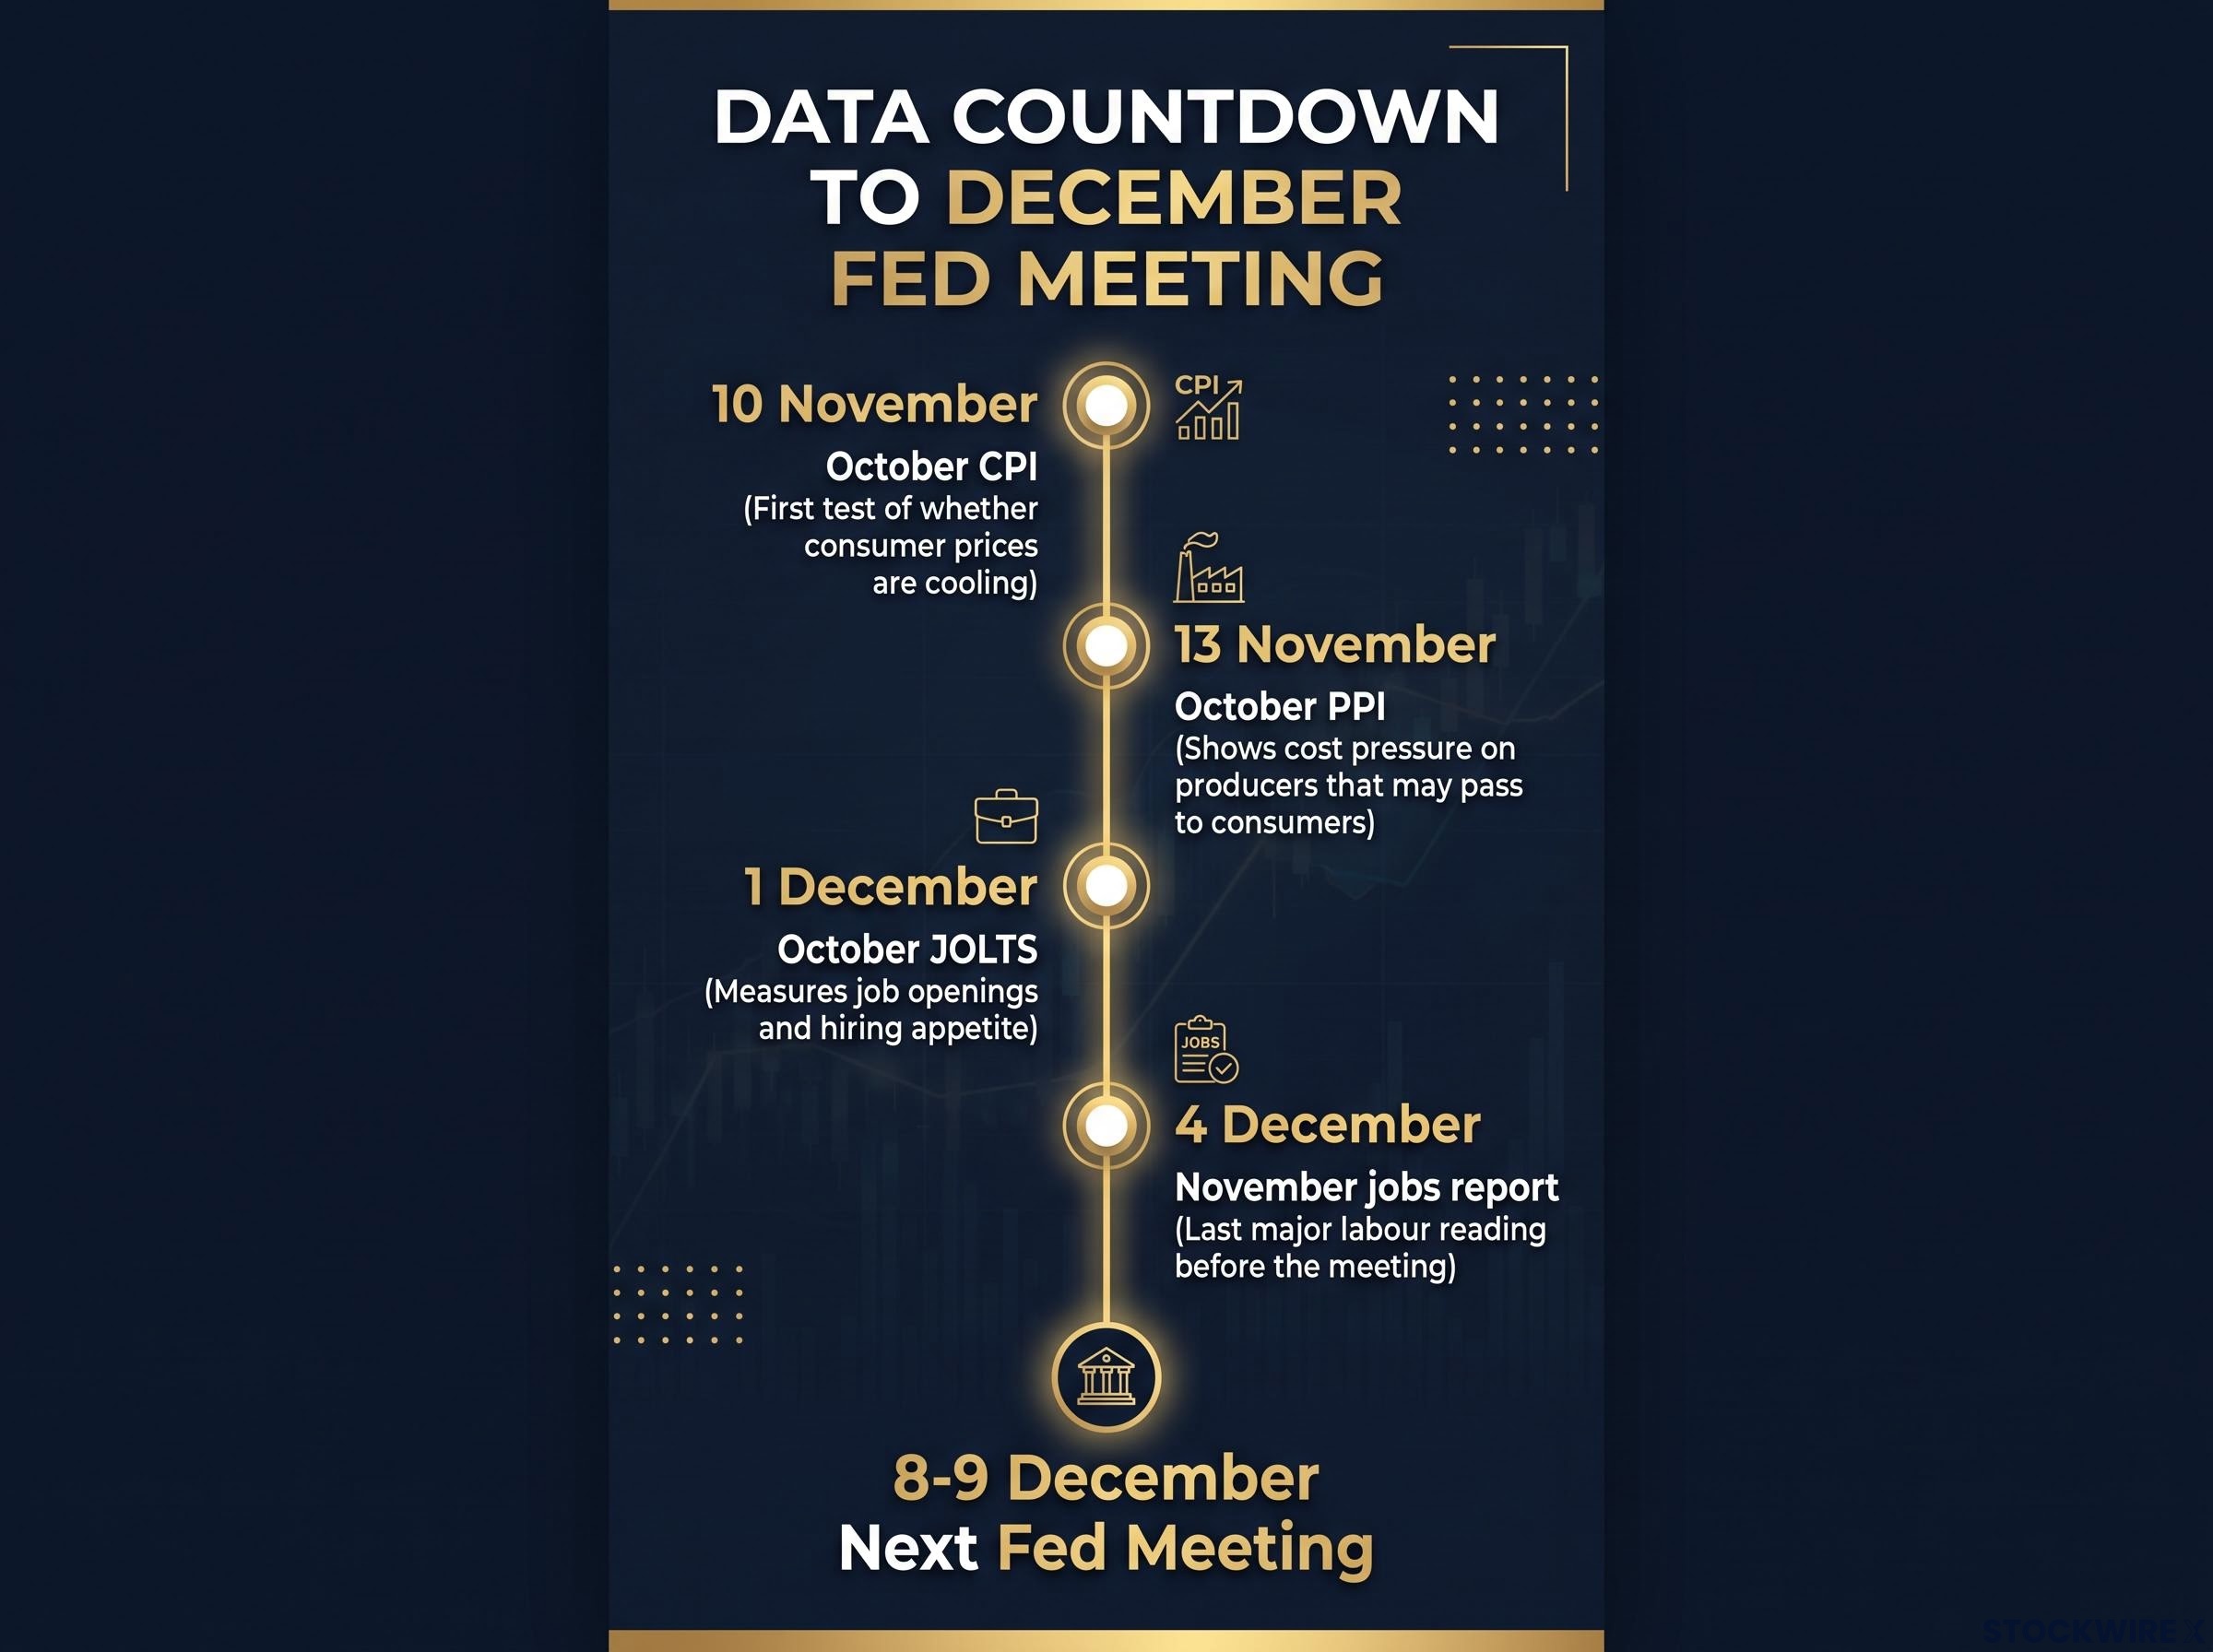
Key economic data including the 10 November CPI and 4 December jobs report will serve as live tests before the 8-9 December Fed meeting.
The latest readings sit well above target. The Bureau of Economic Analysis reported on 29 October that headline personal consumption expenditures (PCE) inflation, the Fed’s preferred price gauge, ran at 3.6% year on year in September (0.5% month on month). Core PCE, which strips out food and energy, was 3.1% (0.3% monthly). The Bureau of Labor Statistics reported 165,000 new jobs in October, with unemployment at 4.1%.
| Release | Date | Why it matters |
|---|---|---|
| October CPI | 10 November | First test of whether consumer prices are cooling |
| October PPI | 13 November | Shows cost pressure on producers that may pass to consumers |
| October JOLTS | 1 December | Measures job openings and hiring appetite |
| November jobs report | 4 December | Last major labour reading before the meeting |
| November CPI | 10 December | Lands after the meeting begins, too late for the decision |
The consumer price index (CPI) tracks prices households pay, while the producer price index (PPI) tracks prices businesses receive. Strong jobs and sticky inflation keep the hike case alive. A soft jobs report or cooler prices would give officials room to pause, and you should read each release against that test.
Federal Reserve research suggests tariff pass-through to core goods prices was largely complete by early 2026, though import-heavy categories can lag by 6-12 months, leaving some cost pressure still to appear in the data.
Further out, Morningstar’s Preston Caldwell projects 2026 PCE inflation of 3.4%, easing to 2.5% in 2027 as tariff effects fade. Morningstar also flagged heavy AI-related investment adding pressure on goods prices. Past performance does not guarantee future results, and projections are subject to market conditions and various risk factors.
AI as the labour-market wildcard
Barkin called AI “particularly consequential.” If it underdelivers, investment, asset prices and spending could weaken. If it overdelivers, it could displace more workers than expected.
The evidence so far is mixed. Fed Vice Chair Michael Barr said in September that AI may already be limiting entry-level hiring in exposed sectors, but saw little economy-wide displacement. Dallas Fed research found job declines concentrated among younger workers, mainly through fewer hires rather than layoffs. An Atlanta Fed survey of nearly 750 executives found productivity gains and little sign of near-term aggregate job losses.
A Richmond Fed working paper modelled a harsher scenario: a 23% employment loss, half within five years. That is a modelled case, not a forecast.
With outcomes this wide, the argument for moving “with care” gets stronger.
How does the Fed’s stance reach the US dollar, and why did it slip on 9 November?
The usual rule is simple. When the Fed is expected to raise rates, US yields rise, investors want more dollar assets and the currency firms. Quantitative easing (the Fed creating money to buy bonds) usually weakens the dollar, while quantitative tightening (letting those bonds run off) usually supports it. The Federal Open Market Committee (FOMC) sets this course at eight meetings a year, with twelve voters.
Monday’s trading cut against that rule. Trading Economics put the US Dollar Index (DXY), which measures the dollar against a basket of major currencies, at 101.8319, down 0.46%. Other reports differed, with one near 101.88 and another near 102.149, down 0.15%.
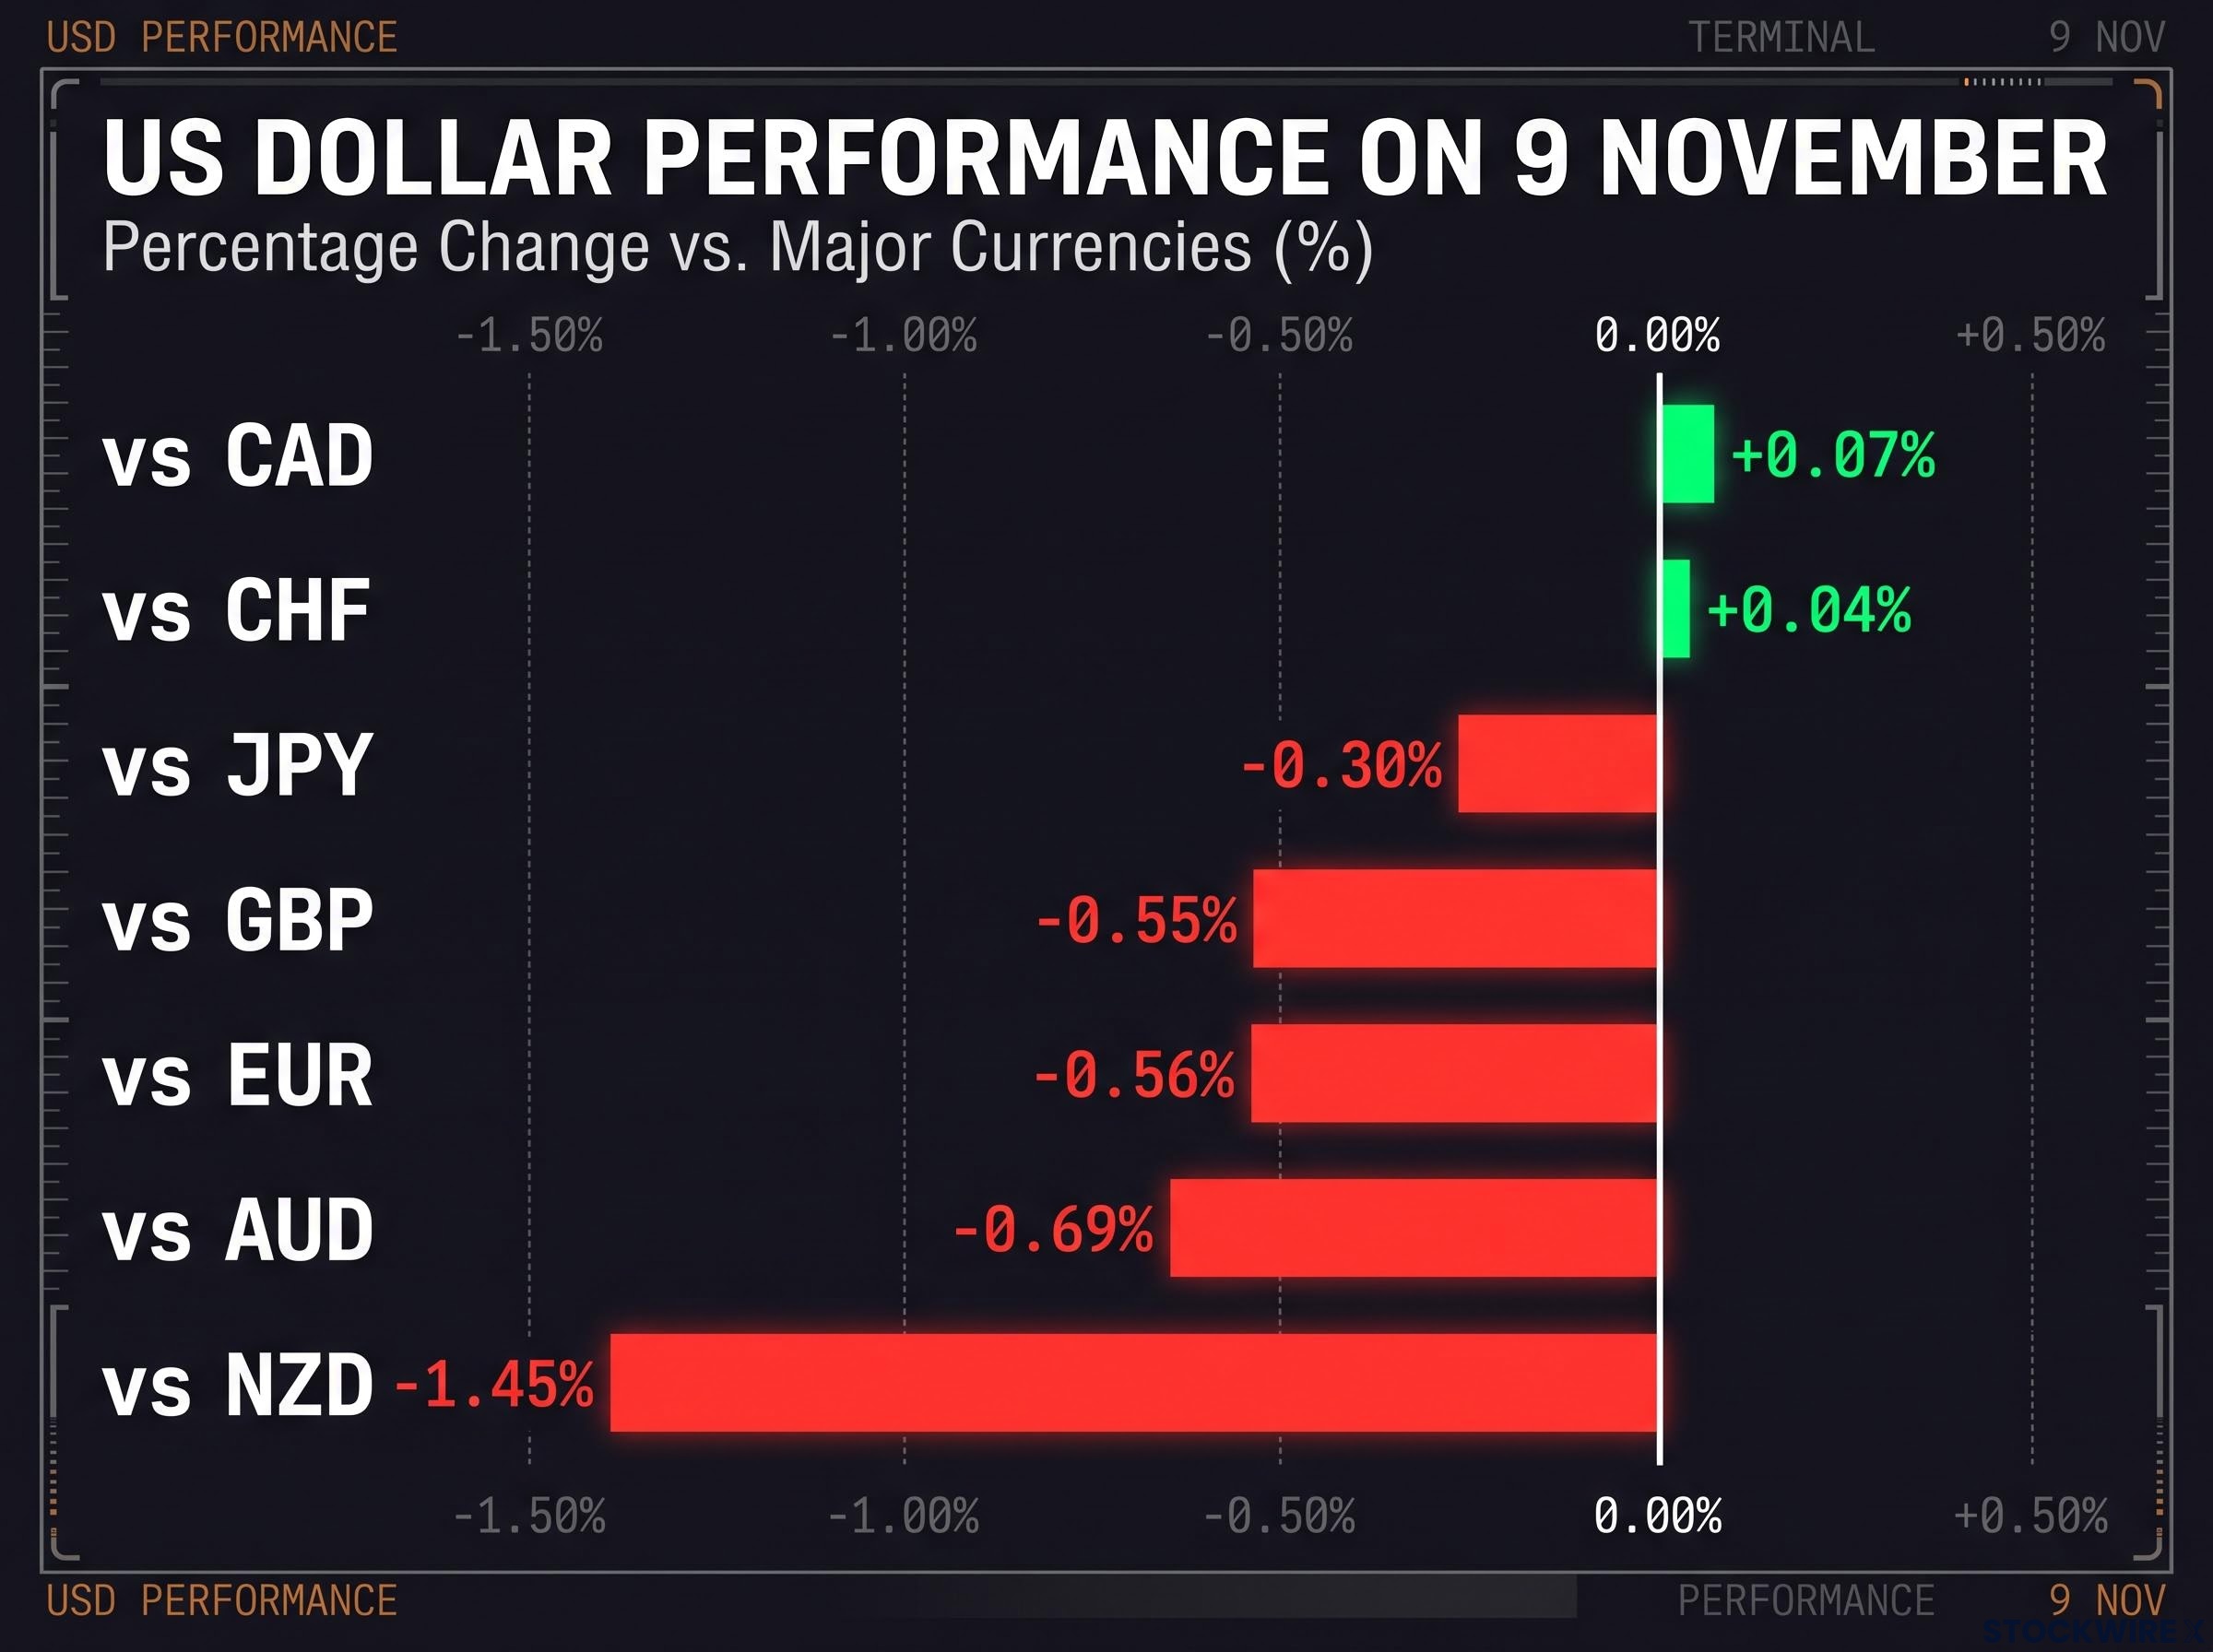
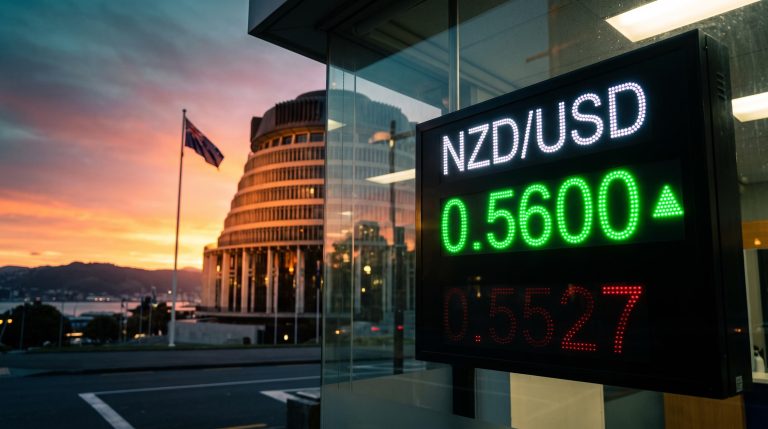
On 9 November, the US dollar slipped against most major currencies, with the steepest decline of -1.45% against the New Zealand dollar.
| Pair | USD change on 9 November |
|---|---|
| vs EUR | -0.56% |
| vs GBP | -0.55% |
| vs JPY | -0.30% |
| vs AUD | -0.69% |
| vs NZD | -1.45% |
| vs CAD | +0.07% |
| vs CHF | +0.04% |
Source: FXStreet. Three forces pushed the dollar lower:
- Risk appetite: recovering global equities reduced demand for the dollar as a safe haven
- Profit-taking: traders cashed in after Friday’s jobs-driven gains
- Priced-in hike: with December about 80% expected, little fresh support remained
An expected hike does little for the dollar. What could move it from here is a signal that tightening will run faster or longer than markets assume.
For readers weighing whether the dollar’s pullback signals a turn, our full explainer on dollar rallies sets out a three-layer framework for separating continuation from reversal.
What to watch before the Fed decides in December
The debate inside the Fed is not whether inflation is too high. It is whether to hike now or proceed cautiously with policy already near neutral.
October CPI on 10 November is the next test, and the 4 December jobs report looks like the likely tiebreaker. For the dollar, the deciding factor is whether officials hint at a faster tightening path or risk-on flows keep pulling money elsewhere. Watch those two releases, and the language around them, over the coming weeks.
Fed rate hike odds have swung sharply before, with September pricing collapsing from nearly 70% to a coin flip within 48 hours, a reminder that an 80% reading is not a certainty.
This article is for informational purposes only and should not be considered financial advice. Investors should conduct their own research and consult with financial professionals before making investment decisions.