
Manufacturing alone accounts for more than 10% of U.S. GDP, yet most investors treat the industrial sector as a single monolithic block rather than the layered, economically interconnected system it actually is. The sector sits at the intersection of physical production, infrastructure, and capital investment. Its 8.7% weight in the S&P 500 (as of March 2025) understates its economic footprint when measured by employment, output, and its role as a multiplier for virtually every other sector.
This article maps the sector from the inside out: its formal structure under the Global Industry Classification Standard (GICS), the sub-sectors that do the heavy economic lifting, the data that quantifies its scale, and the forces shaping its next decade. For investors building sector literacy, understanding how industrials are organised is foundational.
What the industrial sector actually covers (and what it does not)
Most investors hear “industrials” and picture factories. The reality is both broader and more precisely bounded than that assumption suggests. The industrial sector is a formally defined classification under GICS, not a loose label applied to anything involving physical production.
Common sources of confusion start at the edges. Utilities and energy are separate GICS sectors entirely, even though many readers instinctively associate power generation or oil extraction with “industrial” activity. The same applies to mining companies, which fall under the materials sector. The formal industrial sector boundary matters because it determines what sits inside sector exchange-traded funds (ETFs), index weightings, and fund prospectuses.
Within the S&P 500, the industrials sector carried a weight of 8.7% as of 29 March 2025, according to S&P Dow Jones Indices. That figure edged up from approximately 8.4% in late 2023, reflecting modest but not structural change in the sector’s relative standing. The sector remains mid-pack behind information technology, communication services, and health care.
The four industry groups inside the GICS Industrials sector
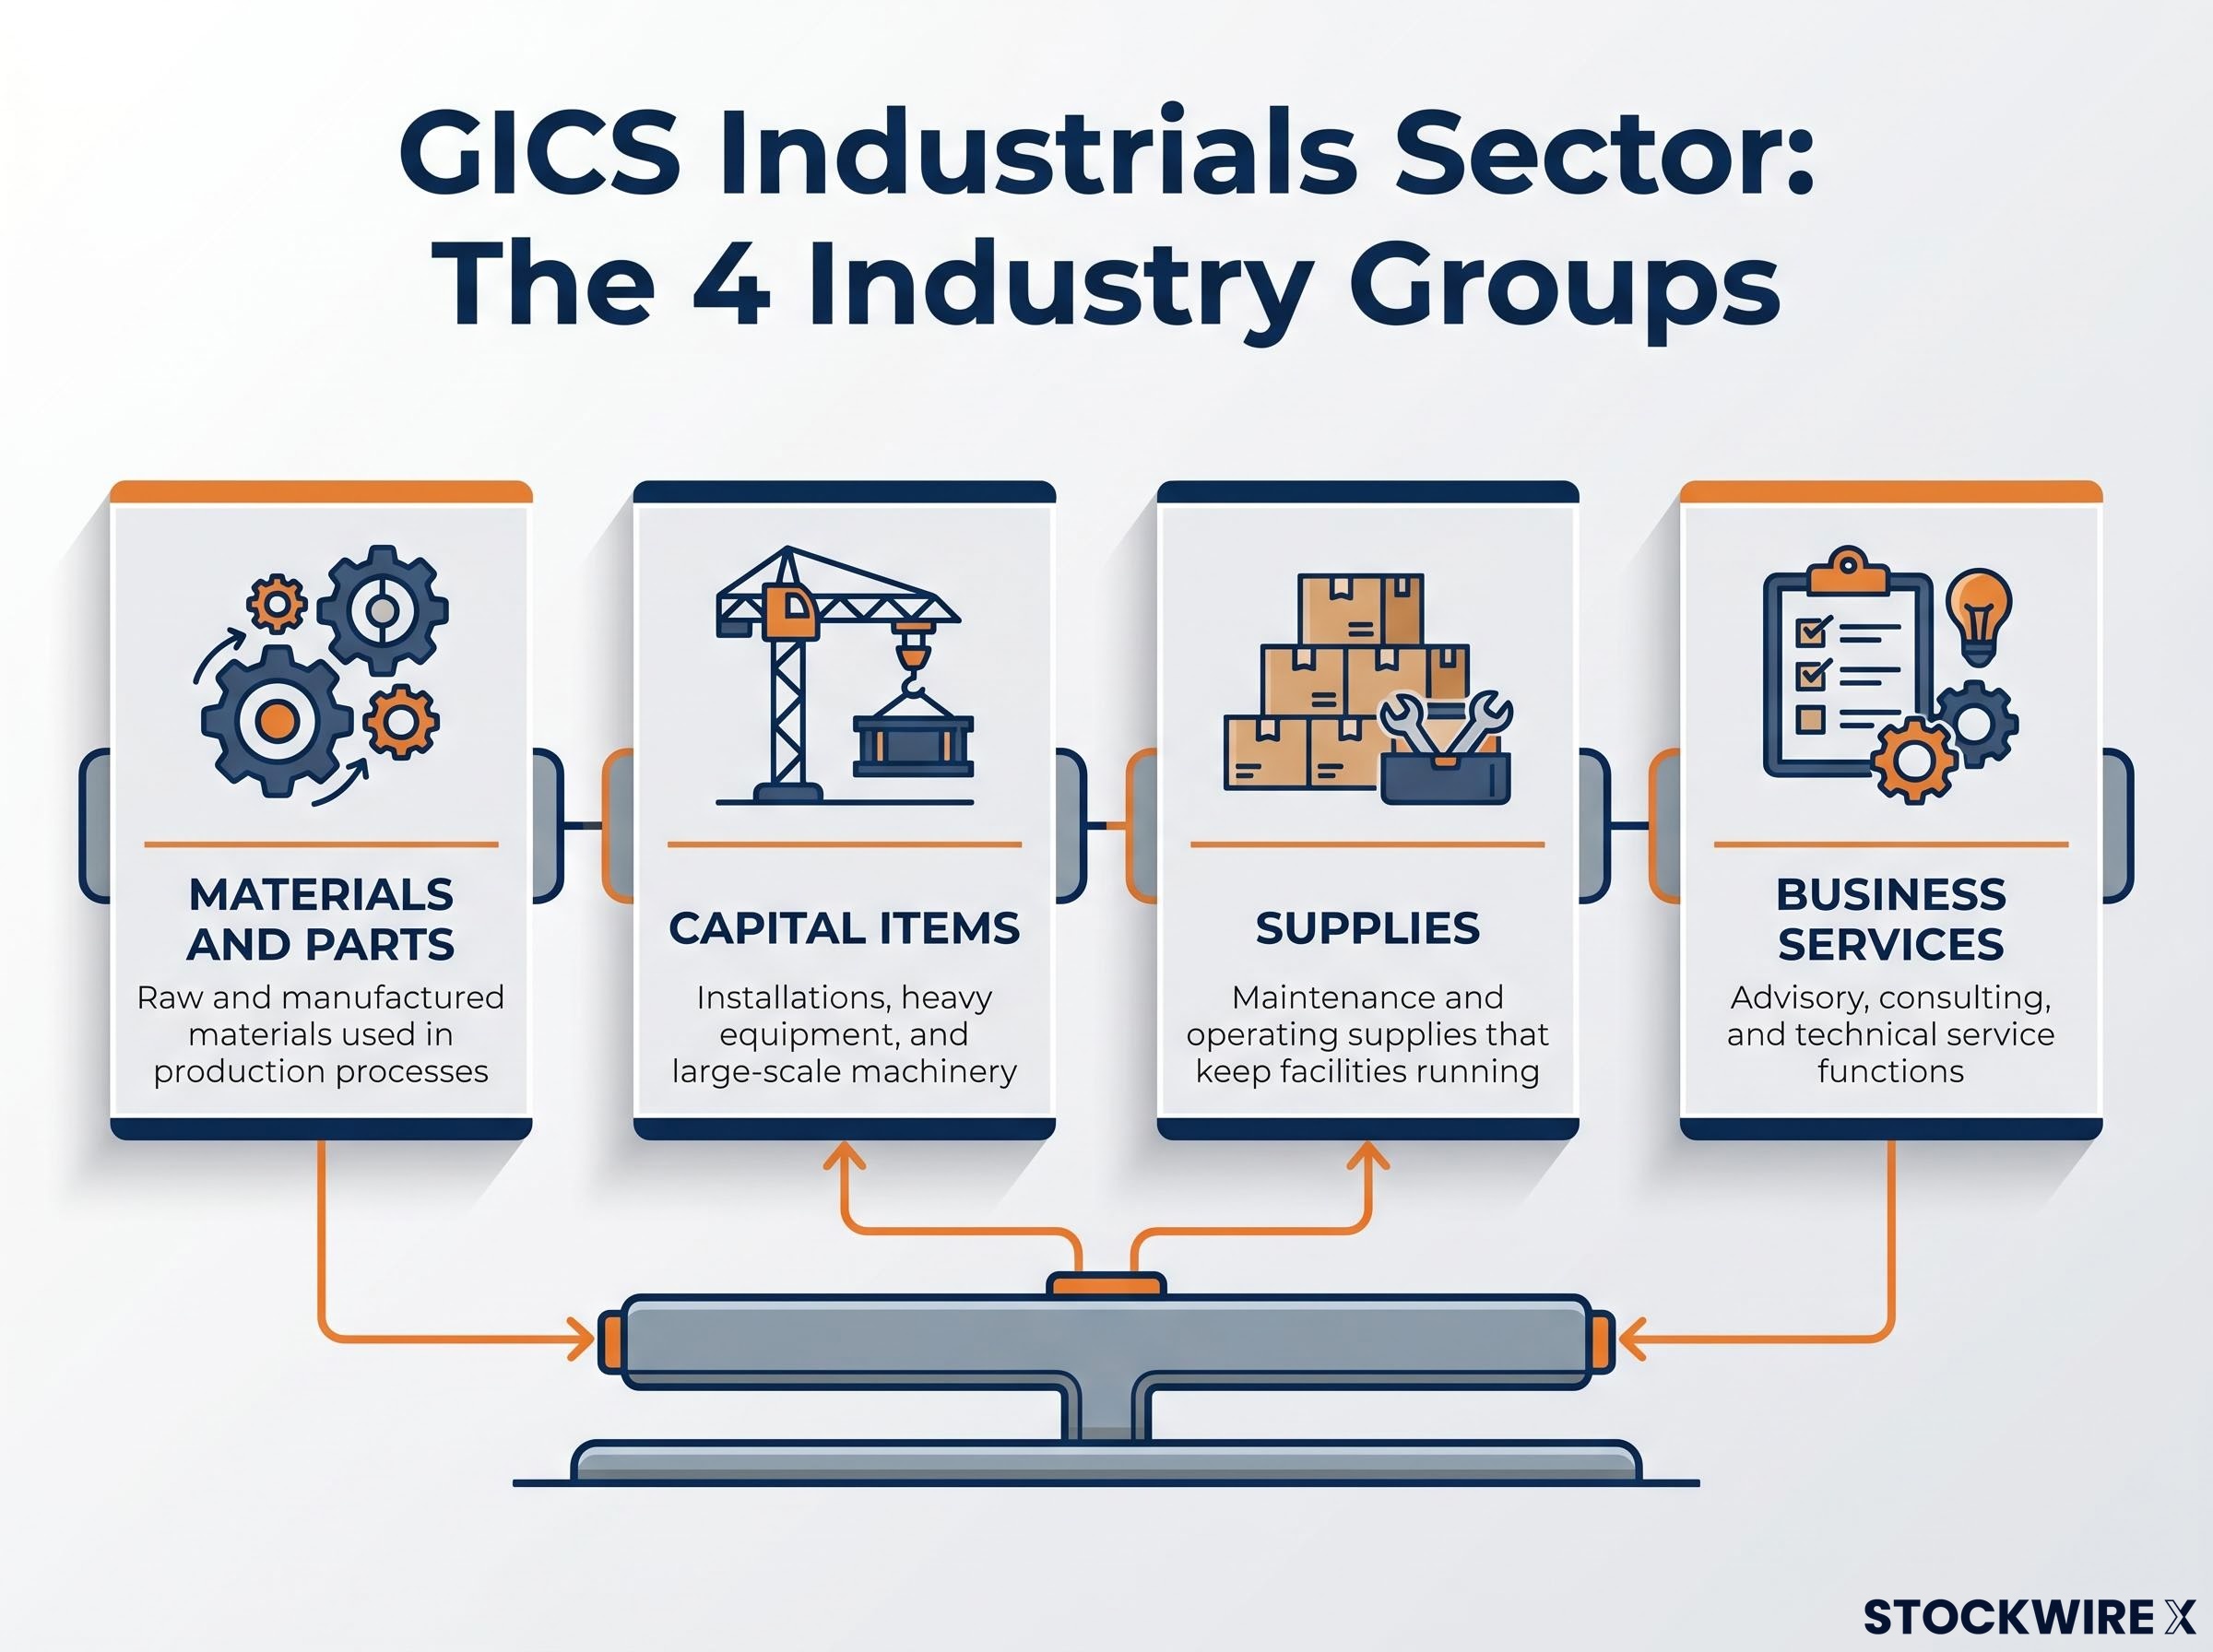
GICS organises the sector into four primary industry groups, each housing multiple named industries and individual companies:
- Materials and Parts: covers both raw and manufactured materials used in production processes
- Capital Items: includes installations, heavy equipment, and large-scale machinery
- Supplies: encompasses maintenance and operating supplies that keep facilities running
- Business Services: covers advisory, consulting, and technical service functions that support industrial operations
Each group represents a distinct link in the production chain. Investors who understand these categories can read a sector ETF’s holdings list and immediately identify where the fund’s exposure concentrates.
When big ASX news breaks, our subscribers know first
The three sub-sectors that generate most of the sector’s economic weight
Classification tells investors where the boundaries are. The three primary sub-sectors, manufacturing, construction, and utilities, tell investors what actually happens inside those boundaries and why the output is difficult to replace or relocate.
Manufacturing is the conversion engine. Raw materials enter; finished goods leave. The process requires labour, machinery, and physical plant, a combination of inputs that cannot be replicated by a services firm or a financial institution. As of April 2025, approximately 13.0 million workers were employed in U.S. manufacturing, according to the Bureau of Labor Statistics (BLS).
Construction is the infrastructure layer. Residential, commercial, and industrial buildings, along with roads, bridges, and utilities networks, all flow through this sub-sector. It employed approximately 8.3 million workers in the same period. Utilities, the smallest of the three by headcount at roughly 0.55 million workers, functions as the delivery mechanism for electricity, water, and gas, services every other sector depends on but none can self-provide at scale.
Manufacturing’s share of U.S. GDP stood at 10.2% in 2023, according to the Bureau of Economic Analysis (BEA), edging down to approximately 10.1% (preliminary) for 2024. That figure captures only one sub-sector. The three together, plus adjacent categories, form a substantially larger share of total output.
The BEA GDP by Industry data provides the value-added breakdown that underpins manufacturing’s measured share of total output, including the 10.2% figure for 2023 cited here, and is updated quarterly as preliminary and revised estimates are released.
| Sub-Sector | Primary Function | April 2025 Employment | GDP Contribution |
|---|---|---|---|
| Manufacturing | Converting raw materials into finished goods | ~13.0 million | ~10.1% (2024, preliminary) |
| Construction | Building and maintaining physical infrastructure | ~8.3 million | Included in goods-producing aggregate |
| Utilities | Delivering electricity, water, and gas services | ~0.55 million | Included in goods-producing aggregate |
Recognising the distinct economic function of each sub-sector helps investors understand why performance can diverge sharply within a single reporting period. A construction slowdown and a manufacturing boom can coexist, requiring nuanced rather than binary sector calls.
How to read the sector’s economic scale in context
The sector’s true size reveals itself in layers, and how investors read those layers determines whether they undercount or overcount its footprint.
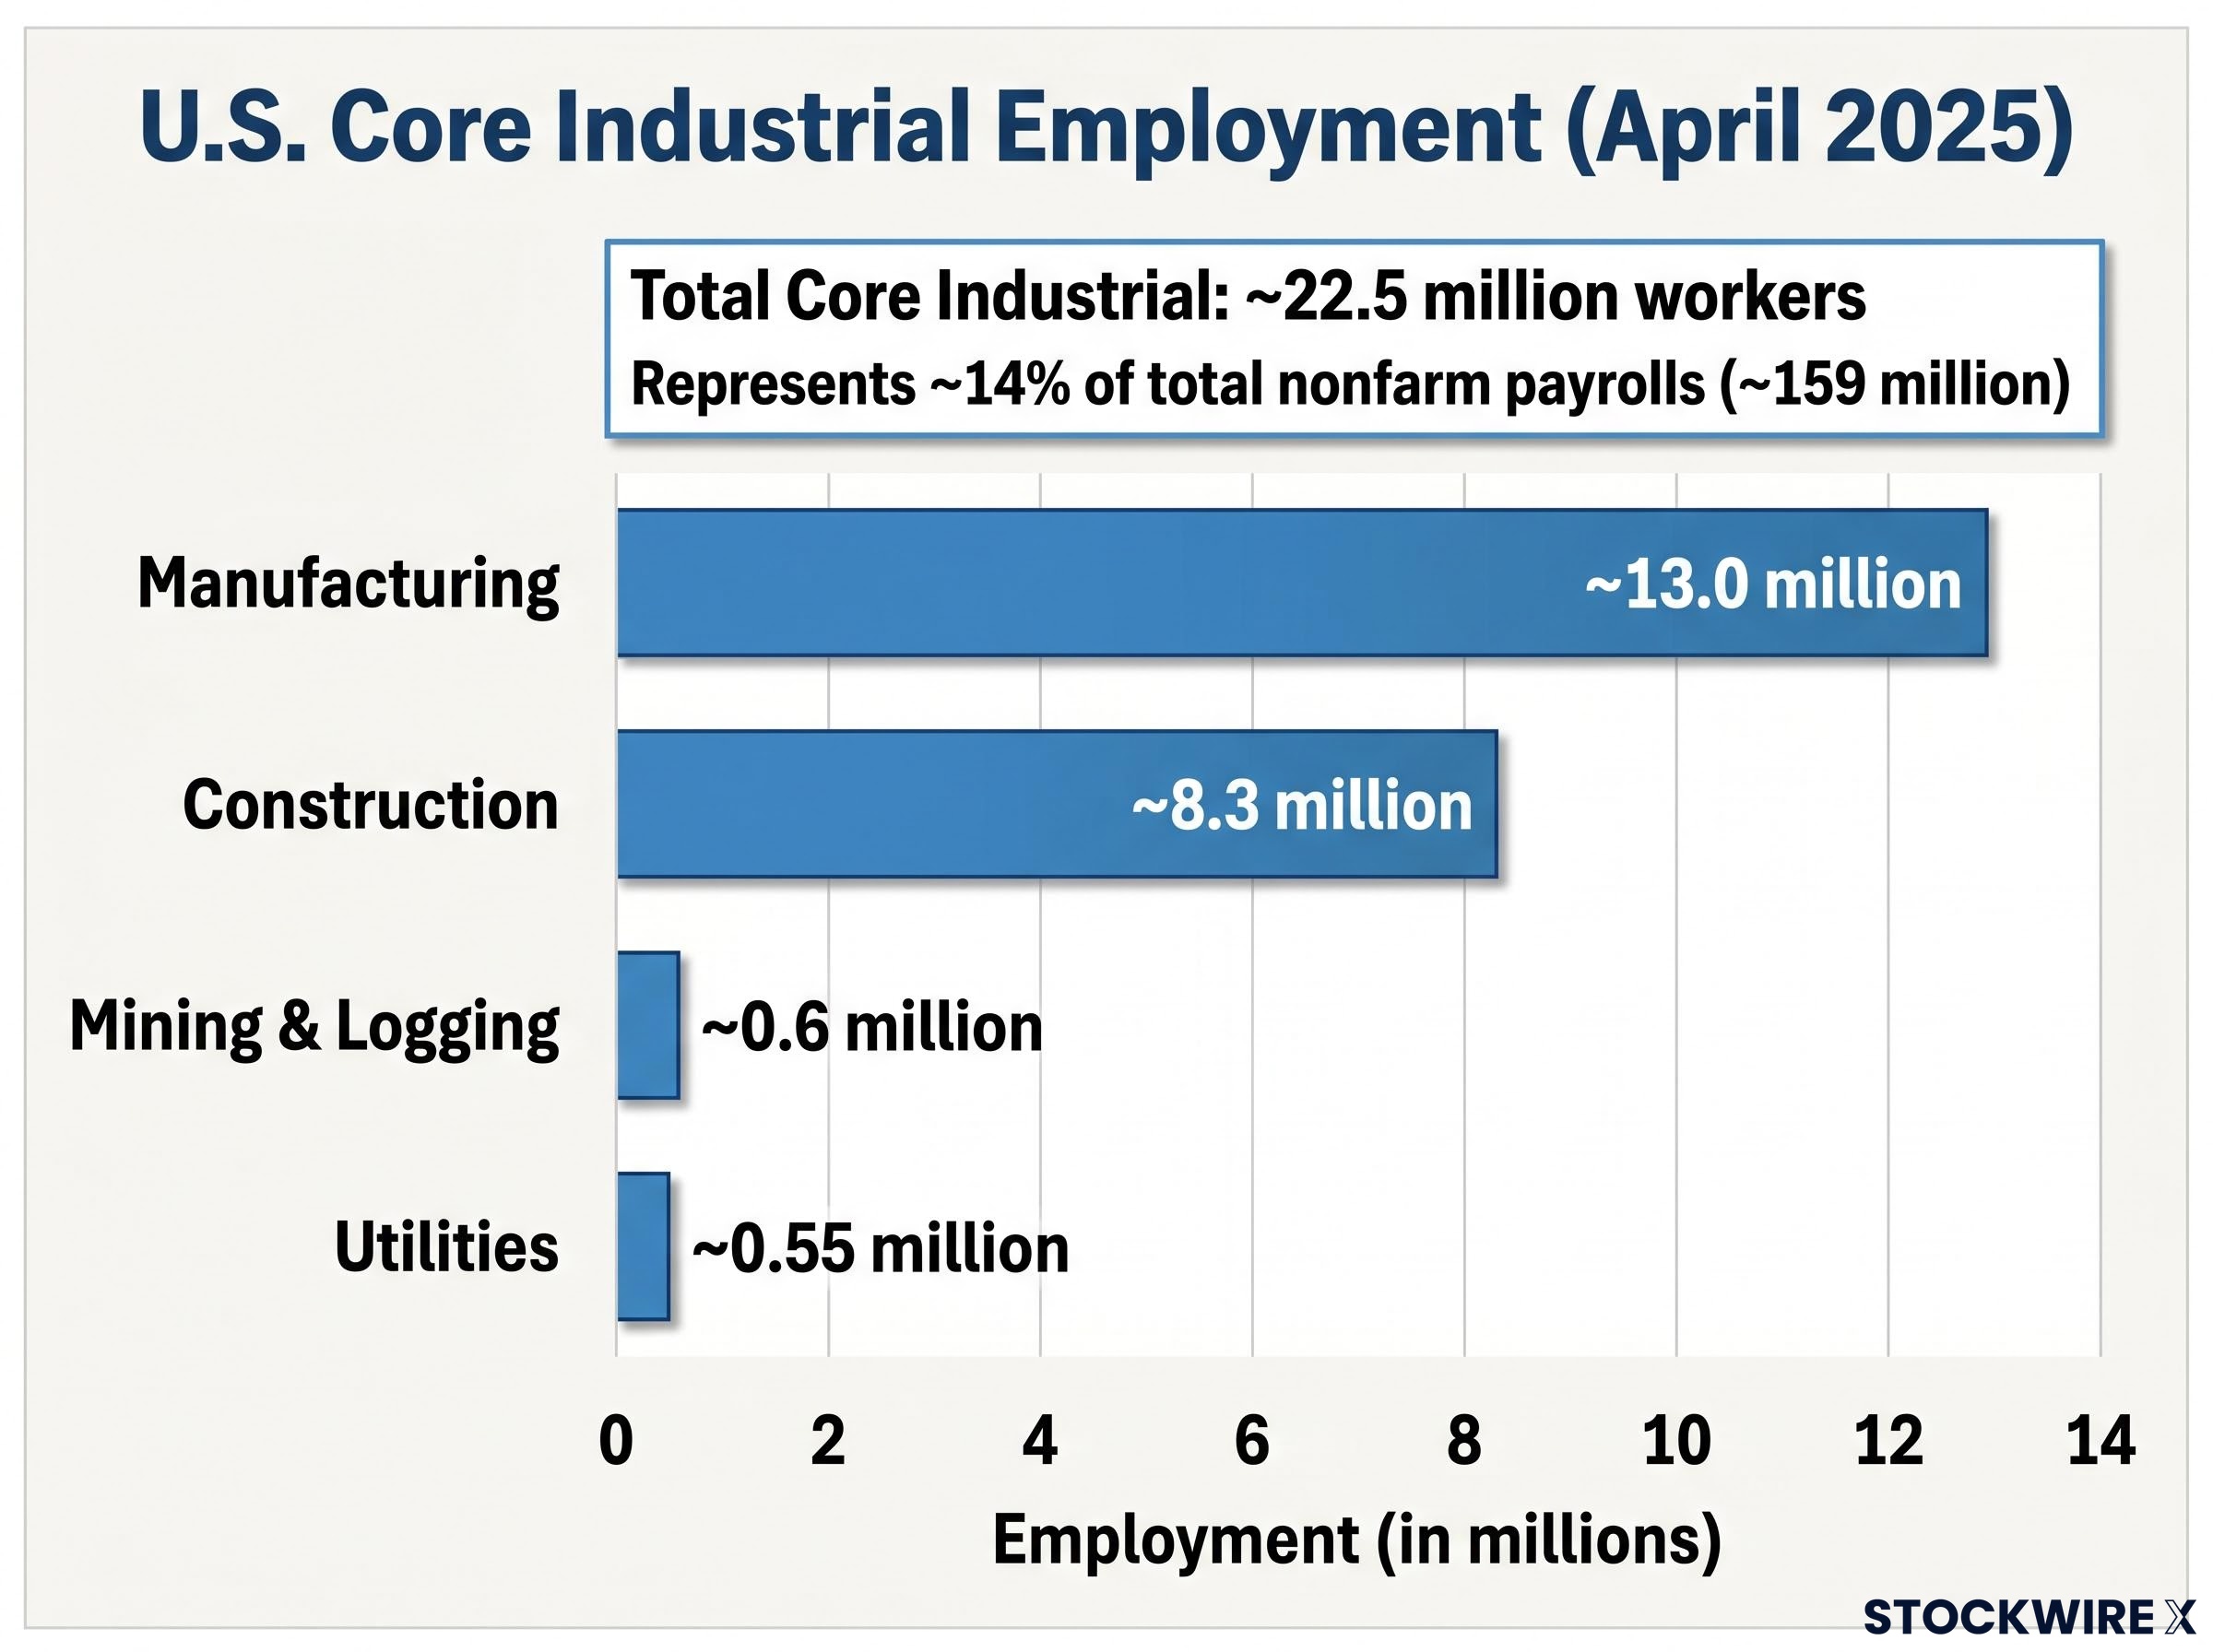
Start with the BLS employment data. The four core industrial categories, as reported in the Current Employment Statistics survey for April 2025, break down as follows:
- Manufacturing: approximately 13.0 million
- Construction: approximately 8.3 million
- Mining and logging: approximately 0.6 million
- Utilities: approximately 0.55 million
Combined, these four categories employed roughly 22.5 million workers. Total nonfarm payrolls stood at approximately 159 million in the same period, placing core industrial employment at approximately 14% of the nonfarm workforce.
That 14% figure, however, is narrower than the numbers some investors encounter elsewhere. The broader goods-producing industries aggregate, which includes transportation, warehousing, and related roles that sit outside the strict four-category BLS grouping, accounts for approximately 18-19% of GDP according to BEA’s preliminary 2024 estimates. The gap between the two figures is not a contradiction; it reflects different measurement boundaries applied to overlapping economic activity.
Total industrial production rose 1.6% year-on-year in April 2025, with manufacturing output up 1.2%, according to the Federal Reserve’s G.17 Industrial Production and Capacity Utilisation release dated 15 May 2025.
That moderate growth rate, led by autos and aerospace, signals continued momentum without overheating. Reuters noted at the time that industrial production “continues to rise at a moderate pace” but “remains below pre-pandemic trend.” For investors who track conflicting employment-share figures across different sources, this framework, distinguishing BLS four-category totals from the broader BEA goods-producing aggregate, provides a consistent interpretive baseline.
Why the industrial sector matters to investors building a diversified portfolio
The sector’s 8.7% S&P 500 weight places it firmly mid-pack. Information technology, communication services, and health care all command larger index shares. A Goldman Sachs U.S. Equity Strategy note, summarised by Bloomberg on 10 February 2025, observed that industrials’ share has “edged higher since 2023 but remains firmly mid-pack.”
Weight alone, however, does not capture the sector’s strategic importance. Morgan Stanley equity strategy commentary, discussed in the Financial Times on 27 January 2025, identified the specific internal drivers behind recent weight gains:
The industrials sector sits firmly in the cyclical camp, meaning its performance compresses during contractions and expands during recoveries; the practical implications of that cyclicality for portfolio construction depend heavily on cyclical vs defensive allocation decisions that shift across each phase of the economic cycle.
- Defence names benefiting from elevated government spending
- Aerospace companies riding a commercial aviation recovery
- Industrial automation firms positioned at the intersection of labour scarcity and productivity investment
These sub-categories gained ground without the multiple expansion seen in mega-cap technology, meaning the weight increase reflects earnings growth rather than valuation inflation.
Industrials as a leading economic indicator
The sector’s portfolio value extends beyond direct returns. Capital goods orders, the Institute for Supply Management (ISM) Manufacturing Purchasing Managers’ Index (PMI), a monthly survey measuring factory activity, and capacity utilisation are standard inputs in economic forecasting. When these indicators shift, they often signal broader market inflection points before equity prices adjust.
The ISM Manufacturing PMI reports capture new orders, production levels, supplier delivery times, inventories, and employment through a monthly survey of purchasing managers, giving investors a forward-looking read on factory conditions before hard output data is published.
Industrial sector performance has historically led broader market moves at cyclical turning points. Investors who dismiss the sector as low-growth miss its dual role: a source of cyclical returns during recoveries and a macro-signalling tool that informs positioning across every other sector.
The structural forces shaping the industrial sector’s next decade
Three forces are converging on the sector simultaneously, and their interaction matters more than any single driver in isolation.
- Automation as the productivity driver. A McKinsey Global Institute report released 23 January 2025 projected that advanced automation and digital twins could raise U.S. manufacturing productivity growth by 1.0-1.5 percentage points per year through 2035, with the largest gains in machinery, transportation equipment, and electronics. Andrew Obin, Bank of America’s multi-industry analyst, stated in a Bloomberg interview on 6 March 2025 that “automation spending is becoming non-discretionary for many industrial customers.” Karen Dynan of the Peterson Institute for International Economics wrote in a February 2025 policy brief that policy should focus on worker training rather than resisting automation, arguing it can offset demographic headwinds and tight labour markets.
- Energy transition as the capital expenditure driver. Mark Zandi, Chief Economist at Moody’s Analytics, wrote in an April 2025 special report that “the build-out of clean energy infrastructure, renewables, grid upgrades, transmission, and energy storage, will be one of the most powerful structural demand drivers for U.S. industrial companies over the next decade.” Power equipment, transformers, industrial controls, and construction services stand as direct beneficiaries of this multi-year spending cycle.
- Reshoring and industrial policy as the capacity driver. A KPMG survey published 30 January 2025 found that over 70% of surveyed U.S. industrial executives plan to increase domestic production capacity over the next three years, citing supply-chain resilience and incentives from the CHIPS Act, Inflation Reduction Act, and infrastructure legislation.
Reshoring and industrial policy have moved from boardroom aspiration to measurable capital commitment, but the trade environment shaping those decisions is itself in flux, with U.S. protectionist measures and retaliatory agreements actively redirecting global supply chains in ways that alter both the pace and geography of domestic capacity expansion.
McKinsey Global Institute projects advanced automation and digital twins could raise U.S. manufacturing productivity growth by 1.0-1.5 percentage points per year through 2035.
These three forces are not independent. Automation investment flows through manufacturing. Energy transition investment flows through construction and utilities. Reshoring flows through all three. The sector’s growth case is structurally layered, not dependent on a single catalyst.
A caveat applies. Susan Helper of the Brookings Institution wrote in March 2025 that policy support is “long term but not guaranteed,” with sustained funding, permitting reform, and workforce development determining whether announced projects translate into permanent capacity. Ellen Zentner, then Chief U.S. Economist at Morgan Stanley, cautioned in January 2025 that “supply-chain diversification, not full on-shoring, is the more realistic scenario.”
The industrial sector as a lens on the whole economy
The sector’s value to an investor lies not solely in its portfolio weight but in its role as an economic infrastructure layer that underpins output across every other sector. Goods-producing industries account for approximately 18-19% of U.S. GDP, a footprint that touches supply chains, employment, and capital formation far beyond what the 8.7% S&P 500 weighting suggests.
The structural drivers covered above reinforce this point. Automation investment concentrates in manufacturing. Energy transition capital flows through construction and utilities. Reshoring policy touches all three sub-sectors simultaneously. Understanding these connections turns sector knowledge into an economic reading framework.
Chad Bown of the Peterson Institute for International Economics stressed in a May 2025 policy brief that long-term competitiveness depends more on innovation, workforce skills, and infrastructure than on trade barriers alone, reinforcing that the sector’s fundamentals are multi-dimensional rather than policy-dependent.
Investors who want to track these dynamics in real time can monitor three specific data releases:
- Federal Reserve G.17 Industrial Production report: measures total output across manufacturing, mining, and utilities on a monthly basis
- ISM Manufacturing PMI: captures factory activity, new orders, and employment trends through a monthly survey of purchasing managers
- U.S. Census Bureau Construction Spending report: tracks the value of new construction put in place across residential, commercial, and public categories
These three releases, read together, provide a consistently updated picture of the sector’s health and, by extension, the trajectory of the broader economy.
For investors ready to translate the structural framework above into portfolio decisions, our dedicated guide to investing in the industrial sector covers the top ETFs including XLI and VIS, the specific cyclical and structural sub-industry distinctions that affect vehicle selection, and the risk considerations that apply across automation, reshoring, and energy transition themes.
This article is for informational purposes only and should not be considered financial advice. Investors should conduct their own research and consult with financial professionals before making investment decisions.