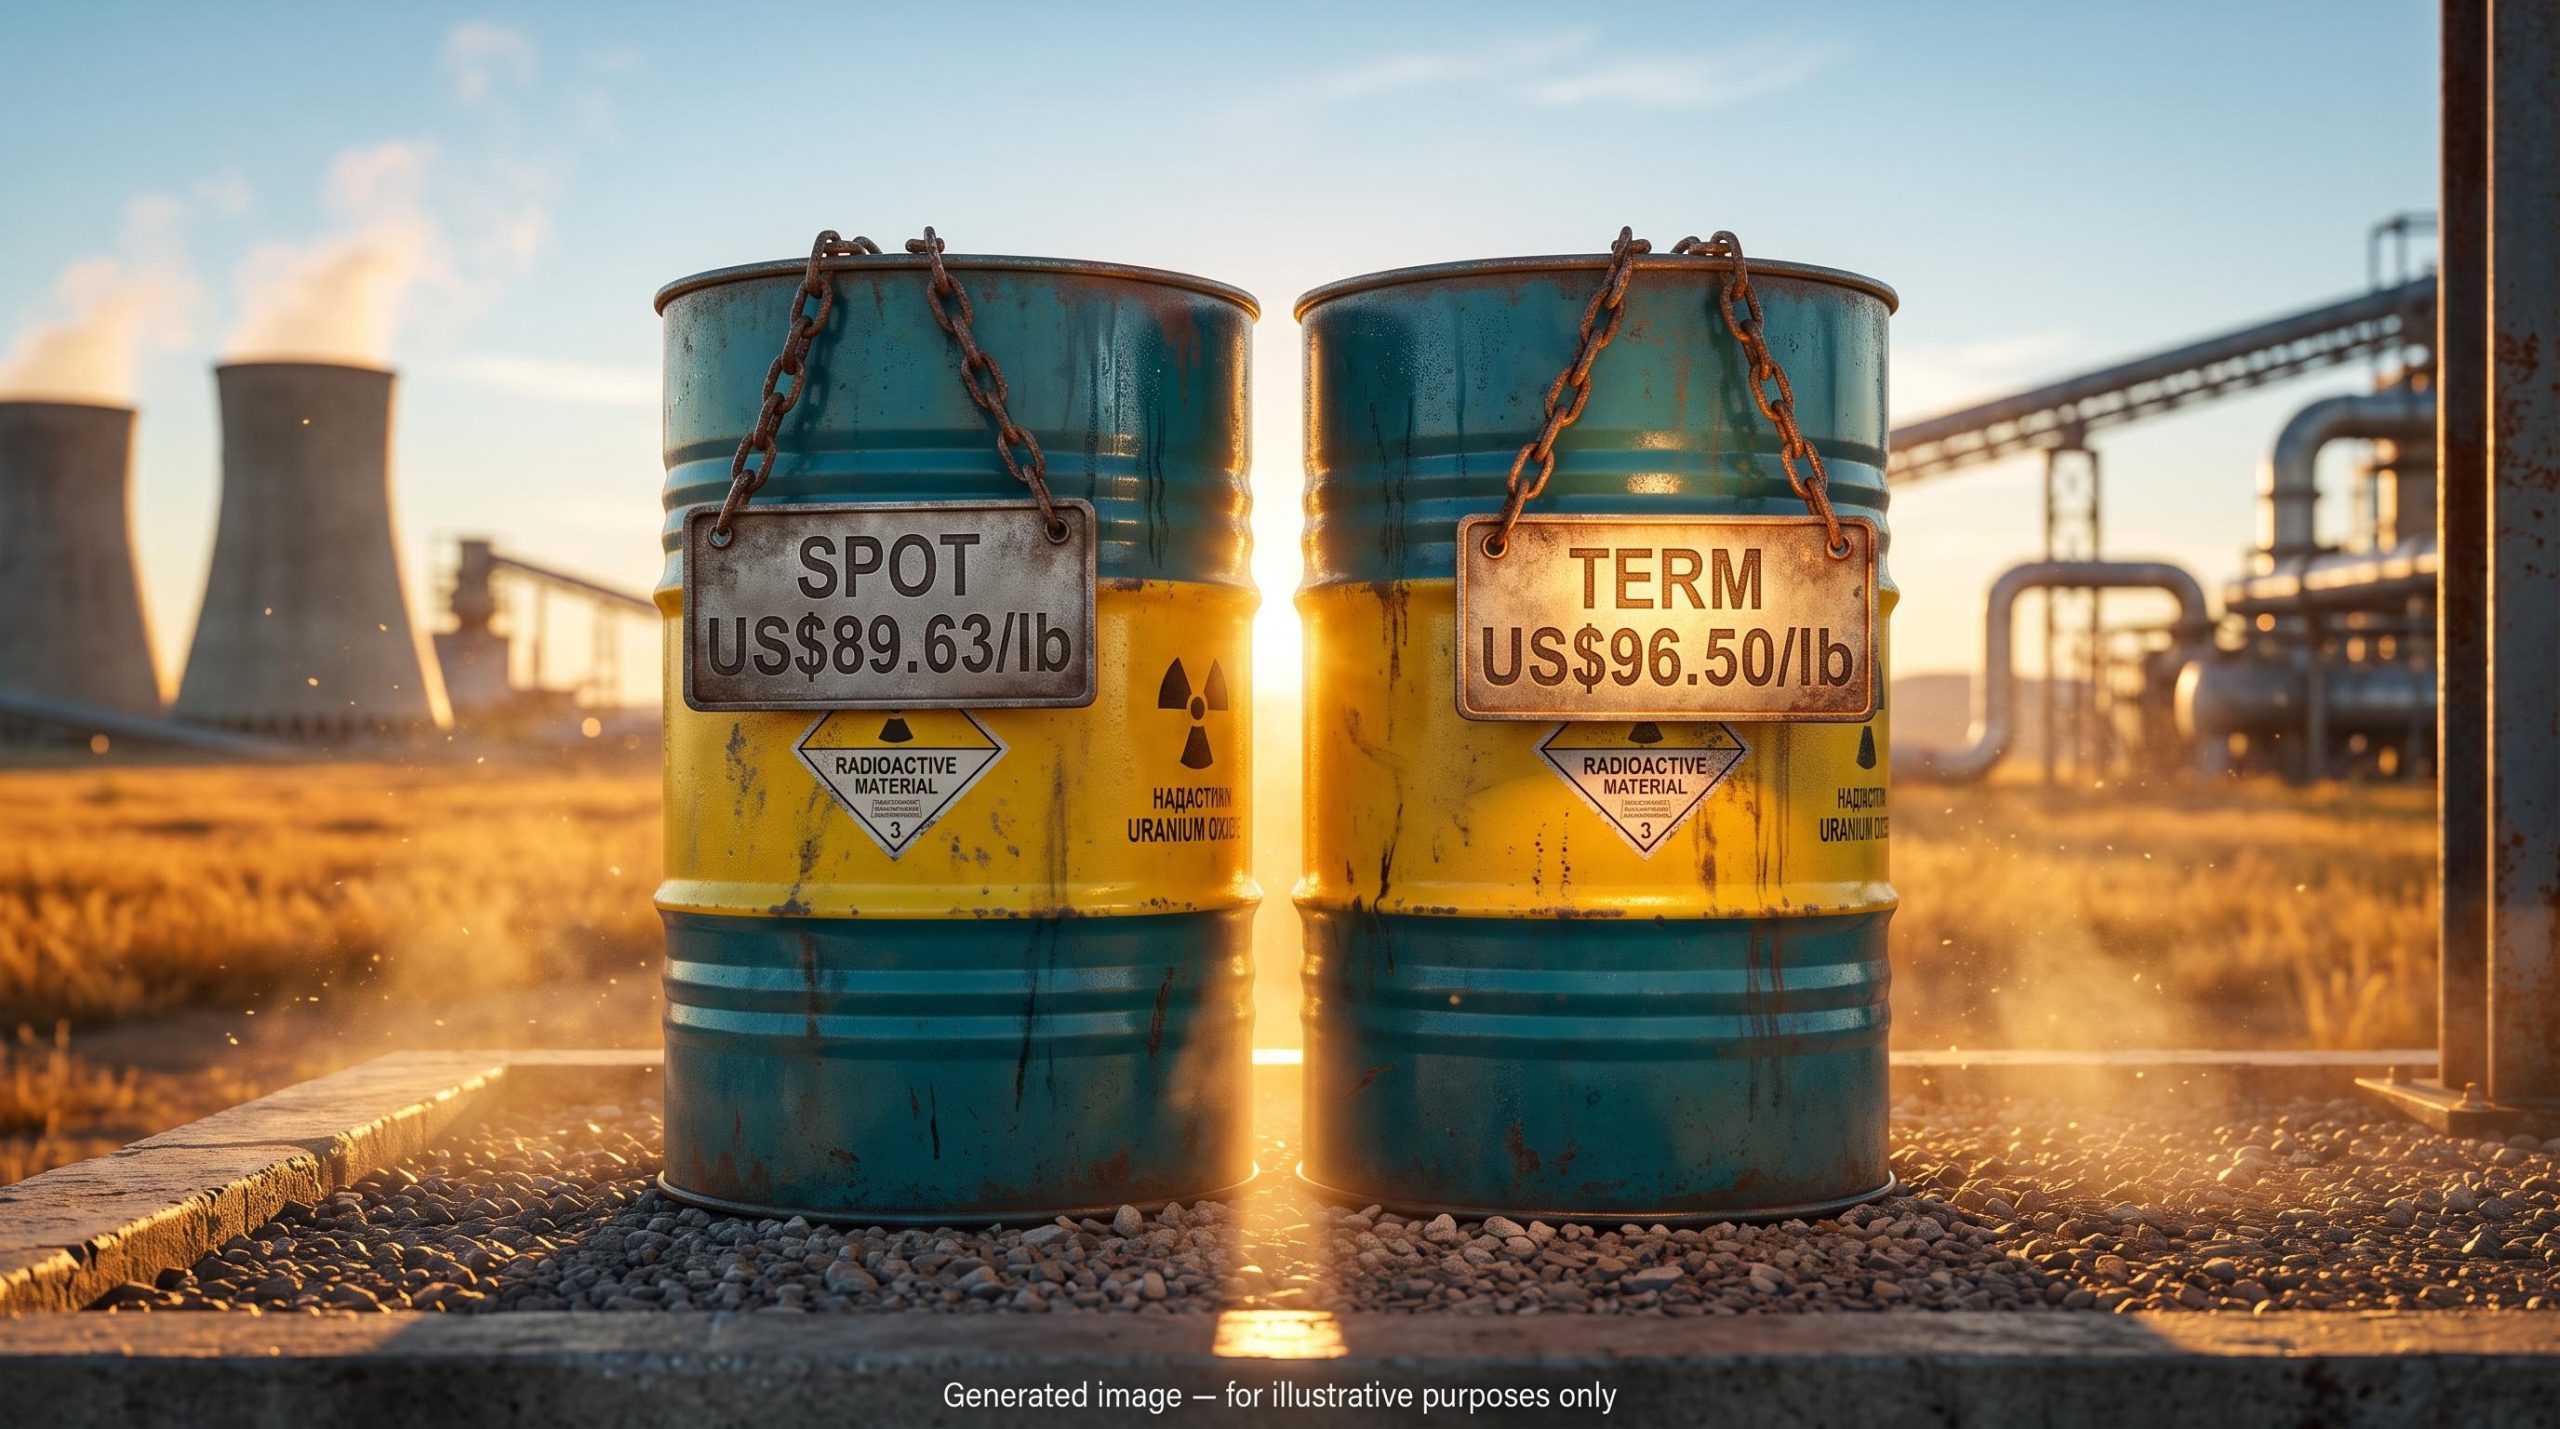
Uranium has two prices, and they rarely agree. At the end of September 2026, spot uranium sat near US$89.63/lb while the long-term contract price stood at US$96.50/lb, the highest term level in roughly 18 years. Most headlines quote the first number. The second one usually tells you more.
The spot and term markets are linked, but they behave very differently. The gap between them has widened, narrowed and even flipped in the past year, and those shifts have often marked turning points worth noticing.
That matters if you are weighing a physical uranium vehicle against a producer stock. Each responds to a different mix of signals, and reading the wrong price can make a rally look stronger, or weaker, than it really is.
Here is the working model: how spot, term and physical trusts feed into each other, what the gap between them has signalled before, why supply has been slow to respond, and what one analyst’s long-term outlook assumes about where prices could head.
Why does uranium have two prices, and which one matters more?
The price you see quoted most often comes from the smaller market. Spot uranium is a surplus-disposal market, meaning it is where sellers offload material they do not need under existing contracts. According to Justin Hune, it trades only about 4-5 million lb per month.
The term market is where utilities do their real buying. A utility signs a contract today for uranium it will receive three or more years from now, so these deals reflect how much fuel reactors actually need.
That makes term the fundamental signal and spot the one most exposed to financial flows. Kazatomprom, the world’s largest producer, said in its first-half 2026 commentary that long-term prices at 18-year highs offer the more reliable read. A competing view holds that spot still flags genuine stress when buyers need material quickly. Both can be true at once.
| Month-end | Spot (US$/lb) | Long-term (US$/lb) | Gap (term minus spot) |
|---|---|---|---|
| 31 Oct 2025 | 80.00 | 85.00 | +5.00 |
| 31 Dec 2025 | 81.55 | 86.50 | +4.95 |
| 31 Jan 2026 | 94.28 | 89.00 | -5.28 (spot premium) |
| 31 Mar 2026 | 84.25 | 91.50 | +7.25 |
| 30 Jun 2026 | 85.00 | 95.50 | +10.50 |
| 30 Sep 2026 | 89.63 | 96.50 | +6.87 |
These figures are Cameco’s averages of month-end UxC and TradeTech prices. TradeTech on its own printed US$97.00/lb for long-term at 30 September 2026, and the small difference comes from how each source averages its data. The spot figure is also published as a contract-for-difference reference, a price used to settle financial bets, rather than a price cleared on an exchange.
How the long-term price is built
UxC defines its long-term price around contracts with delivery 36 months or more out, price escalation from the current quarter, and quantity flexibility of up to plus or minus 10%. Hune says most term contracts are market-referenced with floors of about $70-80 and ceilings near $150. The published price is updated monthly and reflects the lowest offer of the previous 30 days.
TradeTech’s price methodology spells out which contract terms qualify for its long-term indicator, which helps explain why its US$97.00/lb print can sit slightly above averaged figures, and what you should check before comparing sources.
Stability as a signal Kazatomprom has described long-term indicators as “incredibly stable” in the mid-to-high $90s.
So when spot jumps, check term first. If term has not moved, the spike may reflect money flowing in rather than utilities needing more fuel.
When big ASX news breaks, our subscribers know first
How do carry trades and physical vehicles link the two markets?
If spot is so thin, what moves it? Often, it is the physical uranium trusts. Their share prices can switch a large source of spot buying on or off.
The two main vehicles are the Sprott Physical Uranium Trust (SPUT) and Yellow Cake plc. Both hold physical uranium oxide (U₃O₈) and trade against their net asset value (NAV), which is the market value of the uranium they hold per share or unit.
The loop works like this:
- The trust’s units trade at a premium to NAV, meaning buyers pay more than the uranium is worth.
- The trust issues new units through an at-the-market (ATM) programme, which sells shares gradually into the market.
- It uses that cash to buy uranium in the spot market.
- That buying supports the spot price.
- When the units fall to a discount, issuing new units would destroy value, so the buying stops.
Yellow Cake has an added channel: an arrangement to buy $100 million of uranium a year from Kazatomprom. Hune says that deal ends next year, though its current status has not been independently confirmed.
| Vehicle | Discount to NAV | Holdings and total NAV | Data date |
|---|---|---|---|
| SPUT | 9.95% | 81,697,348 lb; about US$7.41B | 7 October 2026 |
| Yellow Cake | 2.5% | 21.7 million lb; about US$1.41B | 21 May 2026 (no later figure found) |
What a NAV discount does to the trade
SPUT’s NAV stood at US$21.54 per unit on 7 October 2026. Back in May 2026, at a 5.5% discount, its ATM programme was already closed and systematic buying suspended. The discount has nearly doubled since.
Hune notes that discounts can swing to 15-16% in risk-off periods, and that Yellow Cake usually trades at a wider discount than Sprott. When you see that discount widening, a key spot buyer has gone quiet. Soft spot prices may then reflect missing financial demand rather than weak fundamentals.
What have disconnects between spot and term signalled before?
Once you know spot can drift away from term for financial reasons, the gap itself becomes something to watch. Hune describes a pattern:
- Possible buy signal: spot falls well below a flat term price. Hune says equities have later doubled or tripled after such disconnects.
- Possible sell signal: spot spikes while term stays flat, suggesting froth rather than fresh utility demand.
In one earlier episode Hune cites, term sat near $80 while spot slid to about $64. Utilities were still contracting at stable prices, while spot sellers had few takers. That is the shape of the buy pattern.
January 2026 showed the opposite shape.
When spot ran ahead Spot reached US$94.28 at end-January 2026, US$5.28 above term at US$89.00. By end-March, spot had fallen back to US$84.25 while term climbed to US$91.50.
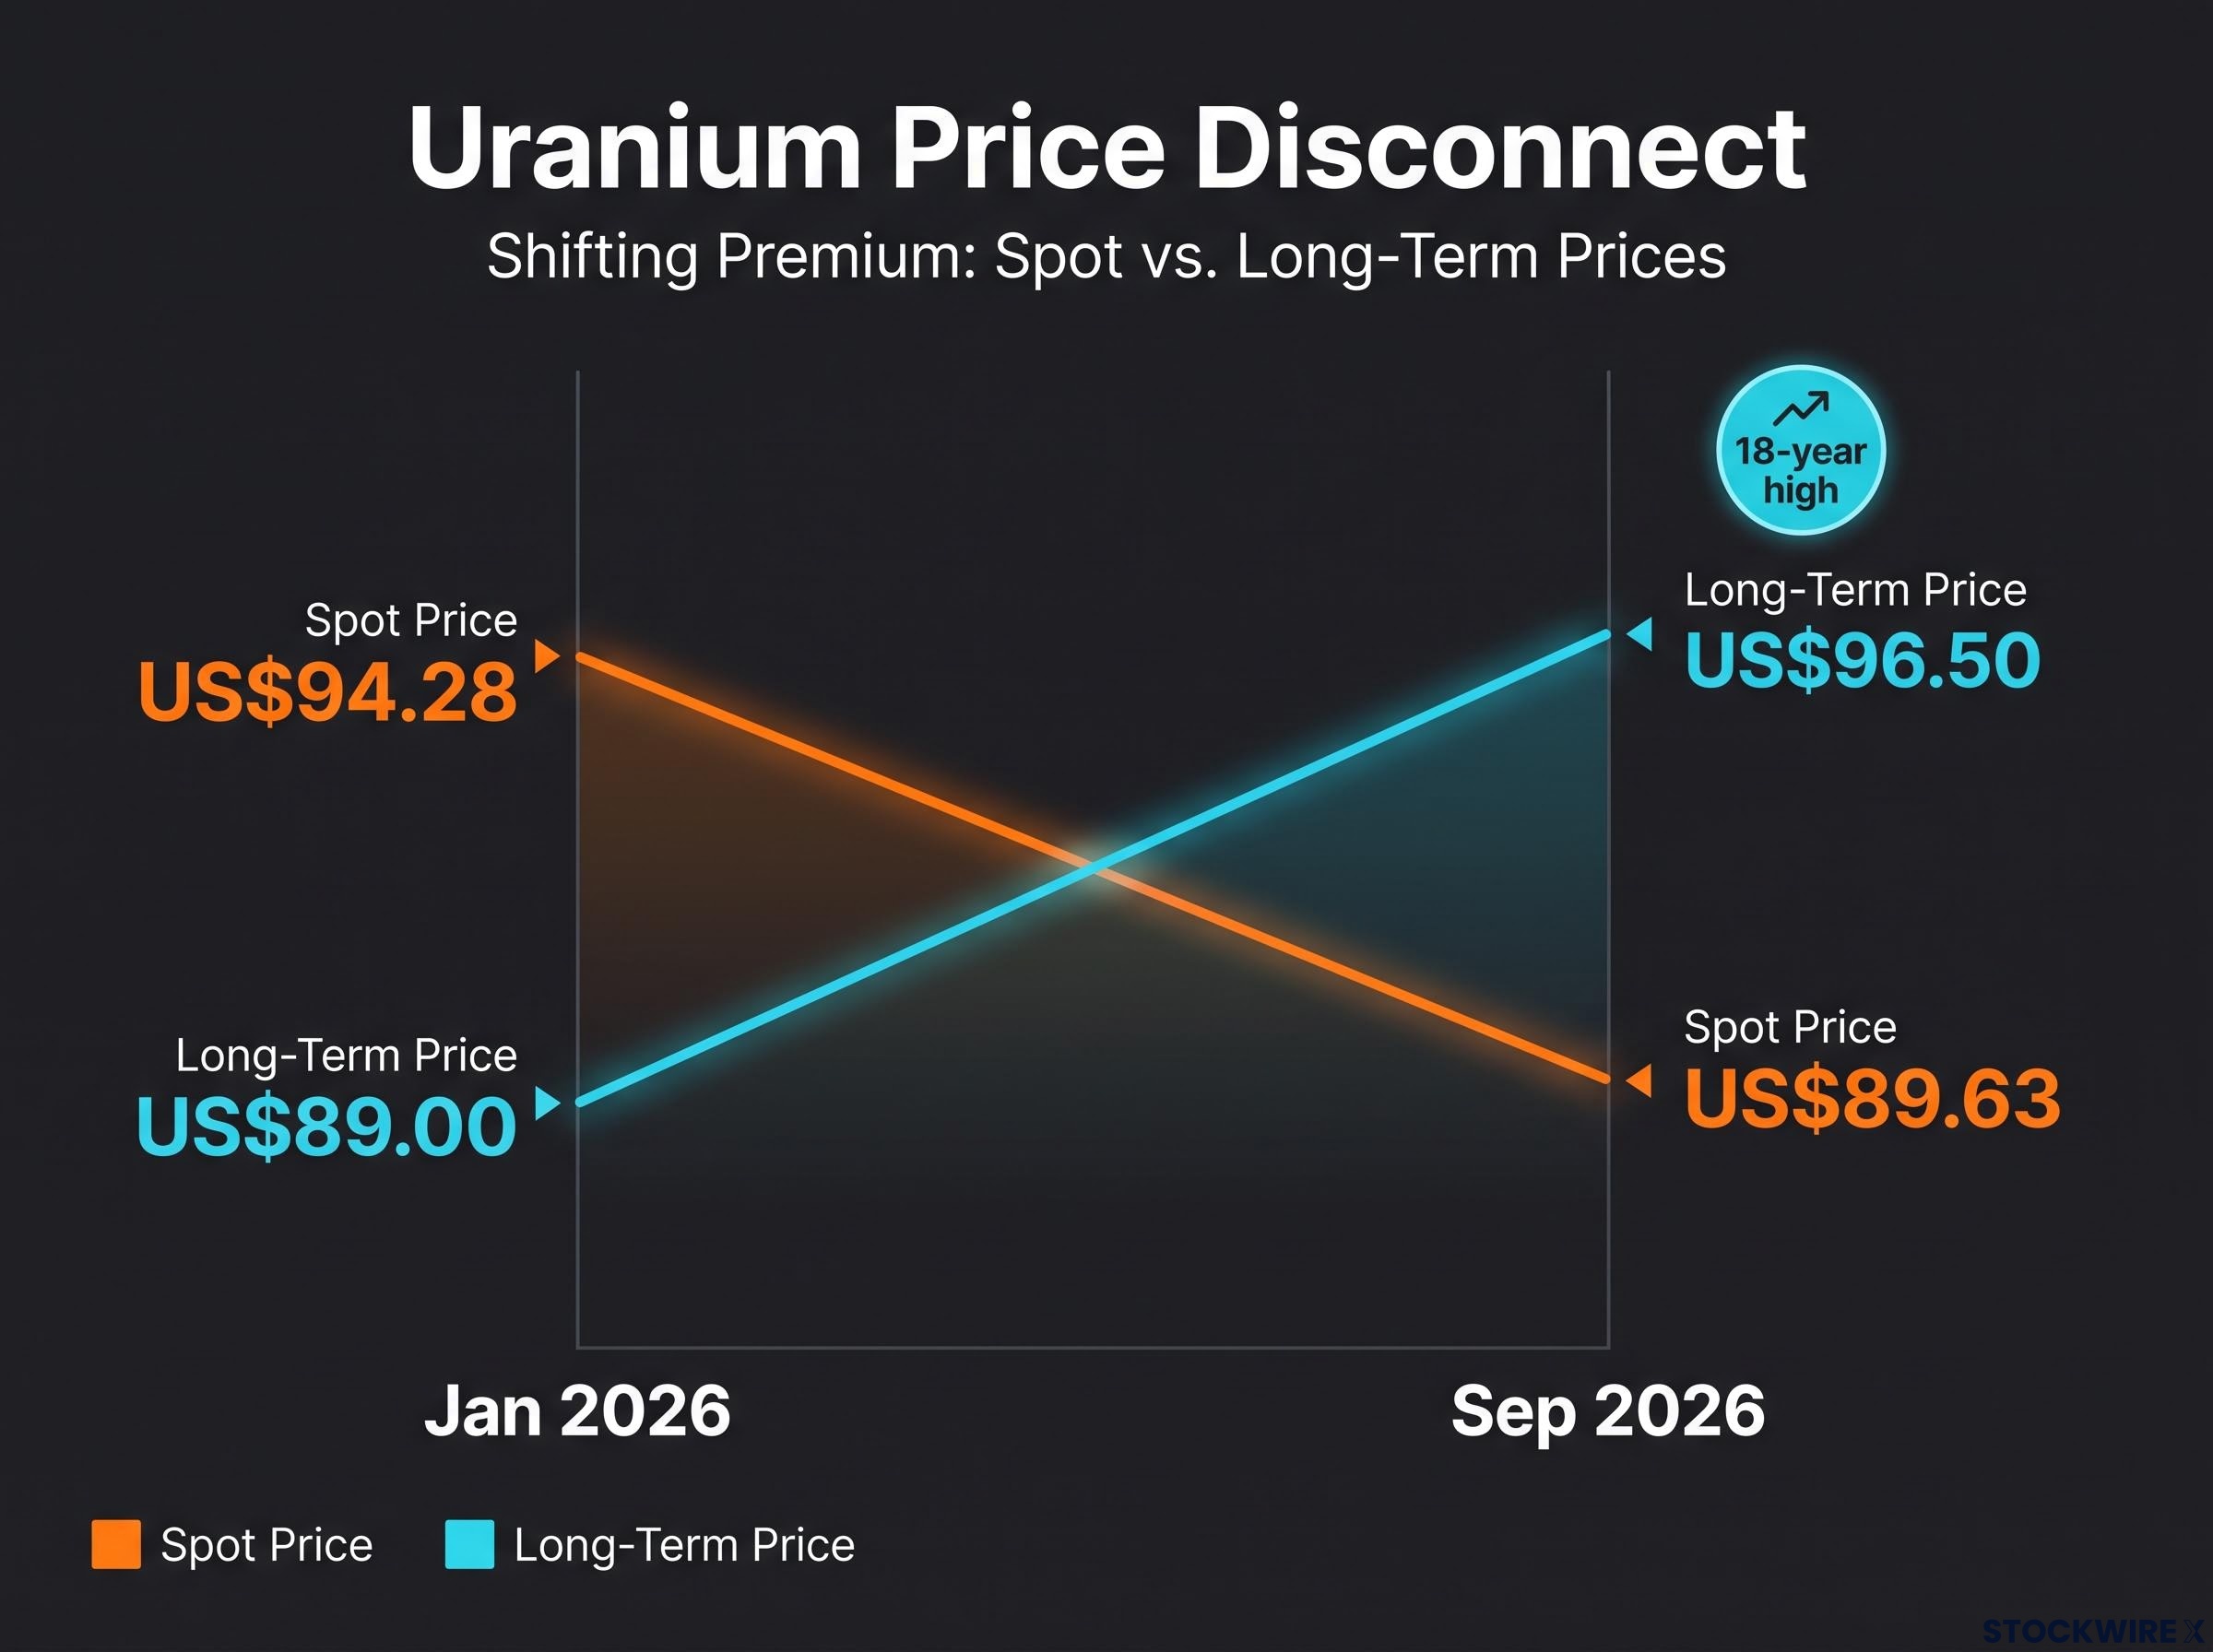
Term kept rising through that retreat. TradeTech’s long-term indicator hit US$93 by end-March, up US$6.50 from December 2025 and an 18-year high.
Treat this as one analyst’s observation, not a rule. The gap works best as a cross-check on sentiment, and it is most useful when term holds steady. If term itself starts falling, the signal loses its anchor.
Why has the supply response been slow, and what are the bottlenecks?
Higher prices should bring more supply. They have, but less of it, and more slowly, than you might expect.
Hune says global mine supply has risen from about 120 million lb to more than 170 million lb since 2021, mostly through restarts of existing mines, while the price roughly tripled. Kazatomprom, meanwhile, has guided 2026 nominal production down from 32,777 tU (about 85 million lb) to 29,697 tU (about 77 million lb), a cut of roughly 10%. It is lifting output incrementally rather than chasing price spikes. A recent global production figure from the World Nuclear Association (WNA) or International Energy Agency (IEA) could not be found.
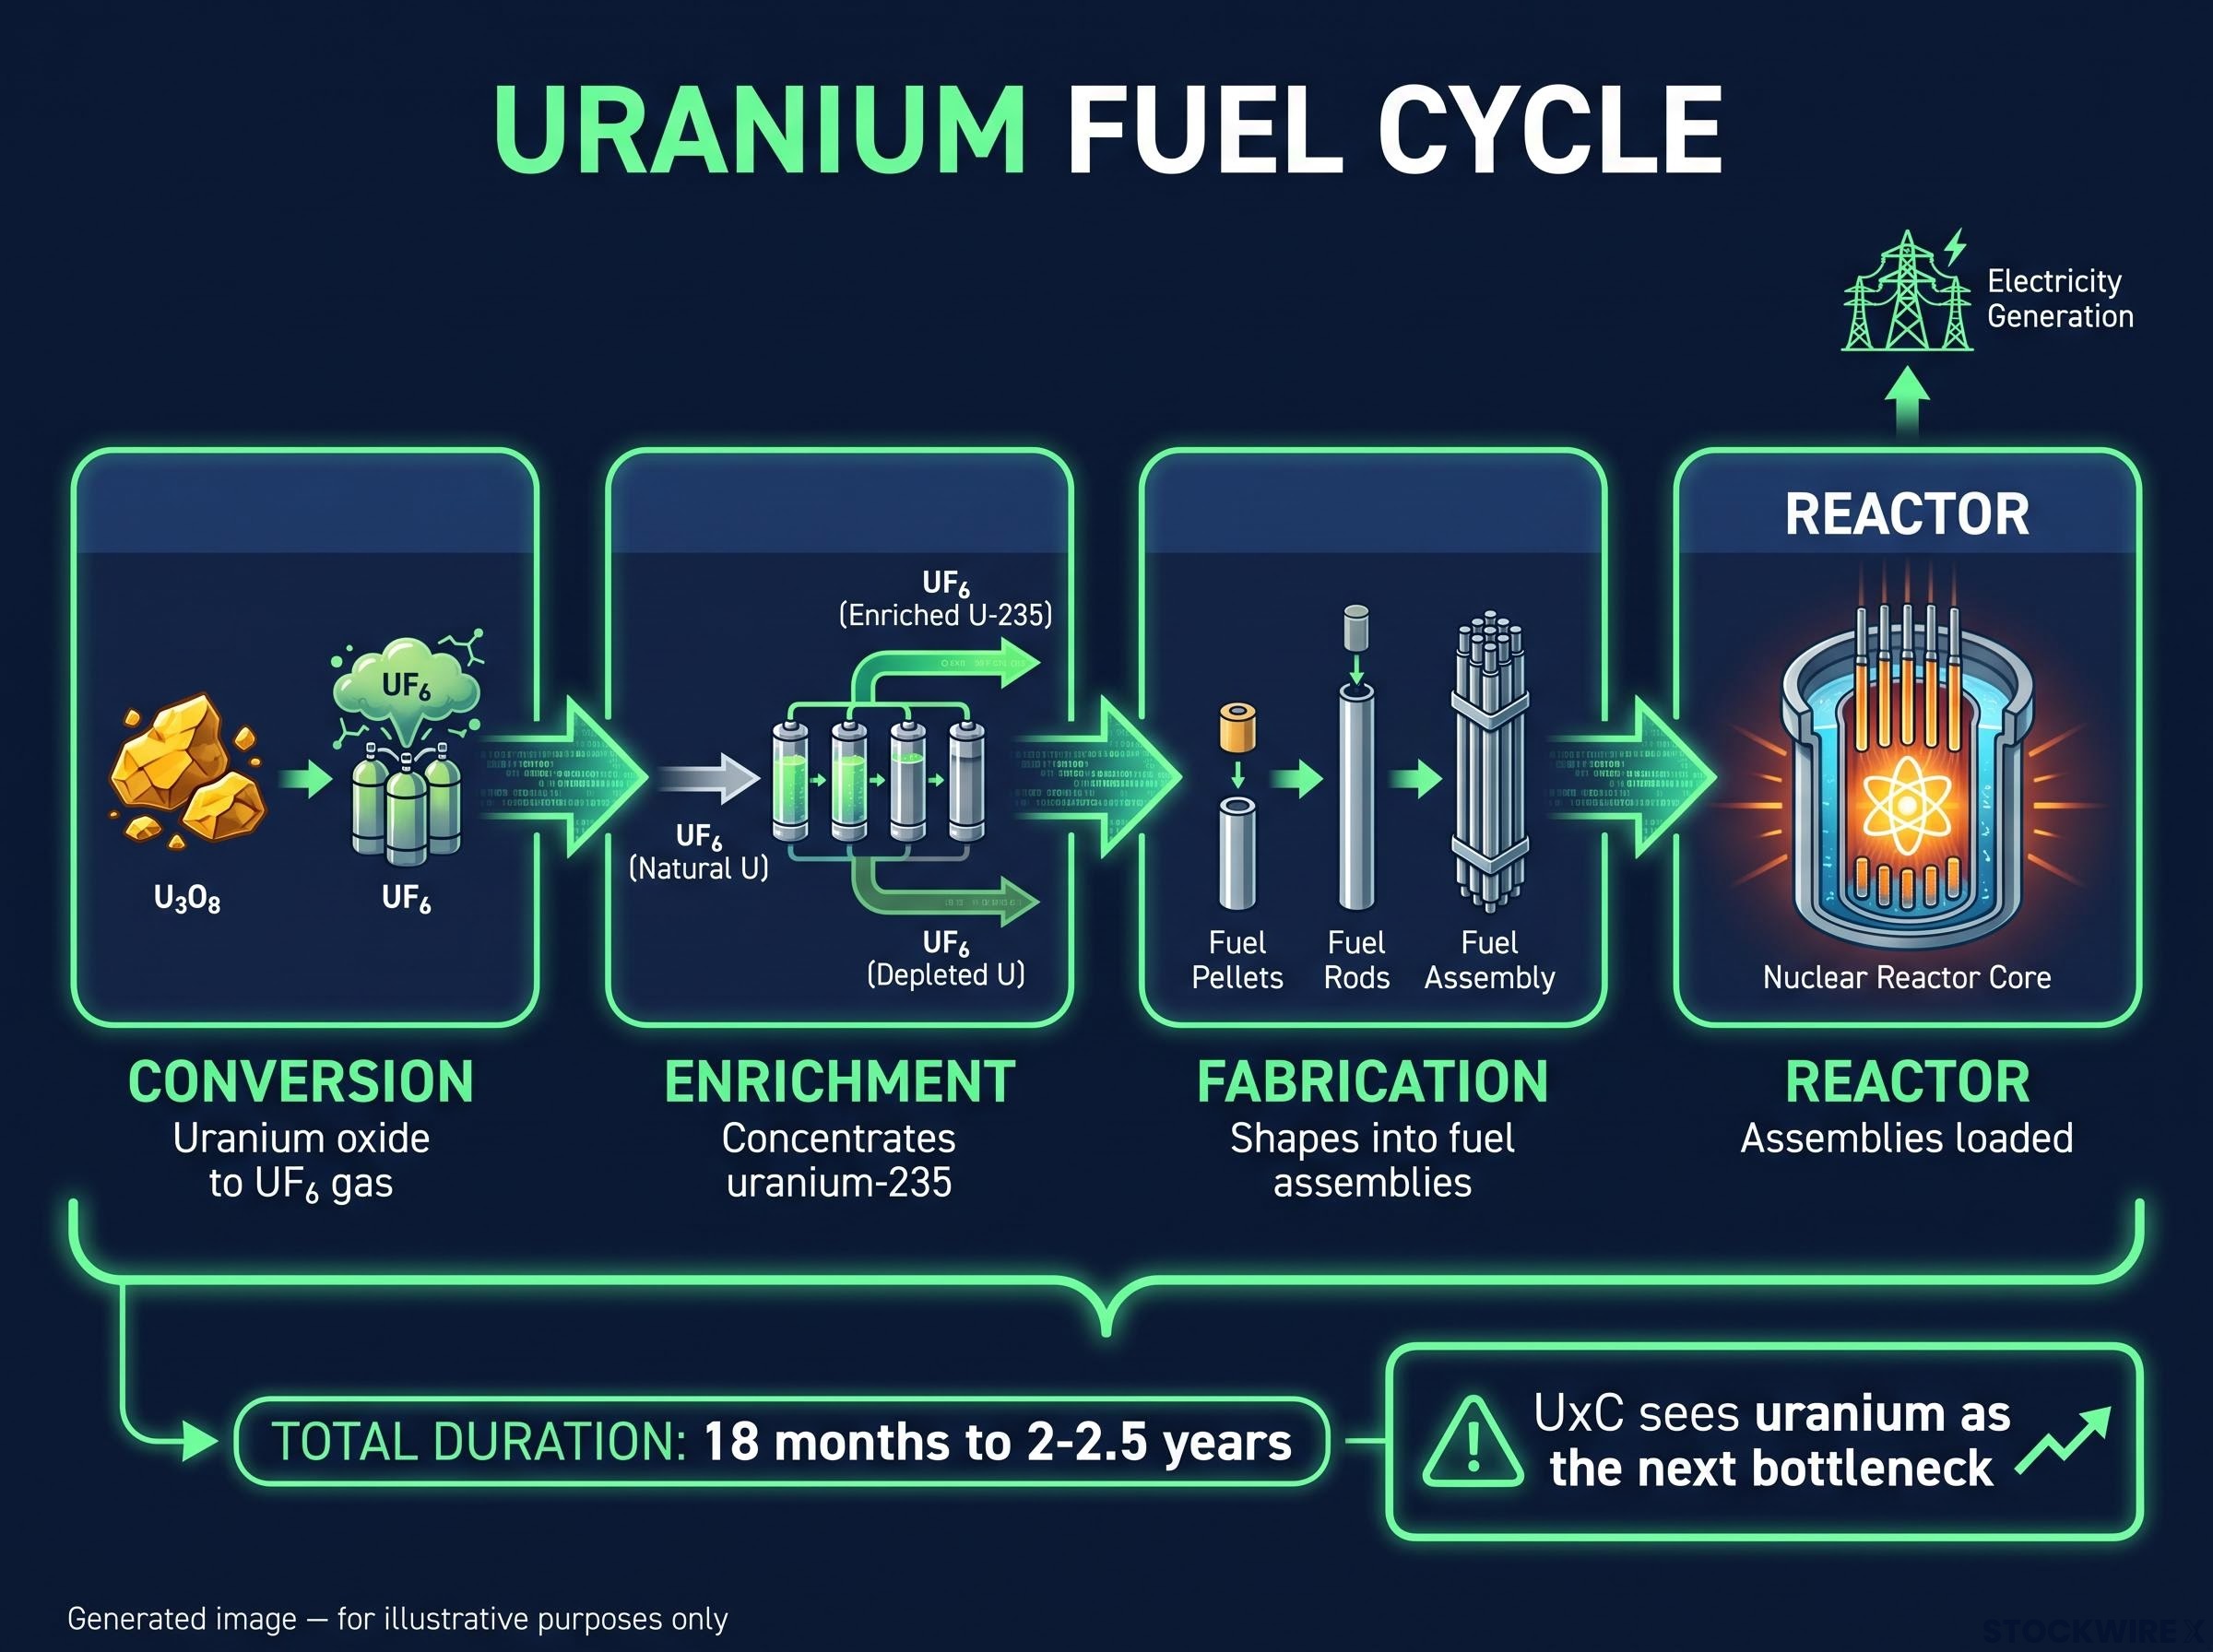
The fuel cycle adds another delay. Uranium cannot go straight into a reactor:
- Conversion turns uranium oxide into a gas called UF₆.
- Enrichment raises the concentration of the fissile isotope uranium-235.
- Fabrication shapes the material into fuel assemblies.
- The assemblies are loaded into the reactor.
That process takes at least 18 months and usually 2-2.5 years. Conversion and enrichment prices are near all-time highs after Russia-related disruption, though no verified current benchmarks were found. UxC sees uranium as the next bottleneck, because locking in conversion and enrichment forces utilities to buy uranium afterwards. Utilities rarely hedge, buy as needed under oversight limits, and inventories have shrunk since the 2010s.
New enrichment capacity is one way the conversion and enrichment squeeze could ease over time, and Cameco has agreed to buy all planned output from the Paducah laser enrichment plant, though the project still awaits a final investment decision.
Incentive price versus the last marginal pound
The incentive price is the level needed to justify building a new mine. New-mine final investment decisions remain limited, which suggests that price may sit higher than it looks once jurisdiction, financing and permitting risk are counted.
Hune’s view on price setting Price will be set by the last marginal pound, not the incentive price.
For you, the takeaway is simple. An 18-year-high price may still fall short of what triggers new mines, so supply could lag demand for longer than you expect. That favours producers with existing low-cost capacity.
Physical uranium or producers, and where could prices go?
With the mechanics in place, the choice between vehicles comes down to which risks you would rather hold.
| Factor | Physical vehicles | Producer equities |
|---|---|---|
| Main risk | NAV discounts and dependence on ATM financing | Operational, financing and geopolitical risk |
| Main advantage | No mine or jurisdiction risk | Production growth and low-cost reserves |
| Spot exposure | Direct, through the uranium held | Indirect, mixed with contract pricing |
| Behaviour at a discount | Spot buying switches off | Not applicable; value driven by operations |
Producers can create value through growth even if prices plateau, but they face permitting delays, cost overruns and resource nationalism. Physical trusts avoid those problems, yet discounts add mark-to-market volatility and the vehicles depend on public-market appetite.
On demand, Hune sees life extensions of existing reactors as the main tailwind, with nuclear correlated with, but not reliant on, AI. NexGen Energy says hyperscalers have expressed interest in offtake from its Rook I project, and Hune expects a major hyperscaler fuel headline within 18-24 months. Independent WNA or IEA commentary on hyperscaler offtake was not found, so treat this as an unproven option.
You can see early evidence of this demand in hyperscaler nuclear contracts, such as Google’s 22-year agreement with Fortum at a reported 60% premium to forward market rates, which shows how far technology buyers will pay for firm power.
One analyst’s outlook, and what it assumes
Justin Hune’s forecast Hune considers physical vehicles the best risk-reward way into uranium, believes spot has a firm floor barring a nuclear accident or market meltdown, and forecasts prices of at least $150-200/lb over the next five to seven years, “probably higher.”
As simple arithmetic, not a forecast, moving from US$96.50 to $150 is about 55%, and to $200 about 107%. That case depends on no accident, a continued supply lag and steady utility demand. Russian export restrictions, tariff-related volatility and the way vehicles amplified moves in 2007 and 2021 all cut both ways.
Past performance does not guarantee future results. Financial projections are subject to market conditions and various risk factors, and these statements are speculative and subject to change.
Reading the signals before the next move
Three observable signals do most of the work. First, the gap between spot and term: a spot spike over a flat term price deserves scepticism. Second, the NAV discounts at SPUT and Yellow Cake, which tell you whether a major spot buyer is active or idle. Third, the stability of term prices, which reflects real utility contracting.
The $150-200/lb outlook is one analyst’s view, built on stated conditions. Discounts and operational risks are real whichever vehicle you choose.
Over the coming months, watch whether term holds in the mid-to-high $90s, whether trust discounts narrow enough to restart buying, what happens to Yellow Cake’s Kazatomprom arrangement, and whether any hyperscaler fuel deal materialises.
This article is for informational purposes only and should not be considered financial advice. Investors should conduct their own research and consult with financial professionals before making investment decisions.