
US banks have gained about 12.5% so far this year, according to Mumu’s chief market strategist on the Daily Moo podcast. Australian bank shares have managed about 1.2% over the same stretch. Other snapshots put the local sector in the red.
So are the Big Four really the safe choice they are usually taken to be?
Results season has made that question harder to ignore. NAB reported last week and ANZ reported yesterday. Westpac has also reported in recent days. Each result tested whether high dividends and franking credits are enough to justify paying a premium for banks that are growing slowly.
The answer affects what you hold. Choosing bank income over growth elsewhere could leave you with reliable dividends, or with a capital loss that wipes out several years of them. This analysis sets out the forces behind the gap and the signals that would show you whether it is starting to close.
Why have Australian bank shares trailed US banks despite their premium ratings?
The performance gap
The headline gap depends on which snapshot you use. The Mumu strategist cites +12.5% for US banks against +1.2% for Australian banks. A mid-October snapshot showed US banks up about 11.7% and Australian banks down about 3.5%. The two sources disagree on the size of the gap, but both show it clearly.
The price action this year shows how quickly the local sector has turned. The Big Four fell about 10% in the August mortgage sell-off, according to Reuters Breakingviews on 25 August 2026. They then rallied about 8.5% in October, when some investors treated them as a safe place to wait out a global tech sell-off.
Results then stopped that rally. NAB fell 5.37% to $38.96 on 5 November, on a day when the ASX 200 rose 2.61%. ANZ dropped 3.20% to $39.05 yesterday.
Brokers had flagged that forward guidance on margins and bad debts, rather than headline profit beats, would drive share price reactions, a view that the post-result falls at NAB and ANZ appear to bear out.
Why the premium existed
The second half of the paradox is valuation. A price-to-earnings (P/E) ratio is the share price divided by earnings per share. A price-to-book (P/B) ratio compares the share price with the bank’s net assets per share. For banks, P/B is often the more telling measure, because a bank’s balance sheet is what generates its earnings.
The table below sets out the reported multiples. The P/E figures mix forward and trailing bases, so they are not like-for-like comparisons.
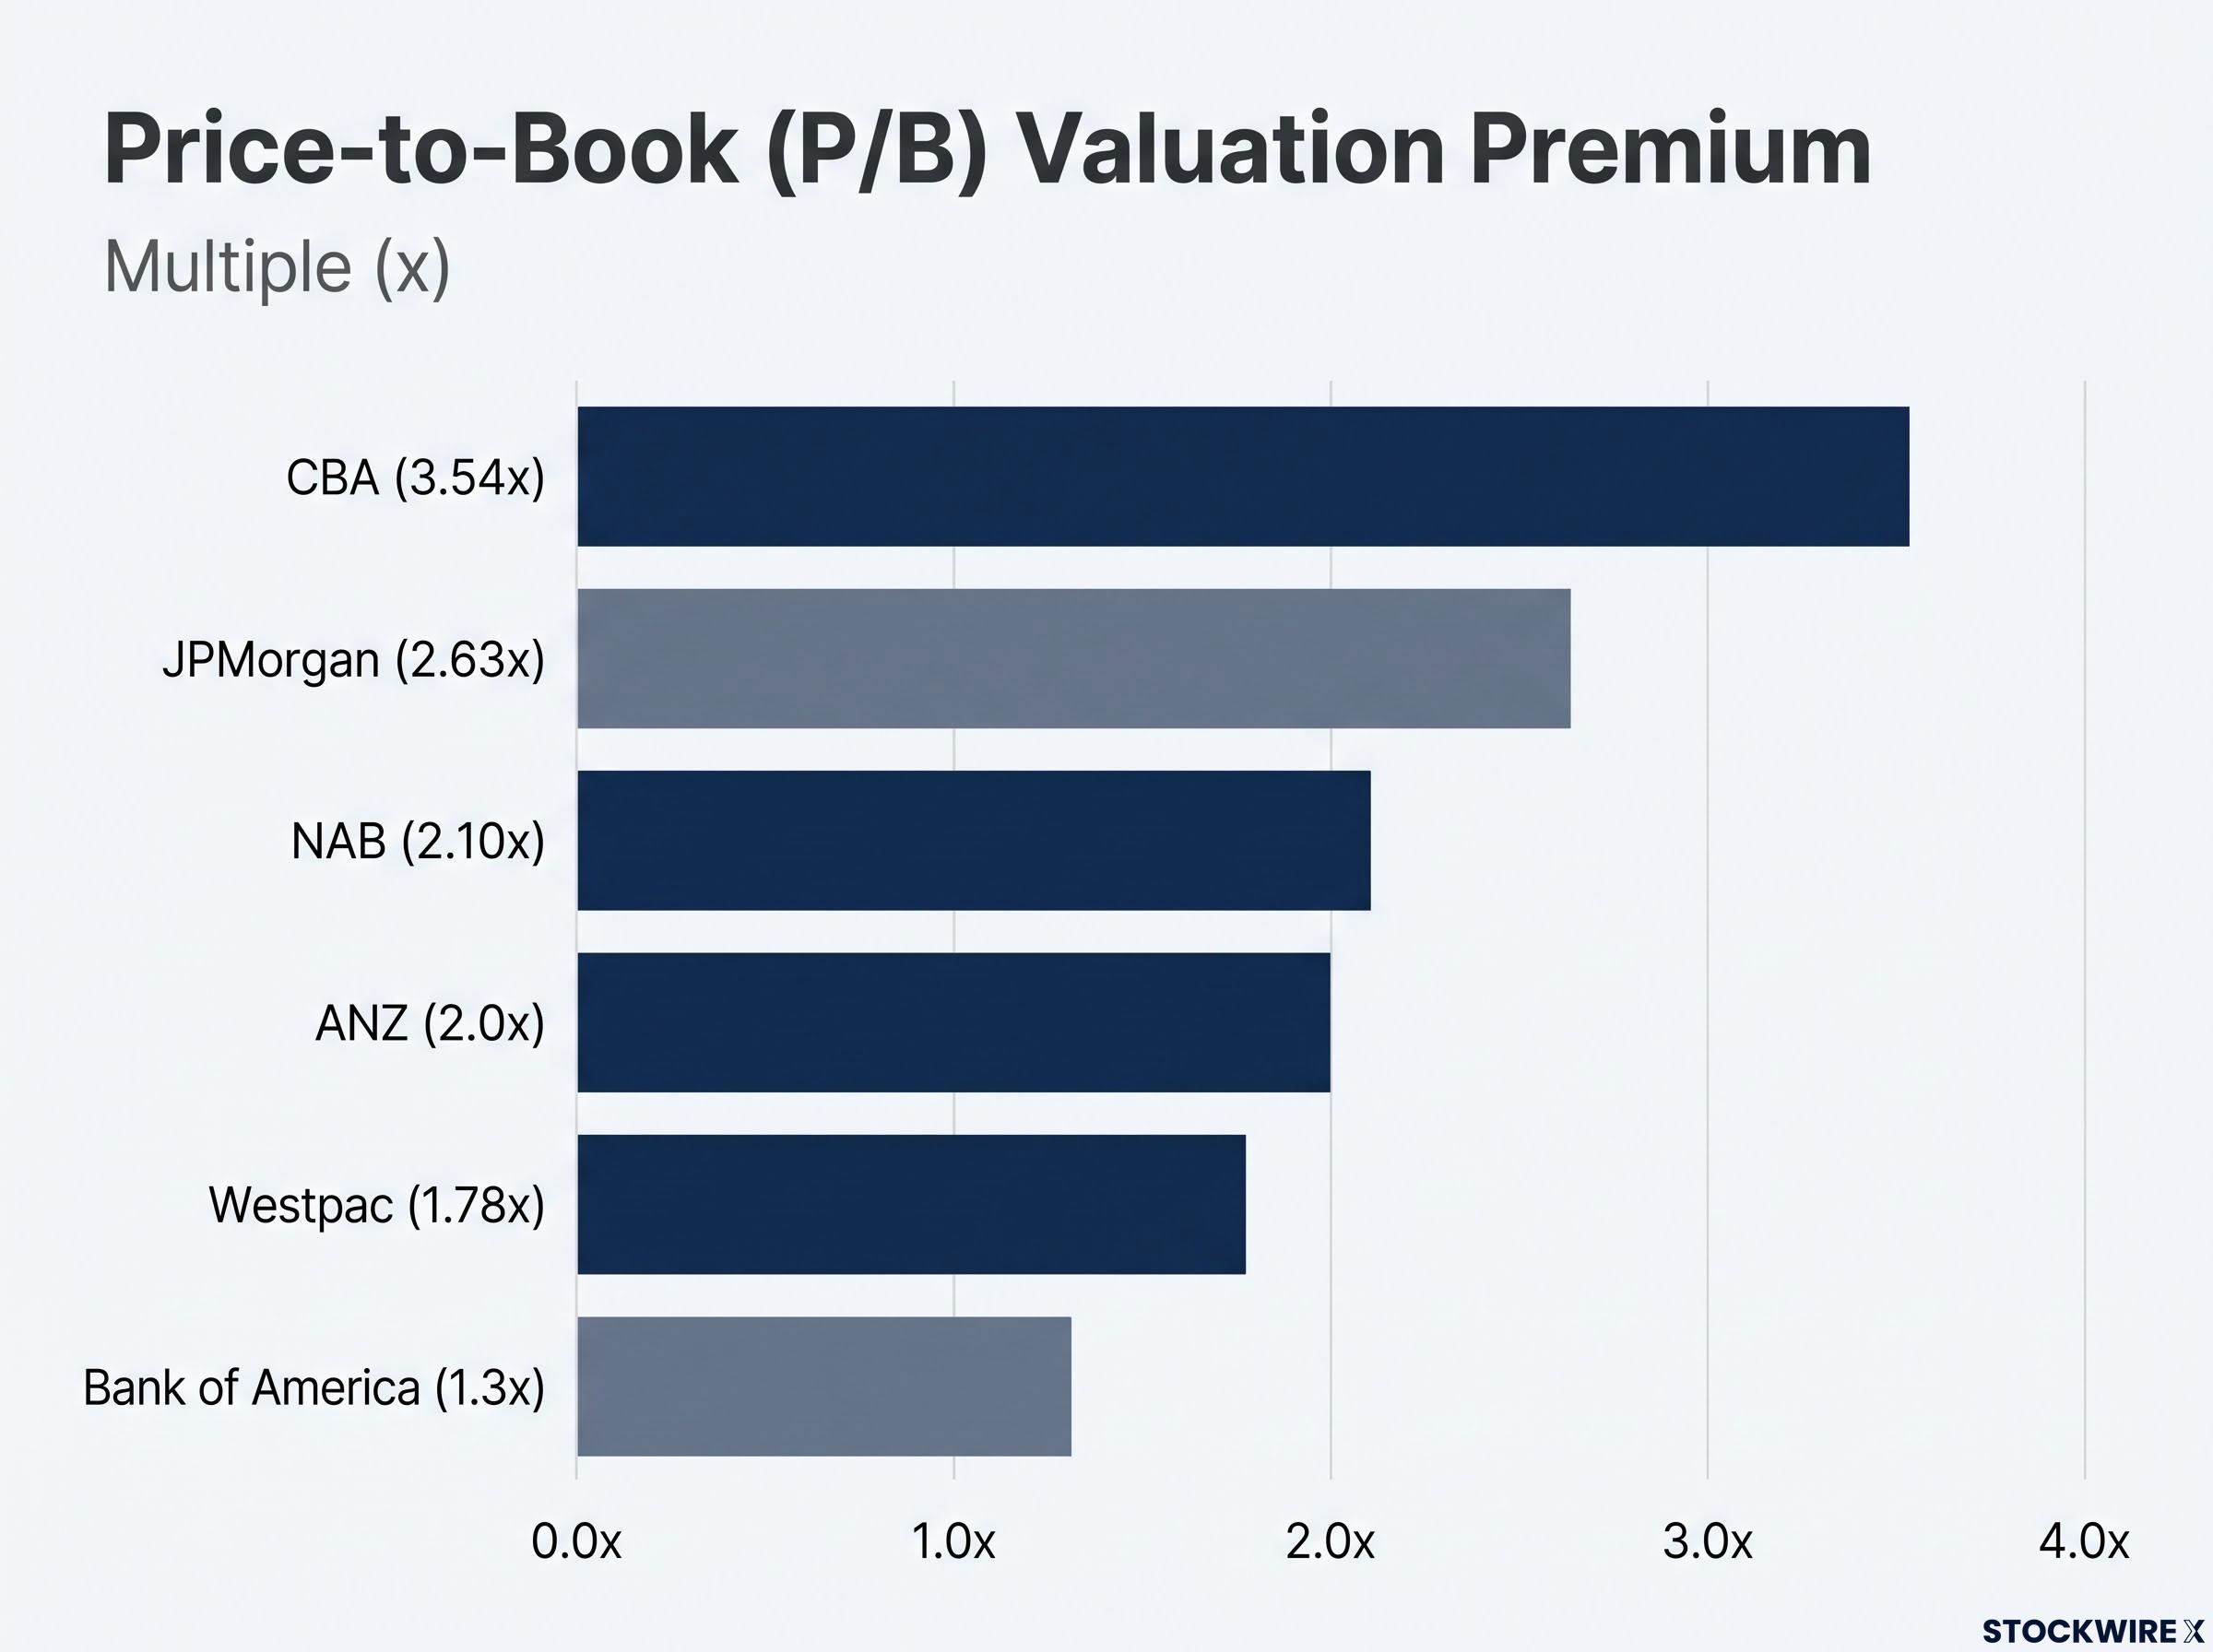
CBA trades at a significant 3.54x price-to-book premium compared to Australian peers like NAB at 2.10x and US giants like Bank of America at 1.3x.
| Bank | P/E | Price-to-book | Source basis |
|---|---|---|---|
| CBA | 25.7x | 3.54x | Forward P/E, November 2026 data |
| NAB | 19.8x / 20.3x | Almost 2x / 2.10x | Original source / November 2026 data |
| Westpac | 18.6x | 1.78x | Forward P/E, November 2026 data |
| ANZ | 16.3x / 20.6x | About 1.7x / about 2.0x | Original source / forward P/E |
| Bank of America | 12x | 1.3x | Original source |
| JPMorgan | Not available | 2.63x | Market Matters, July 2026 |
The premium had real foundations:
- Oligopoly: a small group of banks dominates mortgages and deposits.
- Franked dividends: these payouts are valued by super funds and retirees.
- Scarcity: there are few other large, liquid financial stocks on the ASX.
- Mortgage books: home loans have historically carried low losses.
US banks, meanwhile, sit in an economy growing at 5.9% in nominal terms, helped by a large tech component. Australia’s economy looks subdued by comparison. Morgan Stanley has questioned whether the local premium still holds up:
Morgan Stanley’s challenge Why should the banks trade above their five-year post-COVID averages when conditions are less favourable than in the past two years?
A bank priced at two or three times book needs strong growth to justify that multiple. Paying that much leaves you very little room if results disappoint.
When big ASX news breaks, our subscribers know first
Where are margins and provisions under pressure, and how do NAB and Westpac differ?
What squeezes margins
Net interest margin (NIM) is the gap between what a bank earns on loans and what it pays for funding. This year, several forces have squeezed it at once:
- Slower mortgage demand pushes banks to compete harder for each borrower.
- Discounting on advertised and broker rates is used to defend market share.
- Deposit costs rise as banks pay more to keep savers.
- Non-major lenders such as Macquarie Bank compete hard through brokers.
- Repricing timing matters, because loans and deposits adjust to rate moves at different speeds.
- Weak volumes make thinner spreads harder to offset with growth.
Mortgage applications reportedly fell 20% or more in 2026. That figure has not been independently confirmed. If it holds, banks are competing harder for a shrinking pool of borrowers.
Diverging housing credit forecasts between NAB and CBA for FY27 show how far the majors disagree on volume growth, with CBA already trimming its own guidance as applications weaken.
NAB versus Westpac on provisions
Provisions are money a bank sets aside for loans it expects may go bad. The bank-level results, several of which are reported but not independently confirmed, show how differently the majors are placed.
| Bank | NIM | Provisions | Dividend | Share reaction |
|---|---|---|---|---|
| NAB | 1.80% (up 6bp) | Charges $1.547B vs $833M | 85c final, fully franked | -5.37% |
| ANZ | 1.53% (from 1.55%) | Not reported in research | Maintained under policy | -3.20% |
| Westpac | 1.87% (down 7bp) | About $5.2B total | 154c total, 77c final | Up 0.9-1%, then lower |
Early coverage described this as NAB raising provisions while Westpac held them. That account does not stand up.
Westpac also lifted its provisions, to about $5.2B. NAB’s charges rose more sharply, including a $403M forward-looking top-up, and bad debts reached 0.19% of loans, reportedly a five-year high. The real difference between the two banks was the size and timing of the increases, and how the market read them.
Moody’s analyst Daniel Yu said NAB’s asset quality remains sound, but warned that rising arrears could push credit costs higher. JPMorgan flagged NAB’s more macro-sensitive loan book and lower capital ratio, meaning its loans are more exposed to swings in the wider economy. The lesson for you is that a bank’s dividend is only as secure as its credit and margin trends.
Do franking-boosted yields make Australian bank shares an income play rather than a growth play?
Income is the main reason most investors hold the banks, and on paper the yields look generous. Franking credits pass on tax the bank has already paid, which lifts the effective yield for shareholders who can use them.
Grossing up a yield At the 30% company tax rate, grossed-up yield = cash yield ÷ 0.70. A 4.53% cash yield becomes about 6.47%.
The two sources give slightly different yields, mainly because share prices moved after results.
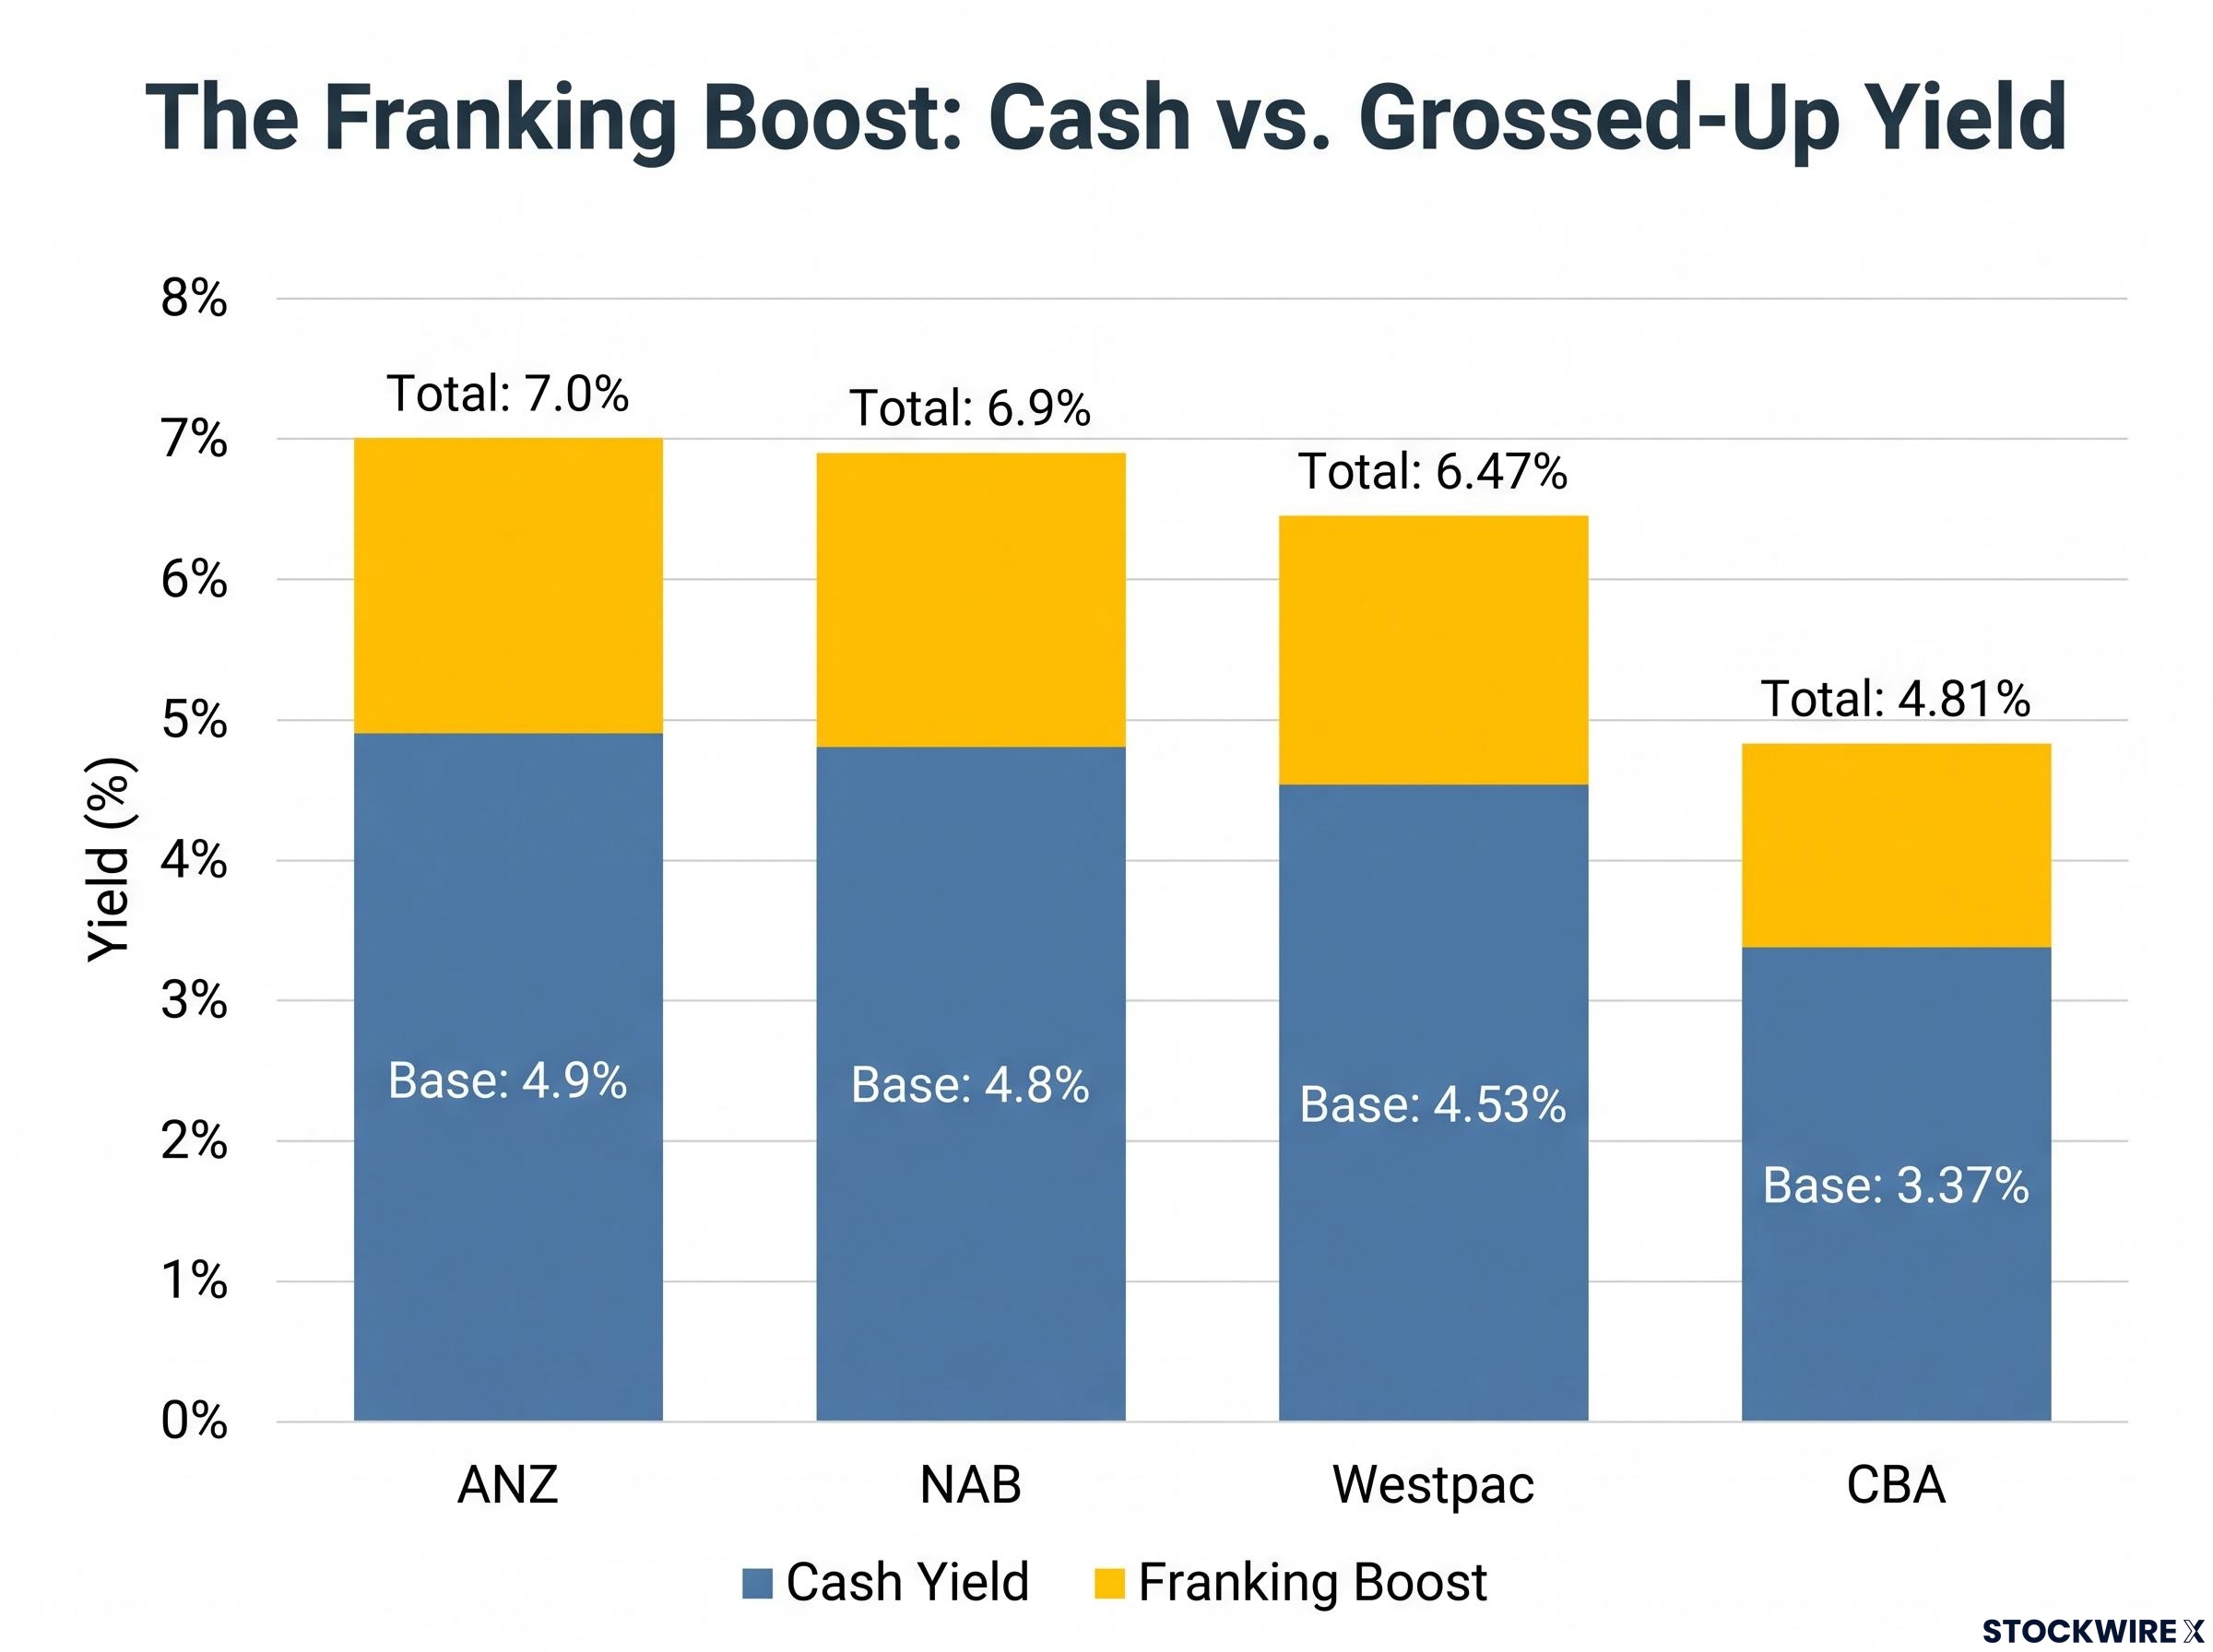
Franking credits significantly boost total returns, lifting ANZ’s base yield of 4.9% to a total grossed-up yield of 7.0%.
| Bank | Original gross yield | Research cash yield | Grossed-up yield |
|---|---|---|---|
| CBA | 4.4% | 3.37% | About 4.81% |
| NAB | 6.2% | About 4.8% | About 6.9% |
| ANZ | 5.7% | About 4.9% | About 7.0% |
| Westpac | 6.0% | 4.53% | About 6.47% |
Those figures need context. Westpac pays out 77% of statutory earnings, which leaves less capital in reserve for losses. APRA’s capital settings also limit how much the banks can distribute. Commentators describe the majors as cyclical income stocks: mature oligopolies with saturated mortgage markets and real exposure to the economic cycle.
Before buying for income, ask yourself three questions:
- Can you use the franking credits? Tax-exempt and some offshore investors get less value from the gross-up.
- Is the payout sustainable? A high payout ratio leaves a thinner buffer if credit losses rise.
- Could the multiple fall? At 3.54x book, CBA could lose more in share price than it pays in several years of dividends.
A high grossed-up yield only helps you if you can use the credits and the share price holds up better than the income you collect.
For Australian residents, franking credits create a structural after-tax advantage over foreign dividends, which is one reason local bank yields can still look competitive against US peers despite weaker price performance.
What could change the picture: rates, oil and mortgage competition?
The backdrop
The Reserve Bank of Australia (RBA) reportedly raised the cash rate by 25bp to 4.85% at its meeting on 3-4 November. Reports also put oil and refined-product prices up 20-25% on the RBA’s August assumptions. The RBA reportedly does not expect inflation to return to the middle of its target range until mid-2028. None of these figures has been independently confirmed, and the outlook will shift with each new data release.
Higher rates can lift the yields banks earn on their assets. They also strain household budgets, weaken demand for loans and sharpen competition for the best borrowers.
Scenarios and precedents
| Scenario | Likely effect | Most exposed |
|---|---|---|
| RBA turns to cuts | Less mortgage stress and better sentiment, offset by weaker asset yields | Mortgage-heavy majors |
| Oil falls materially | Higher real incomes and better chances of rate relief | Consumer lending books |
| Mortgage competition eases | NIMs stabilise and part of the valuation gap may close | Banks with the sharpest NIM falls |
| Applications keep falling | More price competition and possible de-rating | All four majors |
| Business credit losses rise | Higher provisions despite manageable household arrears | NAB |
History shows the market both punishing and rewarding the banks. In 2020, fears of a housing-led credit crisis hit valuations hard, before low rates and government support limited the damage. Reuters has reportedly contrasted that episode with today’s concern, which centres on earnings rather than a credit crunch.
The 2022-23 hiking cycle first lifted asset yields, then increased mortgage stress. Citi reportedly expects sector revenue growth to slow to 2.9% in FY2027, down from 4.4%. These forecasts are speculative and subject to change as market conditions and company performance evolve.
Rates, oil and mortgage competition are the three signposts to watch. Together they will show you whether the lag in your holdings is temporary or structural.
Weighing bank income against better-valued growth: what the lag means for your portfolio
The gap with US banks comes down to two things: a premium starting valuation and softer fundamentals at the margin. Dividends and franking credits give you an income floor. They do not protect you from a fall in valuation multiples.
If you can use franking credits and are comfortable with cyclical risk, the banks may still offer relative value, provided loan books stay healthy. If you are focused on growth, you face fully valued stocks with modest loan growth ahead.
Three measures will tell you which way the evidence is moving: the direction of each bank’s NIM, the size of provisions in coming updates, and the RBA’s next move on rates.
Investors weighing bank income against alternatives can use our full explainer on building ASX passive income, which compares direct shares, listed investment companies and income ETFs.
This article is for informational purposes only and should not be considered financial advice. Investors should conduct their own research and consult with financial professionals before making investment decisions.