
A 2x leveraged ETF does not simply double your stock’s return. And an option buyer who calls the earnings direction correctly does not always get paid. When Alphabet reported on 28 October 2026, its shares fell about 12.6% the next day, far more than options had priced. Even so, the way options are priced around earnings can leave a trader who was right on direction with a thin result. That is the core of the leveraged ETFs vs options question for event trades.
The question matters now because money is moving. ETF Action reported about $98 million of five-day net inflows into leveraged single-stock funds on 31 October 2026, as traders used them around earnings and after last week’s tech selloff.
This gives you a clear framework for deciding which tool fits a given event trade, and what each one can quietly cost you along the way.
How do leveraged single-stock ETFs and options differ structurally?
At the broker screen, the two feel very different. A leveraged single-stock ETF is bought like any share: type the ticker, enter a quantity, press buy. An options trade asks you to pick a strike, an expiry and a contract type, usually after your broker has approved you for options trading.
That simple access is the appeal. It also hides risks that are different in kind from the explicit costs of options.
| Issue | Leveraged single-stock ETF | Options |
|---|---|---|
| Directional exposure | About 2x or 3x the stock’s daily return | Calls, puts and spreads can express direction, volatility or a range |
| Maximum loss | Generally the amount invested, but it can go quickly | Long option: the premium; uncovered selling: larger or unlimited |
| Approval and margin | No options approval or margin loan (broker rules still apply) | Approval required; margin for short or complex strategies |
| Time decay | No explicit decay, but daily resets, financing and fees erode value | Explicit decay that speeds up near expiry |
| Implied volatility | No direct exposure to post-earnings volatility collapse | Often elevated before earnings and can collapse afterwards |
| Extended hours | Trades pre-market and after-hours, often with wider spreads | Limited or no comparable overnight liquidity for some contracts |
| Best suited to | Short, actively monitored directional trades | Traders comfortable with volatility, expiry and assignment |
Implied volatility is the level of future price movement that option prices assume. The table frames neither tool as safe. A 2x ETF can lose roughly twice the stock’s one-day move, while a long call can lose money after a favourable move if implied volatility collapses.
Choosing between them is really choosing which risk you can monitor and tolerate, not which one costs less upfront.
Costs and liquidity beyond the headline
Charles Schwab describes leveraged ETF expense ratios of around 1% or more, against as little as 0.02% for some benchmark ETFs. GraniteShares examples run at about 1.35%-1.50%, before financing and trading costs.
Single-stock leveraged funds typically get their exposure through total return swap contracts with an investment bank rather than by holding shares, which adds counterparty risk and financing costs that you do not face when owning the stock directly.
Size matters too. According to Morningstar Direct data reported by Reuters on 25 August 2026, the average leveraged ETF held $63.3 million, with many under $7 million, and 63 leveraged single-stock funds closed in 2026 versus 3 in 2025. Small funds can mean wider spreads, which is a cost you pay on every trade. Market-size figures from different sources measure different universes, so treat each on its own rather than adding them together.
When big ASX news breaks, our subscribers know first
Why does daily rebalancing make returns depend on the path?
Start with the numbers. A 2x ETF targets each day’s return, not the return over an earnings cycle or a year. Here is what happens when a stock falls and then recovers, in an illustration from Morningstar.
| Day | Stock return | Stock value | ETF daily return | ETF value |
|---|---|---|---|---|
| Start | n/a | $100.00 | n/a | $100.00 |
| 1 | -10% | $90.00 | -20% | $80.00 |
| 2 | +11.11% | $100.00 | +22.22% | $97.78 |
The flat-stock loss The stock ends exactly where it began. The 2x ETF ends at $97.78, down 2.22% before fees and financing.
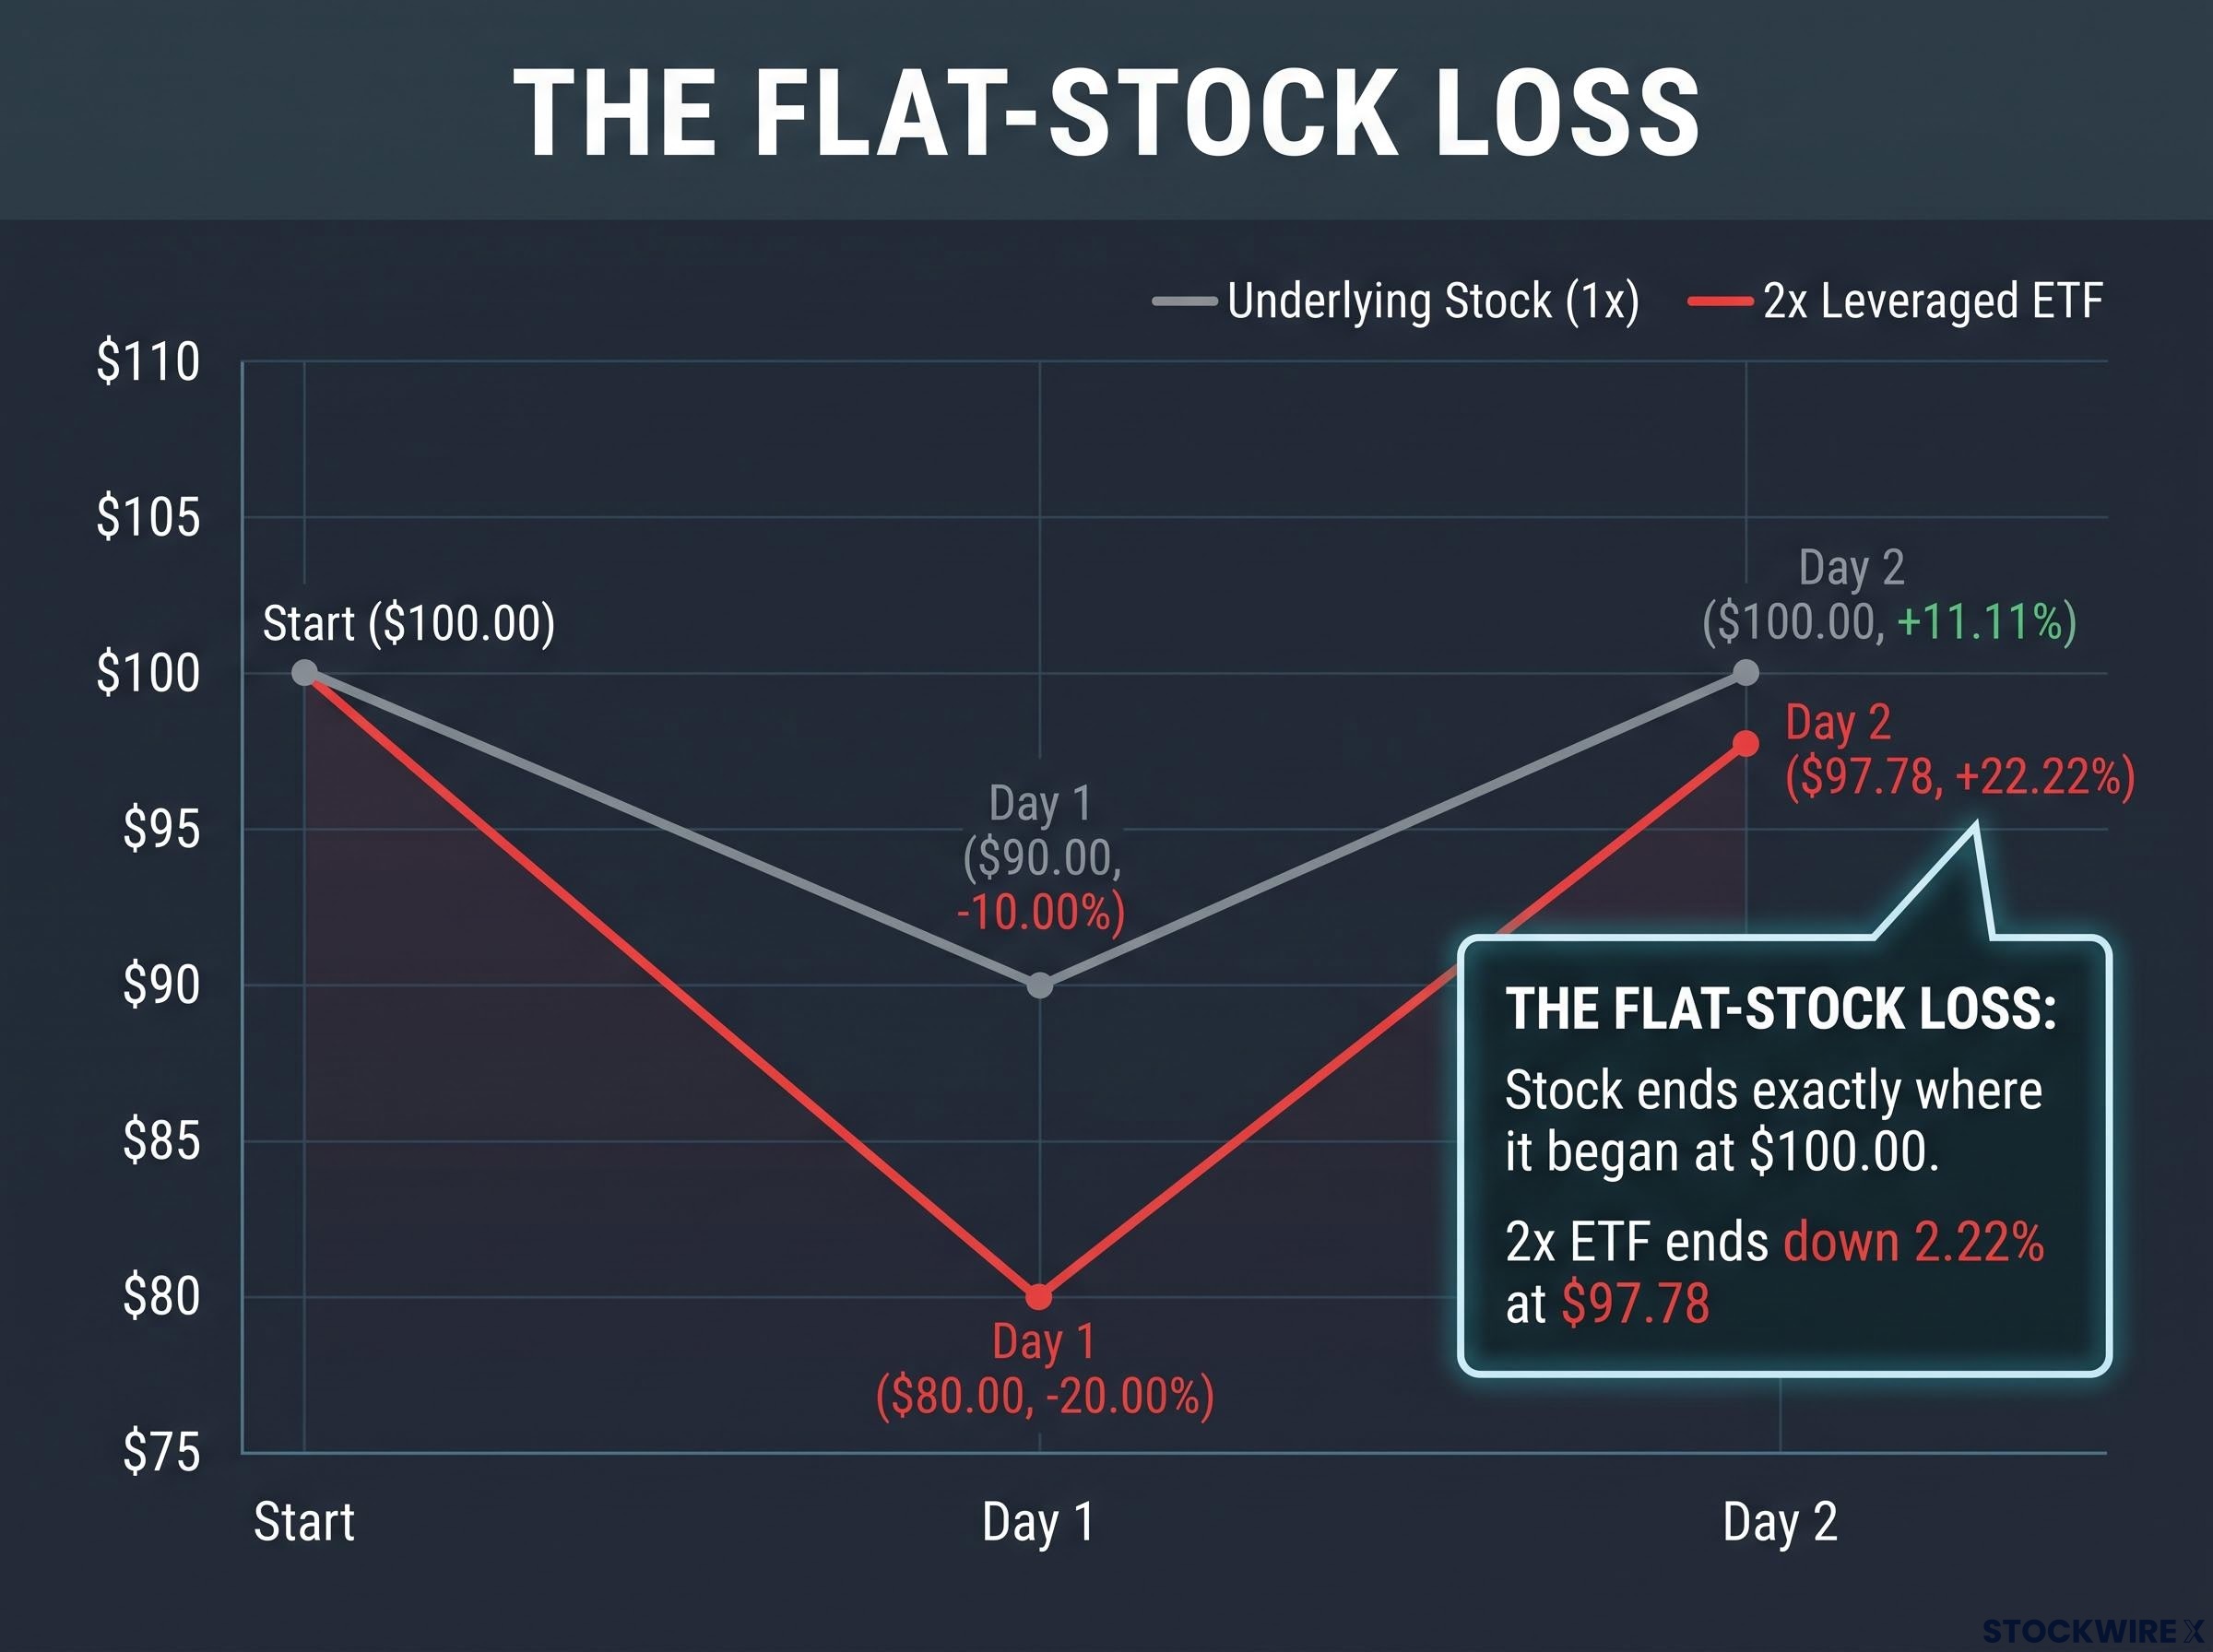
The ETF’s day-two gain is calculated from a smaller base of $80, so it cannot fully recover. That is path dependency: your result depends on the route the stock takes, not only where it finishes.
The $97.78 ending value is a clean example of volatility drag: percentage losses on a daily-resetting base need proportionally larger gains to recover, so a stock that ends flat can still leave you with a loss in the fund.
The same mechanism can work in your favour. If the stock rises 10% two days running, it gains 21%, while the 2x ETF gains 44%, more than the 42% you would get from simply doubling. GraniteShares CEO Will Rhind has noted that a 3x S&P 500 ETF reportedly returned about 3,300% from 2011 to 2025, versus about 1,500% for simple three-times cumulative exposure.
How the path shapes your result depends on the market regime:
- Trending: compounding can help.
- Flat or choppy: repeated rebalancing can produce losses even if the stock ends near its start.
- Declining: losses are magnified daily from an ever-lower base.
- Single stock: no diversification, so earnings gaps, guidance shocks or trading halts can dominate.
Academics agree more than they first appear to. Carpenter, Lou and Whitelaw argue decay is not a guaranteed loss, with investors tending to do worse in sideways markets and better in trending ones. Path-dependence work linked to NYU’s Marco Avellaneda shows high volatility with little net change hurts; one 2026 study example had a 2x daily-reset product losing 4% versus 2% for a non-rebalanced 2x position.
Being right on where a stock ends up is not enough. How bumpy the route is can decide your result.
What happens to each tool around an earnings announcement?
The ETF’s reset problem plays out over days. Options carry a different trap, and it can spring overnight.
Consider Alphabet’s 28 October 2026 result. Options priced a move of about 5.8% (one report put it near 6.1%). The stock then fell about 12.6% in the regular session on 29 October, according to Barchart’s earnings-move history.
Priced versus realised Options implied a move of about 5.8%. Alphabet delivered roughly 12.6%, more than double.
A put buyer should have done very well. Yet the sequence shows why direction alone does not decide the payoff:
- Pre-earnings pricing: event volatility builds, making options more expensive in the days before the result.
- The announcement: uncertainty disappears the moment the numbers land.
- The move: the stock reacts, sometimes by more than options priced, as Alphabet did.
- The volatility reset: implied volatility drops sharply, cutting the value of every option still held.
- The payoff: an option holder gains from the move but loses on the volatility collapse; an ETF holder simply gets about twice the day’s move.
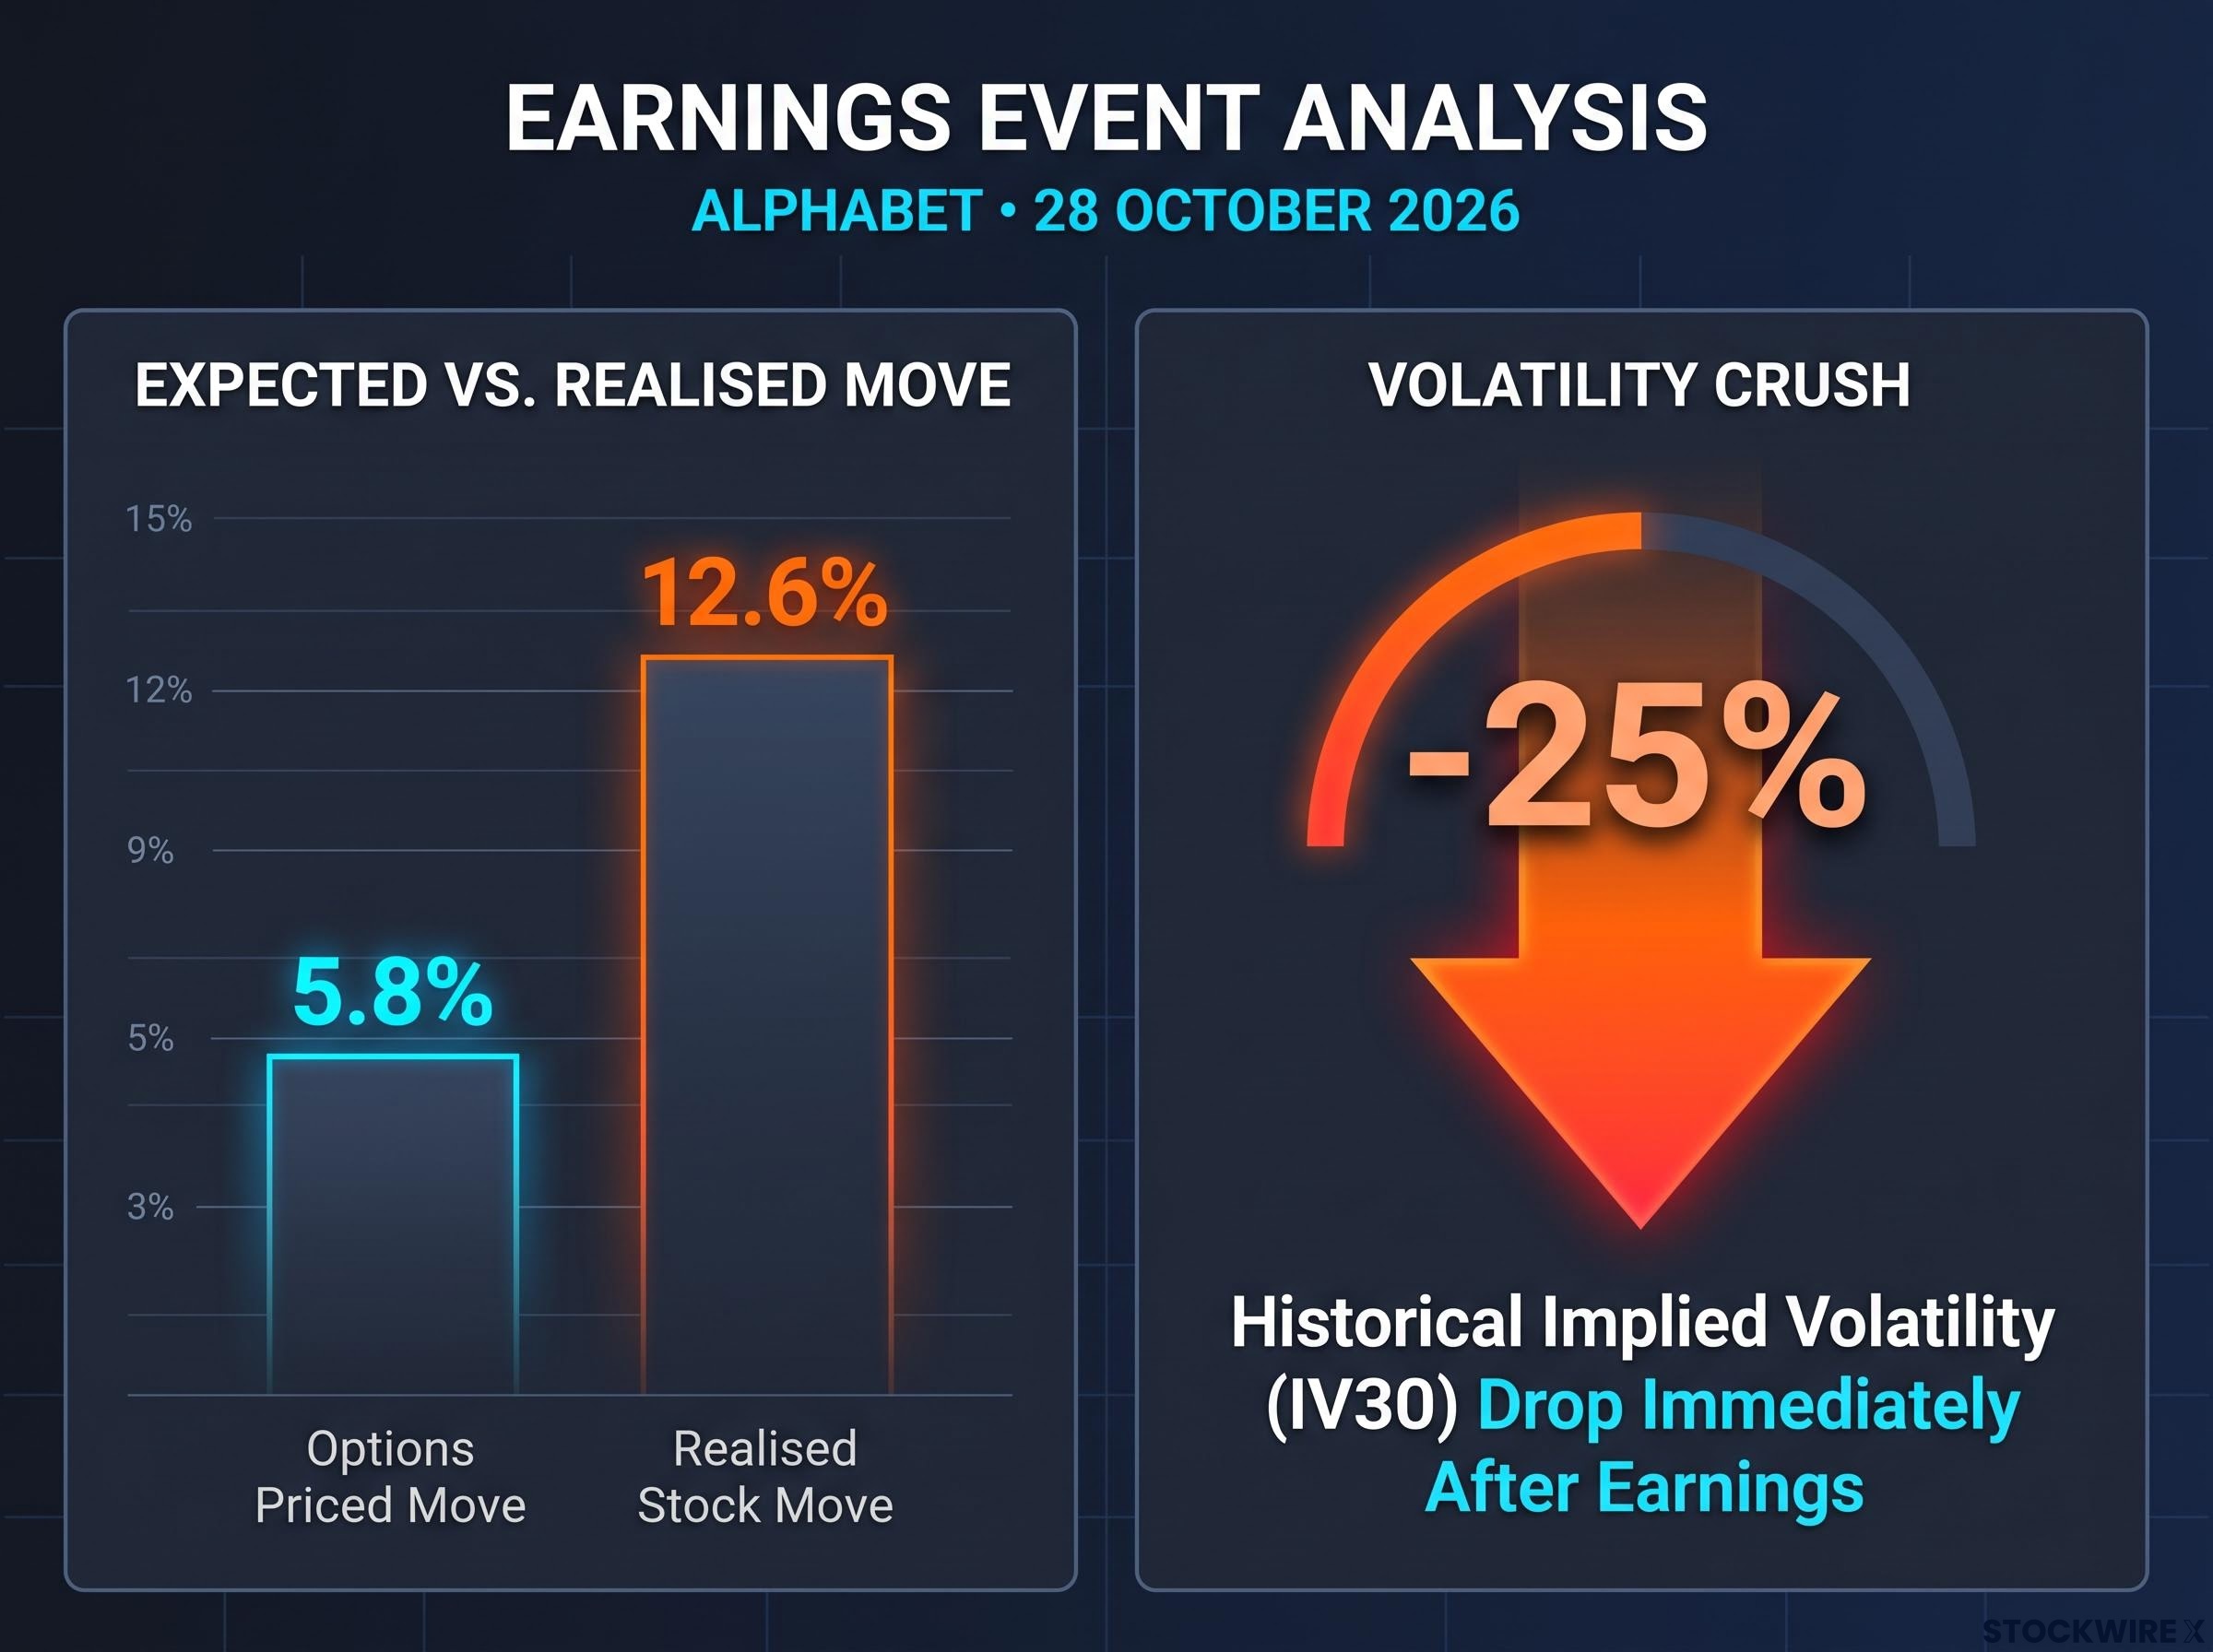
Different sources measure this differently. A separate report recorded an implied move of about 8.49% and a drop in 30-day implied volatility (IV30) of 8.63 points, to about 30.1. Market Chameleon data shows Alphabet’s 30-day implied volatility has historically fallen about 25% immediately after earnings, and Saxo describes event volatility collapsing “regardless of direction.”
That fourth step is known as implied volatility crush, and it hits option premiums after the numbers land whether the stock rises or falls, which is why mega-cap earnings can reward the right direction only partially.
The ETF sidesteps that trap. It has no direct exposure to volatility collapse, needs no options approval and trades after-hours, when earnings reactions first hit. In exchange, you accept wider spreads outside regular hours and a daily reset that starts working on you from day two.
Rhind’s view is that traders often use both. For you, pricing matters as much as direction with options, while timing and reset mechanics matter as much as direction with ETFs.
Is a leveraged ETF suitable, and how do dip-buyers use them?
Why dip-buyers reach for leverage
After the sharp Friday tech selloff, Rhind said GraniteShares saw net inflows of roughly $250 million across its platform in one day, with buying in Google, Intel and ServiceNow. The appeal is clear: a belief the selloff overshot, low upfront capital, no options approval, extended-hours access and familiar names.
ETF Action’s figures, reported on 31 October 2026, show $98 million of five-day net inflows and $180 million of weekly inflows for GraniteShares. These are distinct measures and cannot be joined into one series.
| Stock | ETF | Net flow |
|---|---|---|
| Alphabet | Direxion Daily GOOGL Bull 2X ETF (GGLL) | $280M |
| Intel | GraniteShares 2x Long INTC Daily ETF (INTW) | $197M |
| ServiceNow | GraniteShares 2x Long NOW Daily ETF (NOWL) | $72M |
Dip-buying tends to work when the fall is temporary and a sustained trend resumes. It tends to fail when the stock keeps falling, swings without direction or gaps hard. Reuters reported that GraniteShares liquidated its 2x Lucid-linked ETF after Lucid fell about 51% in one day on 14 July 2026, leaving net asset value at zero.
A four-question suitability test
Before your next trade, ask yourself:
- Is your horizon short? These products target one day at a time.
- Do you have a defined exit? Know your stop and your target before you buy.
- Is liquidity adequate? Check fund size and spreads, especially after-hours.
- Does your thesis survive new company information? If guidance changes, would you still hold?
The SEC and FINRA, in investor warnings updated between late October and 1 November 2026, say these products target a daily objective and are generally unsuitable for unmonitored buy-and-hold. That is a warning, not a ban. No newer ESMA, ASIC or FCA warnings specific to these products were identified as of late October 2026.
The products suit a narrow job: short, monitored, defined-exit trades. Heavy inflows do not show that they suit a longer hold.
Matching the tool to the trade before the next earnings date
Each tool swaps one set of problems for another. Leveraged ETFs trade the visible complexity of options for reset and compounding risk. Options trade operational simplicity for volatility and decay risk.
So decide three things first: your horizon, how closely you can monitor the position, and which risk you understand best. If you cannot watch a position daily, the reset works against you. If you cannot read implied volatility, an option can disappoint even when you are right.
Before the next earnings date, compare the options-implied move with the stock’s historical realised moves, and check the ETF’s size and spreads. Neither tool is automatically safer, and the education you bring to the trade matters as much as the tool you pick.
The options-implied move is a price for risk rather than a forecast, and realised earnings moves have landed well above and well below it across many reports, so comparing the two over several quarters gives a more honest picture.
This article is for informational purposes only and should not be considered financial advice. Investors should conduct their own research and consult with financial professionals before making investment decisions. Past performance does not guarantee future results.