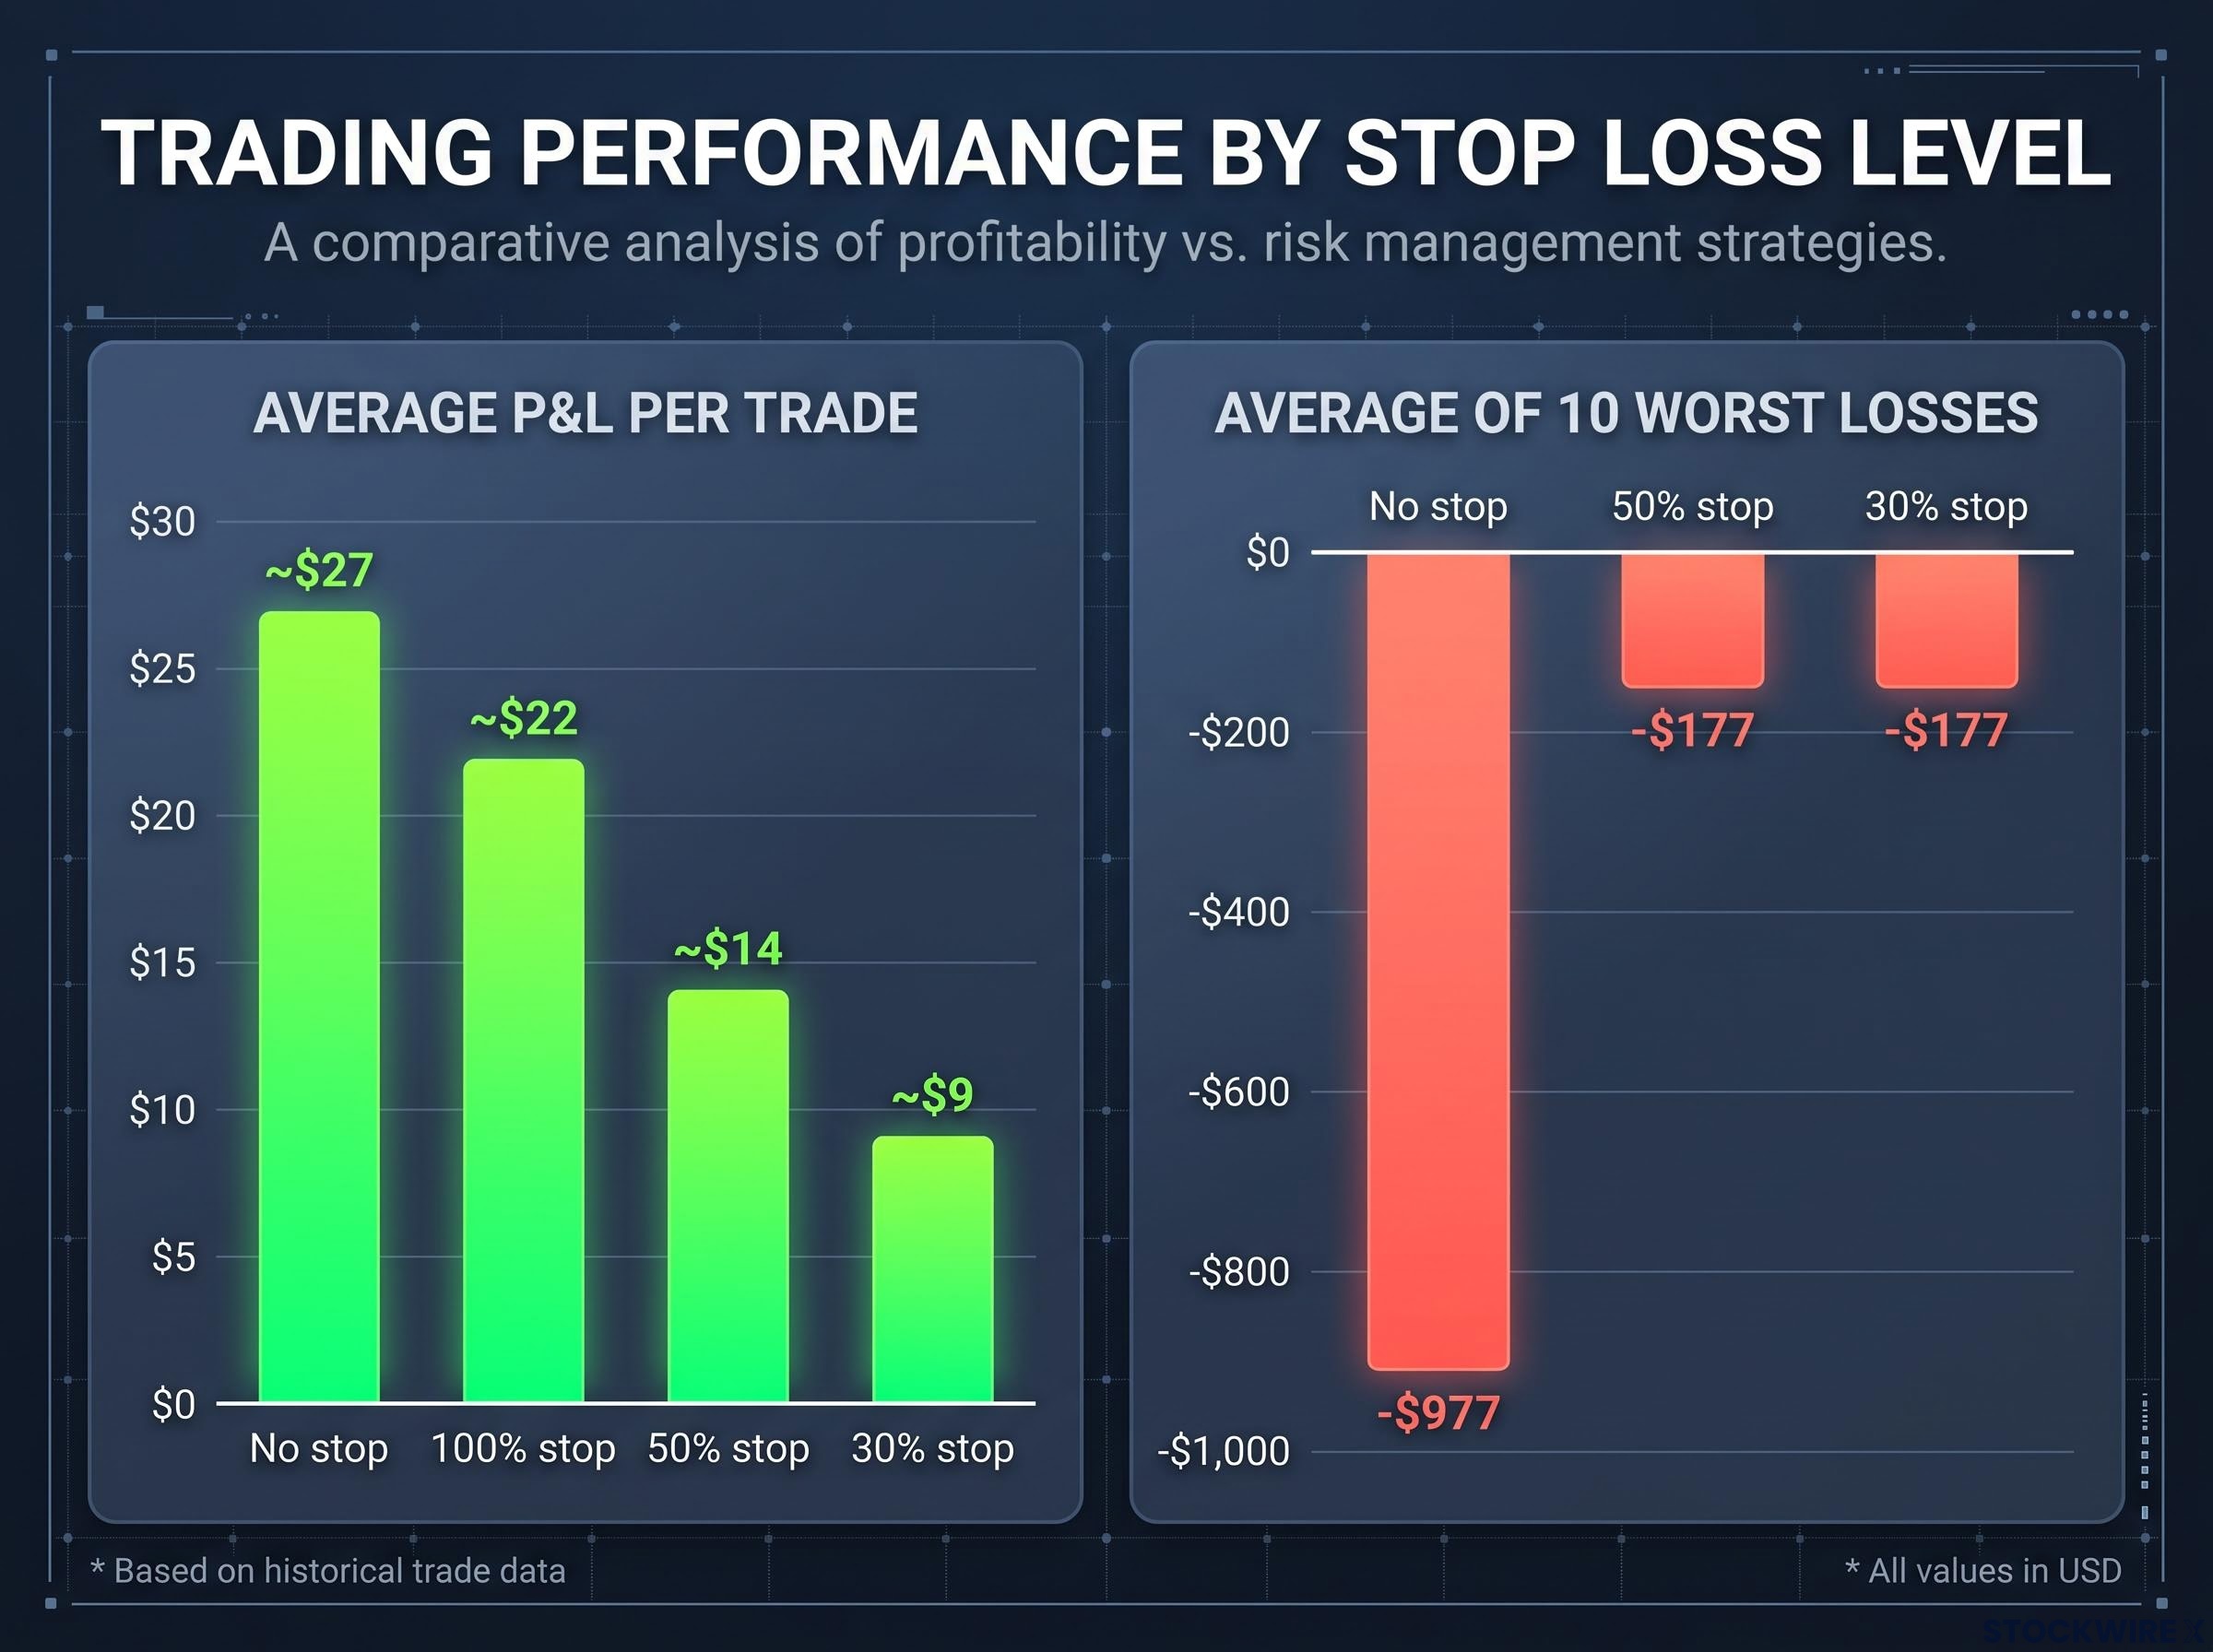
A stop loss looks like a free upgrade to a put spread, but the numbers suggest otherwise. In one 10-year backtest, a put spread with no stop loss averaged about $27 of profit per trade. Adding a stop at 30% of the premium cut that to about $9.
That gap matters because recent sell-offs have tested every premium seller. The drops in August 2024 and April 2025 wiped out gains that took years to build, so deciding where (or whether) to place a stop is a live question for your account.
One caveat comes first. These figures come from a presenter’s 10-year backtest, not an independent benchmark, and no published study reproduces them exactly.
This explainer walks through what stops actually cost you, what they save you, and why the size of your position does more to keep your account alive than any stop level you choose.
Why a stop loss on a put spread is insurance, not a profit tool
Every stop level in the backtest lowered average profit. Not one improved it.
| Stop level (% of premium) | Average P&L per trade |
|---|---|
| No stop | ~$27 |
| 30% | ~$9 |
| 50% | ~$14 |
| 100% | ~$22 |
That pattern makes sense once you treat the stop as insurance. You pay a premium, in the form of lower average profit, for protection against a bad outcome. Tight stops are expensive cover that eats a lot of profit; wide stops are cheaper but shield you from fewer large losses.
There is a twist. Your long put already limits how much you can lose, so adding a stop means layering a second form of cover over protection you already hold. If you judge a stop by whether it raises profit, it will always look like a failure, so judge it instead by which tail losses it removes.
How the defined-risk payoff works
A bull put spread means you sell a put at a higher strike and buy a put at a lower strike, collecting a net credit. Take a $5-wide spread sold for $1.90. Your maximum loss is the width minus the credit: $3.10 per share, or $310 per contract before commissions.
- Maximum profit: the net credit, earned if the underlying finishes at or above the short strike at expiration.
- Maximum loss: strike width minus credit, times the contract multiplier.
- Buying power: generally about the maximum risk, though it varies by broker and account type.
- Breakeven: short strike minus credit, so a short $100 put with a $1.90 credit breaks even at $98.10.
- Assignment worst case: below the long strike at expiration, both legs are exercised and you take the defined loss.
A stop never changes that contractual maximum. It only sets the exit you intend to take before expiration.
The defined-risk payoff is the main reason put spreads versus naked puts looks lopsided in sell-offs: in each major drawdown studied, naked short puts lost roughly 1.7 times as much as comparable spreads, and you never face a stop firing under stress.
When big ASX news breaks, our subscribers know first
What different stop levels cost in lost winners and what they save
Start with how often a tight stop fires. The answer surprised even the presenters.
Key statistic A 30% stop exited 51 of every 100 trades. Only 24 were true losers. The other 27 would have won.
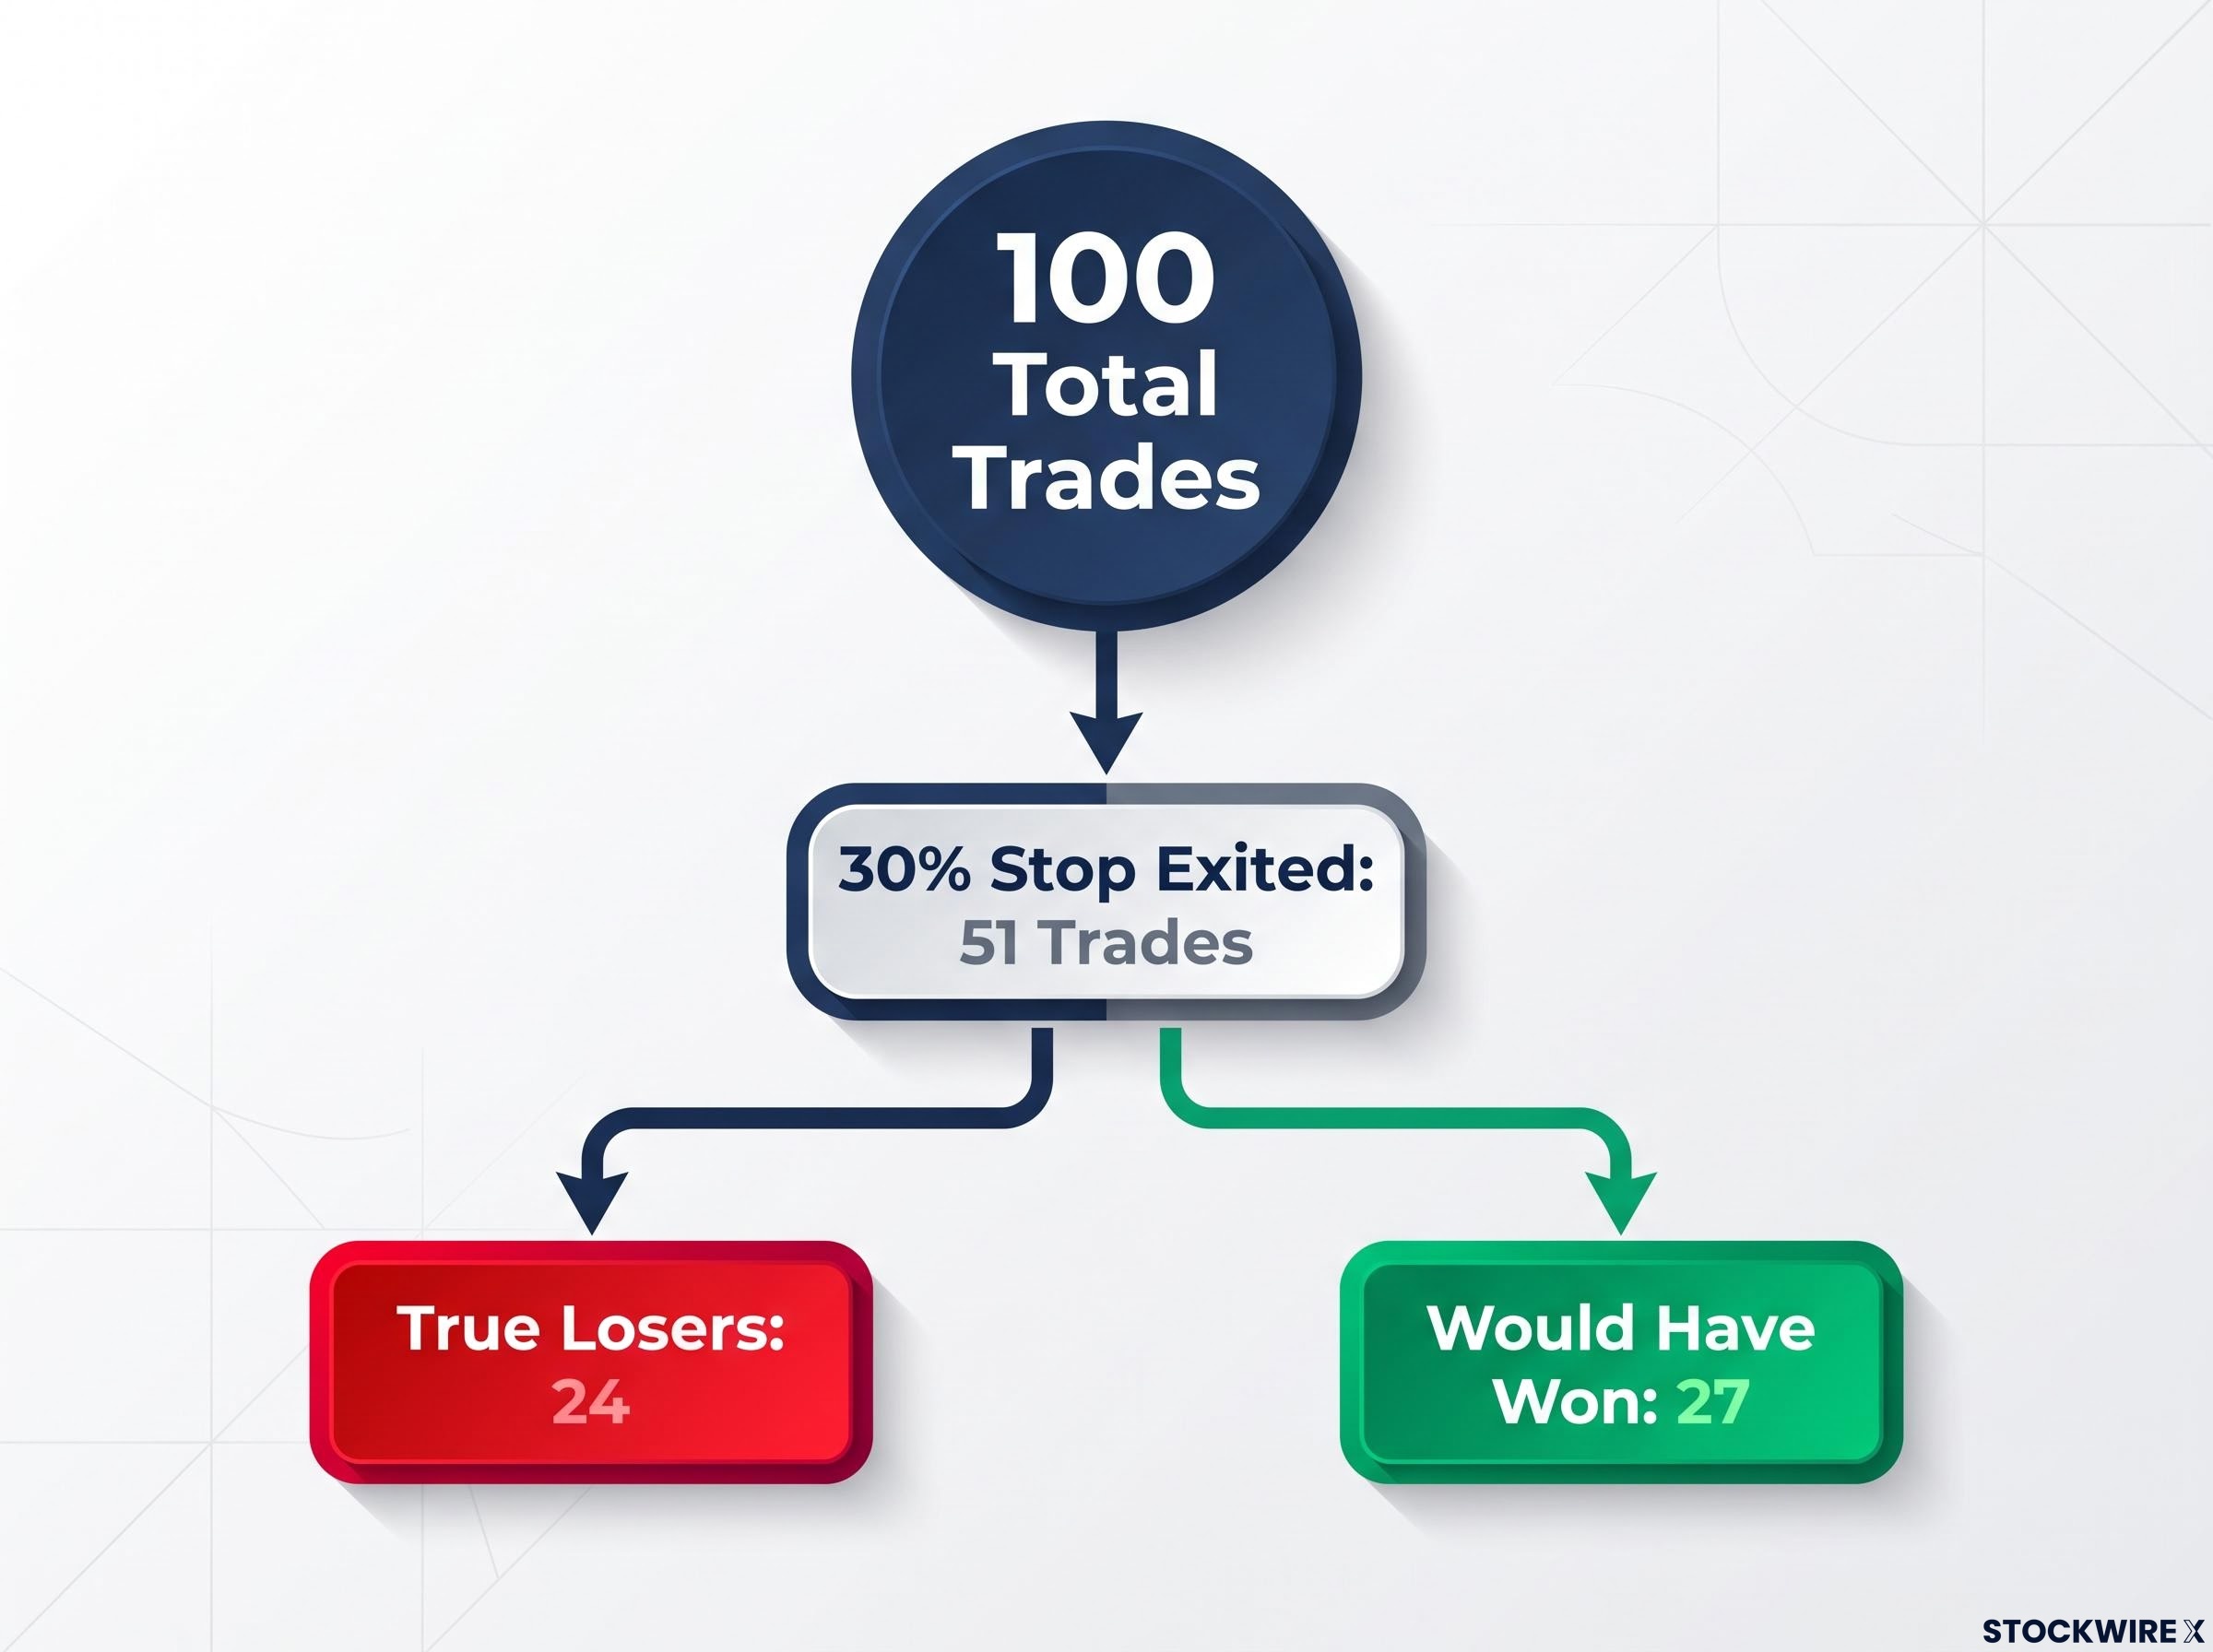
More than half of those exits were trades that would have paid you. The reason is mechanical: stops at 30% or 50% of premium can trigger while the spread is still out of the money, meaning the underlying sits above your short strike. Those positions could still finish as full winners. Stops at 100% or 200% line up with genuine in-the-money losses, which makes them more meaningful signals.
A similar pattern shows up elsewhere: tastytrade testing of zero-DTE iron condor stops found roughly 48% of trades stopped at 0.5x would have recovered to breakeven, which echoes the false exits seen on tight put spread stops.
Now look at the ledger, again from the presenters’ backtest.
| Approach | Saved on bad trades | Cost on other trades | Average of 10 worst losses |
|---|---|---|---|
| No stop | None | None | ~$977 |
| 30% stop | ~$36 | ~$54 | ~$177 (with stops) |
| 50% stop | ~$30 | ~$43 | ~$177 (with stops) |
On average, each stop cost more than it saved. Yet the protection is real. The worst losses shrank from roughly $977 to about $177, and the largest loss relative to buying power fell from 85% with no stop to about 19-36% with 30-50% stops.
So a tight stop swaps many small, certain costs for protection against rare, large losses. Whether that exchange suits you depends on how much one bad trade would hurt your account.
Why stops lower average profit: the mechanics behind the cost
How can something that cuts losses also cut profit? The answer is structural, not a quirk of one dataset.
- It sells eventual winners early. A spread can dip on a volatility rise, then recover as time decay works in your favour; the stop locks in the loss first.
- It triggers on spread price, not expiration odds. Volatility expansion or a temporary bid/ask mark can force an exit while the underlying is nowhere near the loss zone.
- Exits carry friction. You must buy back the short put and sell the long put, and quotes widen in fast markets.
- Gaps jump the stop. Overnight shocks can move the spread straight past your level, so you exit at the next available price.
- The long put already caps the loss. A stop can turn a recoverable paper loss into a permanent one while adding costs.
There is also a counting issue. A spread down 50% of its credit can still expire profitably, but a stop backtest records the early exit as a loss.
Two sell-offs, two different lessons
These episodes were different in kind, and their figures use different measurement bases.
- August 2024: The S&P 500 fell as much as about 8.5% from its July record, according to Reuters citing Cboe analysis, after a weak jobs report and a Bank of Japan-driven unwind of carry trades. Cboe’s Mandy Xu described the swift fall and rebound as positioning-driven.
- April 2025: The index dropped about 9% in a week after the tariff announcement and sat about 18.9% below its 19 February record close by 8 April (Reuters, LSEG). The VIX, a measure of expected market volatility, breached 60 intraday.
The 8%, 9% and 19% figures are not three separate bear markets; the latter two belong to the same tariff shock. A tight stop would likely have sold some positions just before the August rebound, while April shows why a stop can fail to fill where you expect in a gap-prone market.
Why position sizing matters more than where you place the stop
If stops are imperfect, what actually protects you? The long put gives you something a stop cannot: a maximum loss you know before you enter.
Size every spread so that losing that full amount is acceptable. Never size as though your stop will always fill at its intended price.
Sizing formula Contracts ≈ (account equity × risk percentage) ÷ (maximum loss per spread)
Here is an illustrative example. With a $50,000 account risking 1%, you have $500 at risk, and a $310 maximum loss per contract implies about 1 contract. You control that number fully before the trade, but you control a stop’s fill only partly.
Another way to frame the same discipline is sizing from the stop backwards: a 1% risk with a 50 entry and a 45 stop gives 200 shares, which caps the planned loss before the trade is placed, though fills can still slip.
Win rates can lull you here. The presenters’ charts show a 10-year put spread win rate of 73.8%, about 74% in one recent year and about 72% in 2026. Losses larger than the credit received occurred about 11-12% of the time over 10 years, versus about 7% in the latest period cited.
Cboe’s PUT Index, which tracks collateralised short puts, shows a 9.40% annualised return alongside a -32.66% maximum drawdown (data through 31 August 2023). High win rates and severe tails can live side by side, and a 74% win rate is not the same as safety.
What the backtest cannot tell you
The stop figures are the presenters’ results, and no independent 10-year study reproduces them. Published work from tastylive, Option Alpha and Cboe supports high win rates and a long-run volatility premium, not a universal stop percentage.
- Regime bias: 2015-2025 was largely a rising market.
- Few crises: ten years holds only a handful of independent shock episodes.
- Parameter mining: testing many stop levels risks picking a winner by chance.
- Modelled fills: mid-price fills are friendlier than what you get live.
Practical guidance: wide stops and checking whether the spread is in the money
Practitioners do not agree on the ideal stop. The presenters split between 50-70% and 100-200% of credit, then concluded both are acceptable, which points to wide stops around 50-100% if you use one at all.
Timing shaped their view. Over the 10-year rising market, 50-70% stops worked best, while wider 70-100% stops have tended to work better since 2015. Other sources frame it differently: tastylive and Option Alpha say stop and exit rules must be tested together, and Fidelity describes the spread as defined-risk, making a stop optional.
| Approach | What you gain | What you give up | Who it suits |
|---|---|---|---|
| Tight (30-50%) | Smaller worst losses | Many eventual winners | Traders prioritising less exposure in sustained sell-offs |
| Wide (70-100%) | Room for recovery, some tail cover | Larger interim losses | Traders tolerating ordinary volatility |
| No stop | Highest average P&L in the backtest | Full defined loss in bad trades | Traders who size strictly to maximum loss |
The single most useful check is whether your stop sits where the spread is actually in the money. Use a theoretical analysis tool to see this, especially on 20– or 30-point-wide spreads, where a percentage stop can fire long before the short strike is breached.
- Size to maximum loss. Use the formula, not the hoped-for stop fill.
- Choose a wide, tested stop or none. Go tighter only if you accept losing some winners.
- Check the in-the-money position. Confirm your stop does not trigger while the spread is still out of the money.
- Assume imperfect fills. Gaps and volatility spikes rarely respect your level.
Favour consistency over aggressiveness, and judge results by average P&L, worst loss, drawdown, slippage and consecutive losses, not win rate alone.
For readers wanting a concrete threshold to apply, our full explainer on setting a put loss exit rule shows how a credit-multiple buyback target can be set before you open the position.
Sizing first, stops second: the call to make before your next spread
A stop on a put spread is insurance you pay for in lower average profit. Sizing is the control that still holds when a stop gaps or fills badly, and no source supports one universal stop percentage.
Your decision comes in order. First, size each position so the full defined loss is one your account can absorb. Then decide whether a tight stop, a wide stop or no stop fits your tolerance for giving up winners.
Before relying on any level, test it on your own trade history using realistic live fills rather than modelled mid-prices. The backtest above is a starting point, not a rule.
This article is for informational purposes only and should not be considered financial advice. Investors should conduct their own research and consult with financial professionals before making investment decisions. Past performance does not guarantee future results. Financial projections are subject to market conditions and various risk factors.