
Consider a stock trading near $35. Five points below sits a $30 put, quoted at roughly $0.04. Five points above sits a $40 call, quoted at roughly $0.30. Same distance from the current price, same expiration, and yet the call costs about six times what the put does.
That stock is Nike, trading near a 12-year low ahead of its earnings announcement scheduled for 1 October 2026 after market close. The options market has priced a move of roughly 7-10% around the report, and the way that move is priced, strike by strike, reveals how traders are actually positioned going into the event.
Here is what those numbers actually encode, and how to read them. This walks through what the pricing structure signals ahead of a major earnings event, what it does not signal, and how to interpret the specific instruments that carry the information: implied volatility rank, term structure, and call skew. Treat it as a toolkit you can carry into any earnings season, not a one-off case study.
What the options market is actually pricing when it quotes an implied move
Start with a fact that trips up most people the first time they meet it: the options market does not quote an implied move to forecast where the stock is going. It quotes a price to transfer risk. The number is what someone charges to take the other side of your uncertainty over the event.
That number comes from the at-the-money straddle. Buy both the call and the put at the strike closest to the current price, add their premiums together, and you have the market’s one-standard-deviation estimate of how far the stock could travel by expiry. For Nike, the front-cycle straddle priced at roughly $2.90 on a stock near $35, which works out to about 10%.
The at-the-money straddle price is itself a downstream output of implied volatility basics: the single annualised number extracted from live market prices that drives every premium quote, Greek, and probability estimate you see on the chain.
Notice what that figure does not contain. It is symmetric by construction, assigning equal odds to an up move and a down move of the same size. It tells you the market expects a big reaction; it says nothing about the direction of that reaction.
Different vendors, snapping the chain at slightly different times and using slightly different methods, land on a range rather than a single figure:
- Investing.com (24 September 2026, citing Bloomberg options data): shares could move as much as 7%
- Invezz (28 September 2026): options imply roughly 8.3% either way
- Earnings-Watcher (29 September 2026): a one-standard-deviation move of about 8.7-9.7%
- Original analysis session: approximately 10%, from a $2.90 straddle on a ~$35 stock
That spread matters. It tells you the implied move is a methodological output, shaped by snapshot timing and construction, not an objective oracle. Treat any single number as gospel and you overstate its precision.
The implied move is “a price, not a prediction,” as MarketFragments frames it, shaped by who needs the trade and how badly they need it.
There is one more wrinkle that reframes how you should read the whole exercise. Across large samples of earnings events, implied moves have tended to exceed the moves that actually happen, on average. Nike’s own history shows the pattern loosely: across eight prior earnings events, the options market priced an average implied move of about 7.39%, while the stock moved an average of roughly 8.12%. Sellers charge extra to bear binary event uncertainty, and that premium, not neutral forecasting, is baked into every quote.
The NBER research on the variance risk premium documents how implied volatility around earnings announcements systematically embeds a seller’s premium above neutral forecasting, with realised volatility spiking during earnings months while implied levels carry that structural overhang before the event.
When big ASX news breaks, our subscribers know first
How elevated is the fear? Reading IV rank in context
Knowing the market has priced a 10% move is only half the picture. The next question is whether that is a lot or a little for this particular stock, and that is what implied volatility rank answers.
IV rank is a percentile. It measures where current implied volatility sits against its own range over the past 52 weeks. A rank of 80% means implied volatility is higher than it has been on 80% of the trading days in the last year. It gives you the “expensive or cheap” layer that the raw volatility percentage on its own cannot.
Here is where Nike sat across vendors in late September 2026:
| Source | Snapshot Date | 30-Day IV | IV Rank |
|---|---|---|---|
| Barchart | 30 September 2026 | 51.69% | 86.87% |
| OptionsAmurai | 23 September 2026 | 49.19% | 84-85% |
| OptionCharts.io | 30 September 2026 | 49.77% | 72.14% |
| OptiView (outlier) | 11 & 29 September 2026 | 51.8-74.2% | 28-34 |
Most sources put 30-day implied volatility in the 49-52% range and IV rank in the 70-87% band. On that reading, options premiums are elevated relative to almost anything Nike has quoted over the past year.
Then look at the OptiView row. Same stock, same week, and its rank reading collapses to 28-34. That gap is the lesson. IV rank is a methodological output, not a single objective number, and the lookback window and percentile construction a vendor uses can pull the figure in wildly different directions.
For you as a reader weighing an options position, the practical read is this. An IV rank in the 70-87% range means that for most of the past year, buying these options would have cost you less than it does today. If you are considering a straddle or long option into the event, you are paying an above-average entry price, and that cost is part of your bet whether you noticed it or not. Premium sellers, on the other side, are collecting above-average compensation. Neither fact tells you which way the stock will break.
An IV rank in the 70-87% range narrows the strategy menu considerably: strategy selection by IV regime points toward premium-selling structures when rank is elevated, and toward debit or long-option approaches when rank is depressed, a framework that applies to any stock in any earnings cycle.
Why the front week carries more than twice the volatility of December options
Here the numbers do the teaching. Look at two expirations on the same stock:
| Expiration | Days to Expiry | Implied Volatility (annualised) | Implied Move ($) |
|---|---|---|---|
| Front-week (earnings cycle) | ~3 | ~116% | ~$2.90 |
| December | ~80 | ~46% | ~$4.87 |
The front-week options carry more than 2.5 times the annualised volatility of December’s. That is the term structure: implied volatility is not uniform across expiration dates, and the pattern of how it varies tells you where the market sees risk concentrated.
Why the gap exists
The earnings report is a binary event that resolves in a few days. Traders funnel that risk into the options expiring right around the announcement, which pushes their implied volatility sharply higher. December options, by contrast, price volatility across roughly 80 days, most of which are ordinary trading sessions with macro noise and sector drift diluting the single earnings print. Spread the same event across a much longer window and its contribution to the annualised rate shrinks.
The steep drop from 116% to 46% is itself a signal. It tells you the market views the earnings report, not the months that follow, as the single dominant near-term risk driver. The more concentrated and binary traders perceive the event, the steeper that curve gets.
The dollar-move inversion
Now the counterintuitive part. December’s annualised volatility is far lower, yet its implied move in actual dollars is larger: about $4.87 against the front-week’s $2.90.
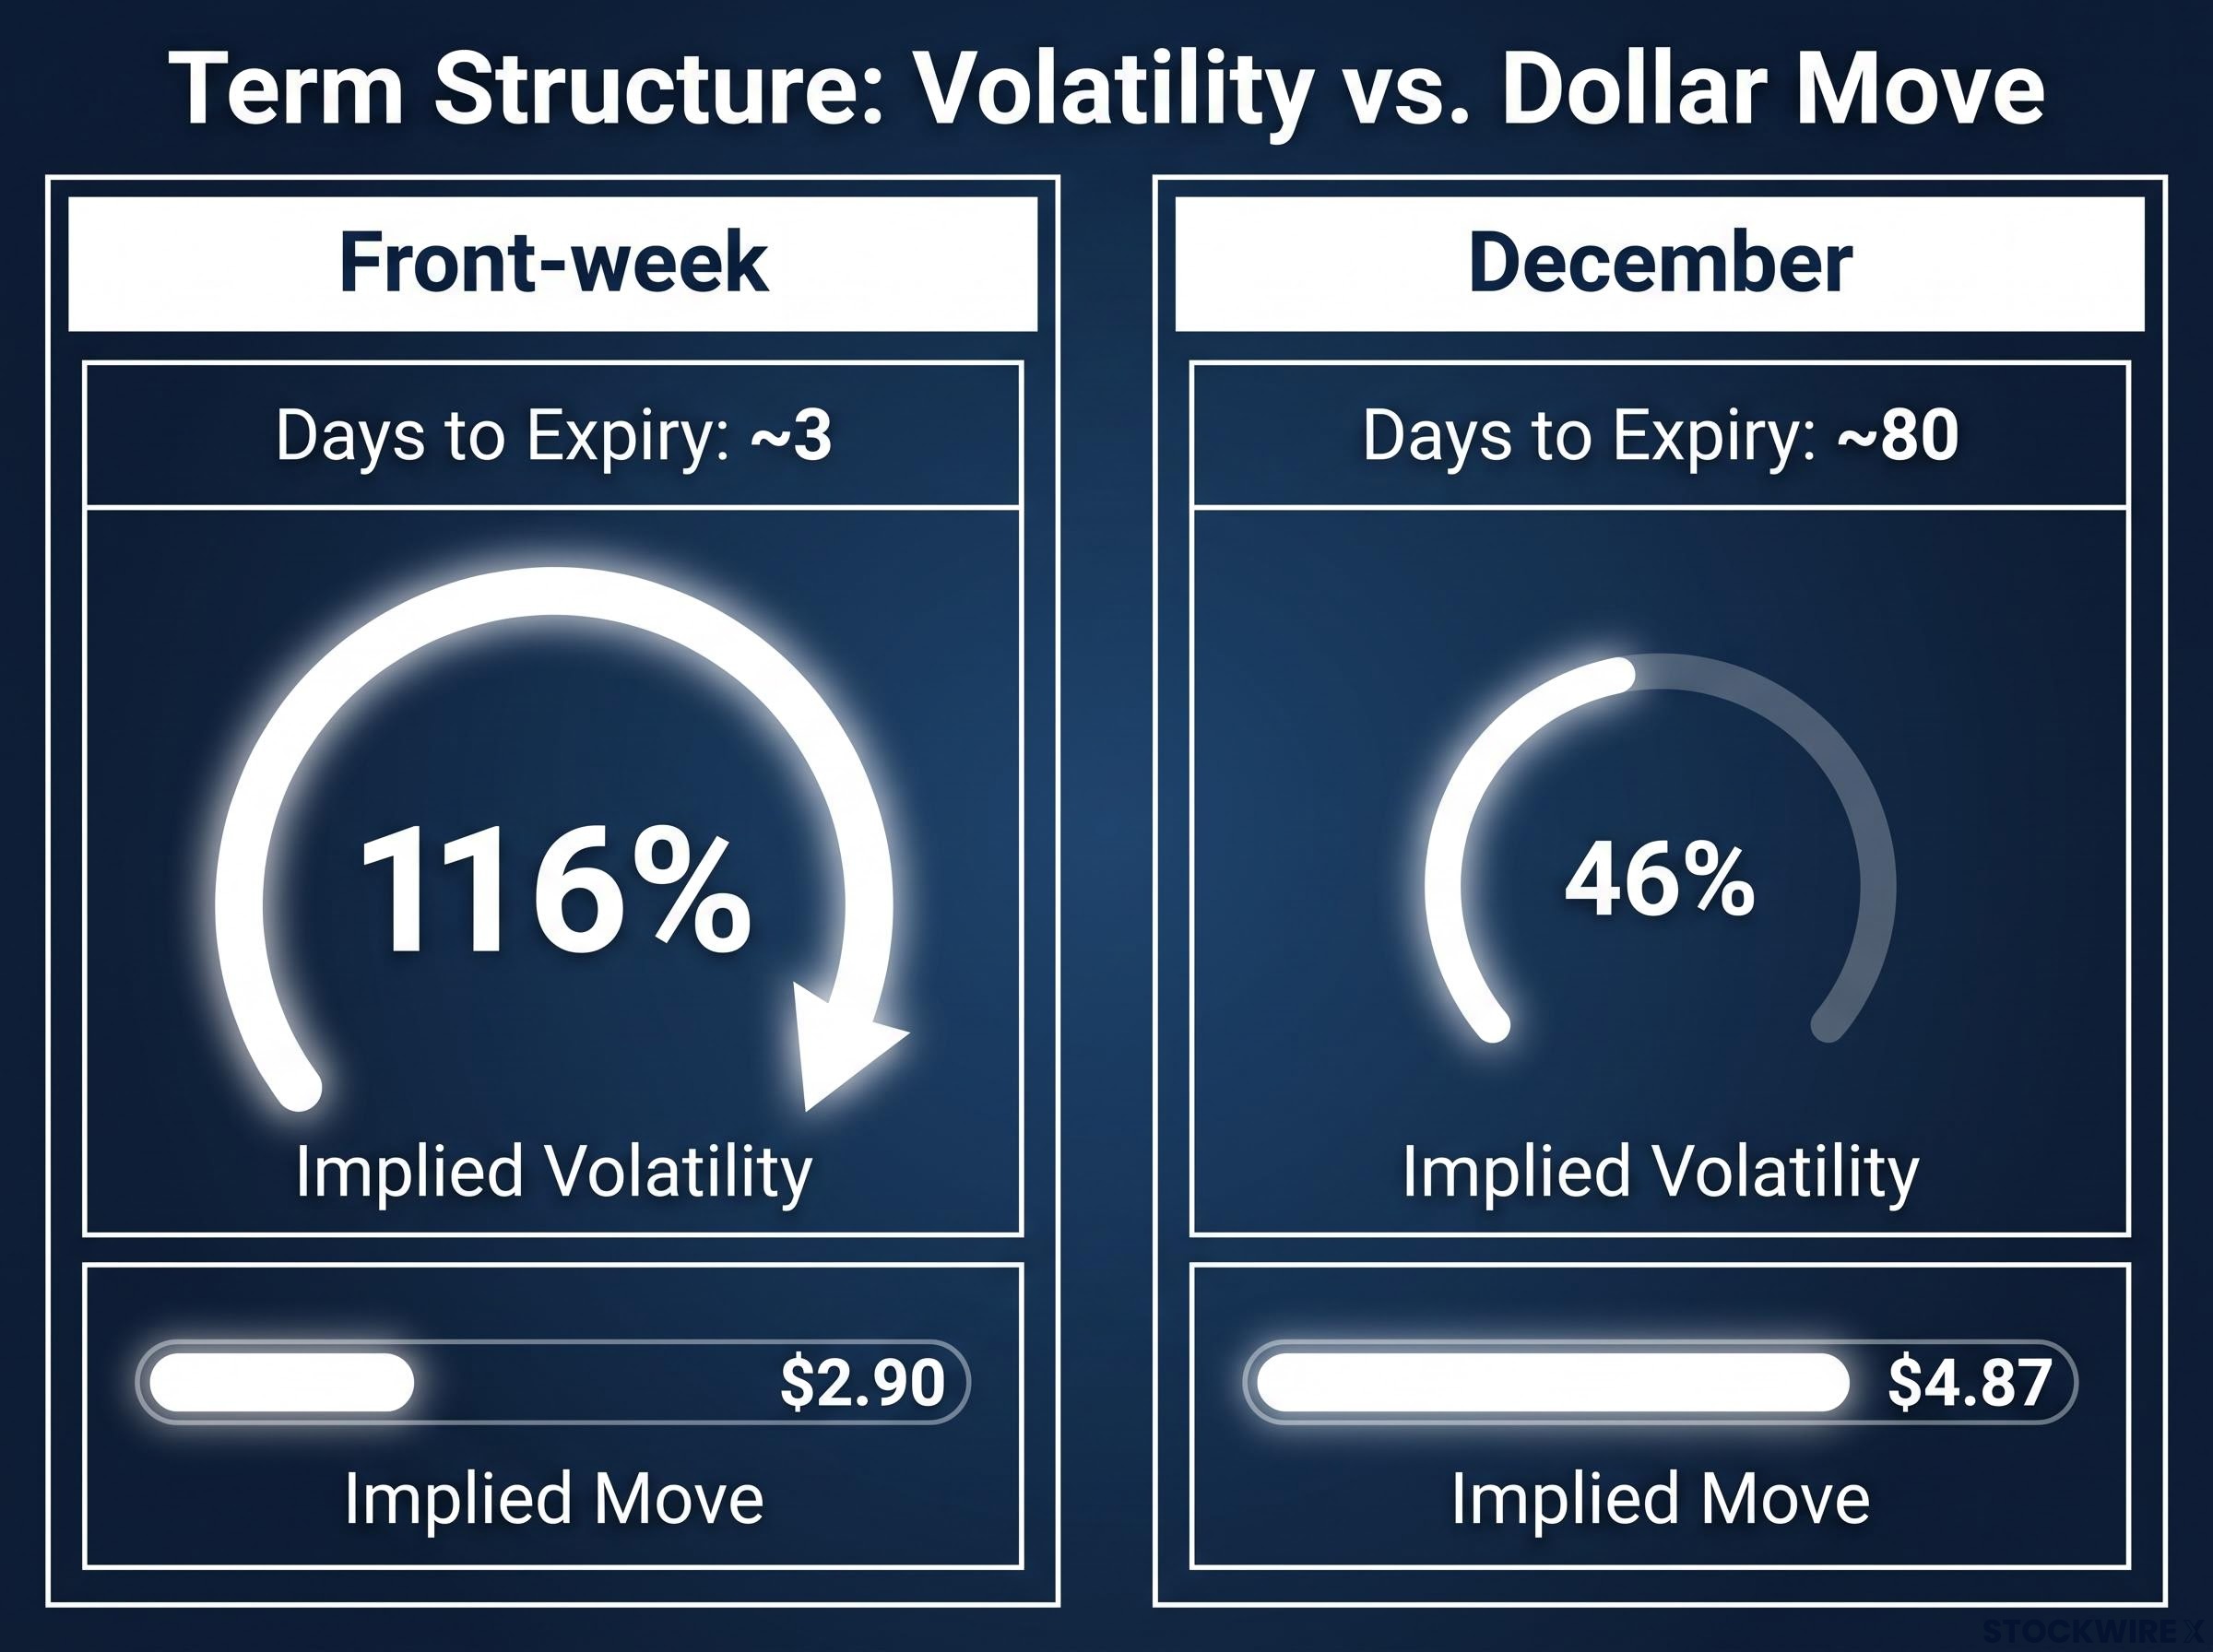
Lower annualised volatility, larger absolute move. The longer window accumulates more total variance even at a gentler annualised rate, so December’s dollar range comes out wider despite the softer headline number.
This is the trap that catches people comparing options on volatility level alone. A front-week option can quote a scarier IV number while pricing a smaller actual move than a calmer-looking longer-dated one. Read what each expiration is actually pricing, and this framework travels with you to any earnings event you look at.
For readers wanting to turn the term structure differential into a concrete trade structure, our dedicated guide to calendar spreads around earnings walks through how the front-to-back IV ratio functions as the go/no-go threshold for the strategy.
Call skew on a depressed stock: what the wings of the options market reveal about positioning
Back to the puzzle from the top: the $30 put at $0.04 and the $40 call at $0.30, equidistant from the stock, yet the call costs roughly six times the put. That asymmetry has a name.
The mechanics of call skew
Call skew is the condition where upside calls trade at higher implied volatility than equidistant downside puts. It is a reversal of the usual large-cap pattern, where downside puts carry the richer volatility because most equity investors are buying protection against a fall.
Here is the strike-level detail that makes it concrete:
| Strike | Type | Premium | Probability ITM | Distance from Spot |
|---|---|---|---|---|
| $30 (front-week) | Put | ~$0.04-$0.05 | ~4% | ~5 points down |
| $40 (front-week) | Call | ~$0.30 | Higher | ~5 points up |
| $30 (December) | Put | ~$0.70-$0.80 | ~23% | ~5 points down |
| $40 area (December) | Call | ~$1.50 | Higher | ~5 points up |
Who is buying, and why it matters
Two groups drive that upside demand in a beaten-down large-cap:
- Long investors who want inexpensive, asymmetric exposure to a recovery, buying cheap upside calls so they do not miss a sharp rebound if earnings change the narrative
- Short sellers hedging squeeze risk, for whom cheap upside calls are more useful than piling on more downside protection in a stock that has already fallen a long way
That demand pattern is why the December LEAP in the original analysis session, a call roughly 500 days from expiry, cost only about $400. Longer-dated calls let traders buy low-cost participation in a possible recovery without committing full capital.
The deeper read is what the skew implies about the risk the market actually fears. If insolvency were the operative concern, put skew would dominate, with traders paying up for downside protection. Instead, the presence of call skew signals the market’s implicit view that at these levels the asymmetry of outcomes tilts toward recovery rather than further catastrophe. ConvexTrade adds a caution worth holding: the at-the-money straddle can understate tail risk, particularly on the downside, so the wings carry information the headline move misses.
The 6-to-1 premium differential is not the options market forecasting a rally. It is a legible record of who is urgently buying what. Read it that way and you are reading positioning and sentiment, not a price target.
What these signals actually tell you, and where they fail
Now the part that keeps you honest. If implied move, IV rank, and skew were reliable forecasts, Nike’s own earnings history would show it. It shows the opposite.
| Earnings Date | Realised Move | Implied Move | Outcome vs. Implied |
|---|---|---|---|
| 26 June 2025 | +21.1% | 8.1% | Far exceeded (upside) |
| 30 September 2025 | +4.1% | 8.2% | Below implied |
| 18 December 2025 | -10.8% | 8.1% | Exceeded (downside) |
| 31 March 2026 | -15.3% | 7.6% | Far exceeded (downside) |
| 30 June 2026 | -0.3% | 9.4% | Far below implied |
Three of those rows are three different ways of being wrong. In June 2025 the stock jumped +21.1% against an 8.1% implied, blowing through the priced ceiling. In June 2026 it barely twitched, moving -0.3% against a 9.4% implied, and premium sellers pocketed the lot. In March 2026 the downside tail ran to -15.3% against a 7.6% implied, exactly the understated-tail risk ConvexTrade warns about.
The clearest single reminder of the implied move’s limits: June 2025, when the stock moved +21.1% against an implied 8.1%. The forecast was not just beaten. It was left far behind.
The variance risk premium survives on average. Across eight events the market priced roughly 7.39% implied against 8.12% realised, a modest upward bias in realised moves. But the dispersion between individual events is so wide that the average is close to meaningless for predicting the next print.
The same caution applies to IV rank. A high rank tells you options are expensive by this stock’s standards; it does not tell you they will be profitable to sell. The market can stay expensive and then move even further than priced. And remember the vendor spread, from 28 to 87 for the same stock at the same time. No single number should anchor a decision.
What you should take from all this: implied move, IV rank, and call skew describe the market’s risk-transfer economics and positioning. They are not reliable predictors of what the stock will do, and the historical record makes that distinction impossible to ignore.
The toolkit in practice: reading options structure on any earnings event
Strip away Nike and what remains is a repeatable sequence you can run on any earnings-adjacent options chain:
- Check the implied move and how it is built. Read the at-the-money straddle as a magnitude estimate and a risk-transfer price, not a direction. Nike’s ~$2.90 front-cycle move is your benchmark for scale.
- Contextualise it with IV rank. Ask whether premiums are expensive or cheap by this stock’s own standards. Nike’s 70-87% rank told you options were dear, but check more than one vendor first.
- Read the term structure. Compare front-week against longer-dated volatility. Nike’s 116% versus 46% told you the market saw the earnings print as the single dominant near-term risk.
- Examine the skew in the wings. See who is paying up for which side. Nike’s roughly 6-to-1 call-to-put premium at equidistant strikes read as positioning, not a rally call.
- Cross-check against the historical realised-versus-implied record. Let past events remind you how often the priced move misses.
Hold one frame through all five steps: these signals are about risk-transfer economics and positioning, not price forecasts. Read them that way and you interpret each one correctly.
The five-step sequence above distils into a repeatable read of options chain sentiment signals: implied move, IV rank, term structure, skew, and historical realised-versus-implied comparison together form a complete diagnostic that works on any ticker, not just beaten-down large-caps with unusual positioning.
Be honest about the ceiling, too. Options markets can be wrong, crowded, and regime-dependent, and even a flawless reading of the volatility surface does not produce a reliable prediction of the move.
This article is for informational purposes only and should not be considered financial advice. Investors should conduct their own research and consult with financial professionals before making investment decisions. Past performance does not guarantee future results.