
When BlackRock’s Rick Rieder said a diversified portfolio of high-quality short-dated bonds could yield more than 7%, he put a hard question in front of every investor holding equities. If short-term bonds pay that much with limited risk, why own stocks at all? The answer to the short term bonds vs stocks debate is less obvious than the headline suggests.
According to the original reporting from late 2022, Rieder, who oversaw fixed income at a firm managing about $8.6 trillion, described an A-minus, sub-three-year bond portfolio yielding above 7%. At the same time, stocks were earning less than the 10-year Treasury paid, a gap last seen this wide in 2002.
Treat that as a teaching case, not a live quote. Yields have moved since, and the dated October 2026 figures below show how different the numbers look on common funds today.
This explainer gives you a way to judge when high bond yields genuinely compete with equities. It also shows which market signals are worth reading without tipping you into a reflexively bearish stance.
What does a 7% short-term bond yield actually mean?
Seven per cent sounds like a Treasury rate. It is not.
Rieder’s figure described a diversified portfolio with an average credit rating of A-minus and maturities under three years. That excludes junk bonds, but it also goes beyond government debt. Even Microsoft, rated AAA (a stronger rating than the US government’s AA+ from S&P since the 2011 downgrade), had bonds yielding above 6% in that 2022 context.
A yield is also an income measure, not a promise of total return. Total return adds price changes to income, so if credit spreads widen (the extra yield lenders demand over Treasuries) or market rates rise, the value of your bond fund can fall even while it pays interest.
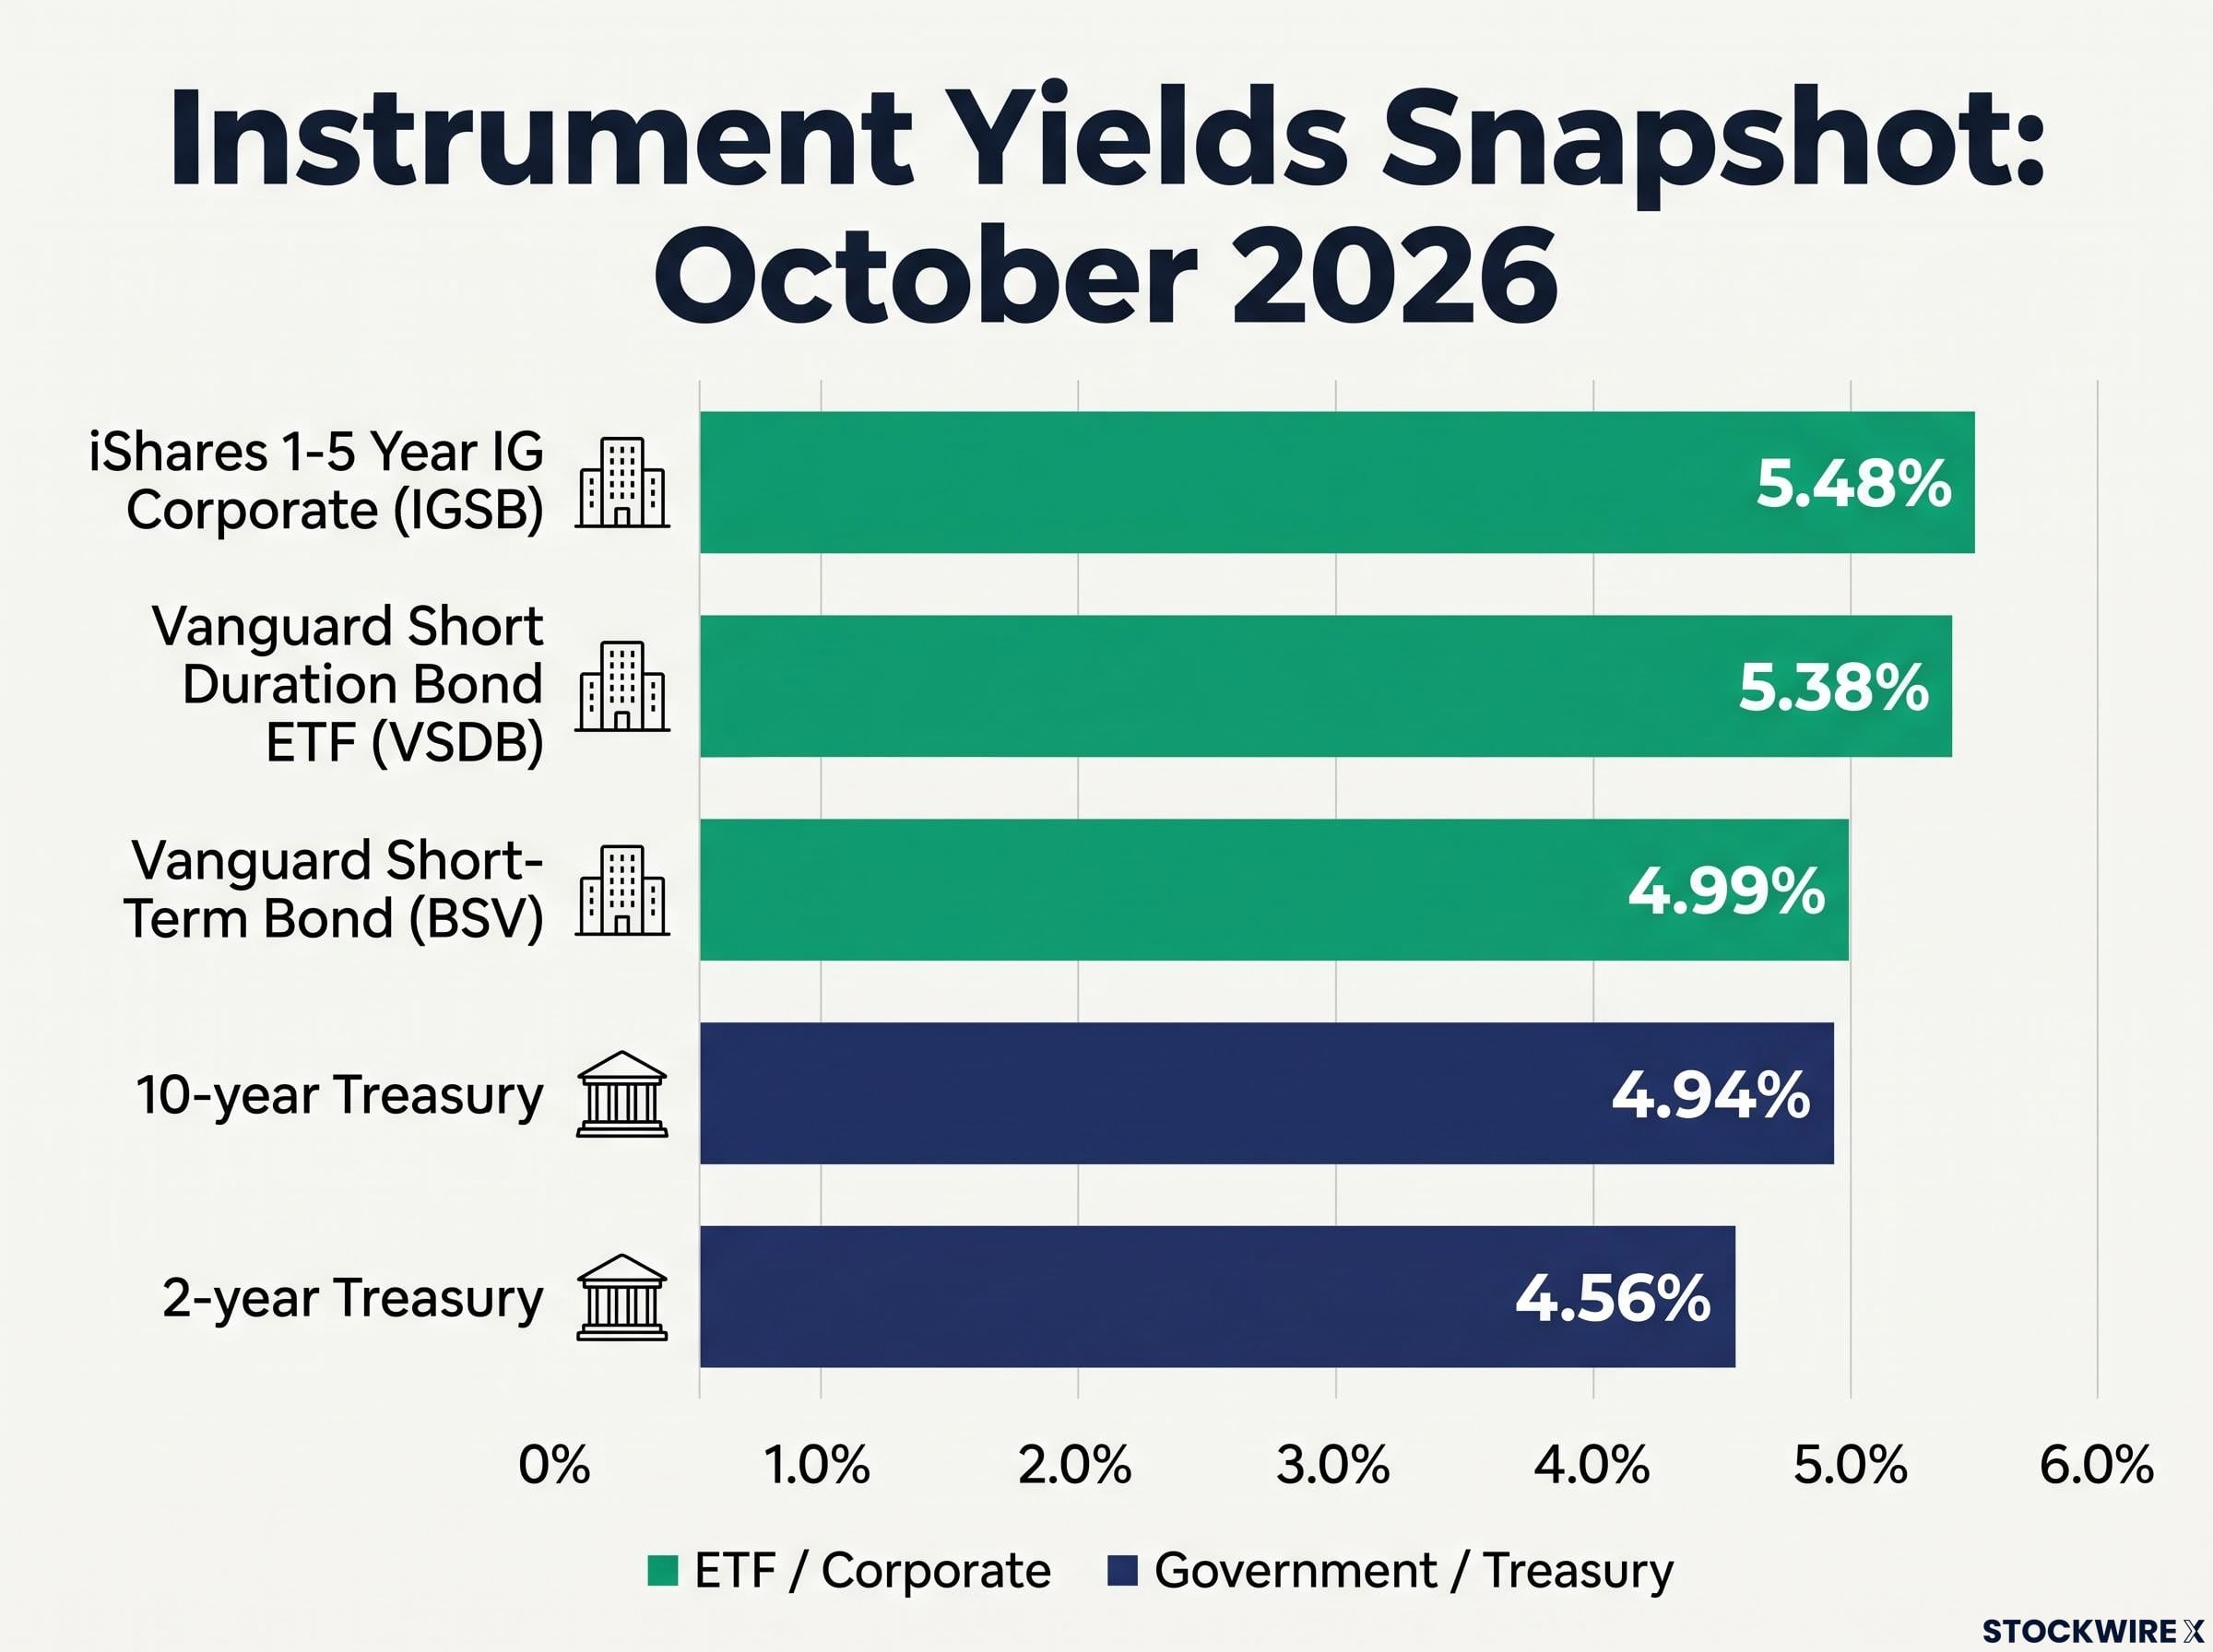
Here is how the numbers looked on widely held instruments late last month. These readings are dated October 2026 and have not been independently confirmed.
| Instrument | Yield | Date |
|---|---|---|
| 2-year Treasury | 4.56% | 30 October 2026 |
| 10-year Treasury | 4.94% | 30 October 2026 |
| Vanguard Short Duration Bond ETF (VSDB), 30-day SEC yield | 5.38% | 27 October 2026 |
| iShares 1-5 Year IG Corporate (IGSB), 30-day SEC yield | 5.48% | 29 October 2026 |
| Vanguard Short-Term Bond (BSV), 30-day SEC yield | 4.99% | 28 October 2026 |
The gap between a 7% headline and the 4.5% to 5.5% on these funds tells you something practical. Before you compare any bond yield with stocks, check what sits inside the portfolio.
Why credit quality and maturity change the number
Treasuries carry the least credit risk and the lowest yields. A-minus corporates pay more because a company can be downgraded or default. Reaching 7% typically requires a further step into securitised assets, structured exposures or active management, each with its own risks.
Rieder himself flagged the trade-off, as reported in a CNBC interview this October (not independently confirmed):
Rieder’s caution Yields this high generally appear alongside economic or default concerns.
Short maturity limits the damage when rates rise, because the bonds are repaid quickly. The flip side is reinvestment risk: the chance you must reinvest maturing money at lower rates. If the Federal Reserve (Fed) cuts, your next bond could pay noticeably less than your last.
Your exposure to rising rates depends on bond duration, the fund fact sheet figure that shows roughly how many percentage points of price you lose for each 1 point rise in yields.
When big ASX news breaks, our subscribers know first
Do stocks really struggle when yields top 5%?
Intuition says yes. If bonds pay 5%, why accept equity risk? History pushes back hard.
The long-run record Since 1991, in periods when the 10-year Treasury yielded above 5%, stocks still returned 12.6% a year, according to the original source.
That figure alone does not settle it, because the experience inside those years varied enormously. A 2026 review of periods when the 30-year Treasury sat above 5% (not independently confirmed) shows the spread of outcomes.
| Period | Environment | S&P 500 result |
|---|---|---|
| 1980s-1998 | 30-year generally above 5% | One of the strongest long-term advances in US history |
| 1999-2004 | 30-year above 5% for much of the period | About 1% annualised; about -37% cumulative from 2000-2002 |
| 2006 | Briefly above 5% | About +16% |
Same yield threshold, opposite results. The review concluded that the level of rates explained little on its own. Four conditions did more of the work:
- Starting valuation: higher discount rates squeeze price-to-earnings multiples hardest when stocks begin expensive, as they did in 1999.
- Earnings growth: fast-growing profits can carry stocks higher even when yields are elevated.
- Inflation: a high nominal yield may simply reflect expected inflation rather than a strong real return.
- Economic cycle: yields high because of strong growth behave differently from yields high because of fiscal stress or credit worries.
Valuation is where today’s debate sharpens. A stock’s earnings yield is its earnings divided by its price, the equity equivalent of a bond’s yield. By one nominal measure in October 2026, the S&P 500’s forward earnings yield of about 5.3% left a spread near 0% over the 10-year. Goldman Sachs, comparing against the inflation-adjusted 10-year yield, put the gap at about 270 basis points in September. Neither figure has been independently confirmed, and they differ because they use different Treasury inputs.
Rising discount rates hit growth stock valuations hardest because distant cash flows are worth less today, which is why starting valuation mattered so much in 1999.
Treat all of this with humility. There are few distinct modern episodes, and results shift depending on which maturity you use, whether yields are nominal or real, and when the period starts.
A single yield threshold cannot tell you to sell stocks. What matters for you is what you pay for earnings and how fast those earnings grow.
How do volatility, breadth and skew help you read the market?
If yields alone cannot settle the question, the options market offers a second lens. The original source leaned on three signals. Each looks simple on a screen and is more nuanced underneath.
| Signal | What it measures | What it cannot tell you |
|---|---|---|
| VIX futures curve | How near-term versus later volatility is priced | Whether a sudden shock is coming |
| Breadth | How many stocks are joining an index move | Whether a rally will last |
| Put skew | The price of downside insurance | Whether the market will fall |
The readings below come from two separate dated snapshots, October 2022 and October 2026. Read them side by side, not as one series.
VIX futures contango
The VIX measures expected near-term S&P 500 volatility. Contango means later futures contracts price above nearer ones; backwardation is the reverse. In 2022, with the VIX in the teens, futures ran 16.85, 18.55, 18.73 and 19.75, and the presenter argued contango made a violent sell-off harder.
Contango suggests an orderly market, not a safe one. The curve can flip into backwardation fast. The 2026 snapshot (not independently confirmed) showed spot VIX at 19.68 and the December future at 20.54, still in contango.
Breadth and rotation
Breadth here means the share of S&P 500 stocks trading above their 50-day moving average, their average price over the past 50 trading days. In early October 2022 it hit a year low of about 22%, then recovered above 50% while the index itself barely moved. Money was rotating from megacaps into smaller companies.
A similar move appeared this autumn, with breadth rising from roughly 20% in late September to 65.8% by 30 October 2026 (not independently confirmed). Broader participation is healthier, but bear-market rallies can produce sharp rebounds too.
Put skew
Skew compares option prices across downside and upside strikes. In 2022, SPX options showed slight put skew, meaning downside protection cost a little more, while calls were still strongly bid. Put skew is normal in SPX and does not predict a fall.
Skew complements the VIX: one prices how big moves might be, the other prices fear of the downside specifically. Markets can rally while skew stays elevated.
Together, these signals tell you whether the market looks orderly but hedged. That is a reason to stay measured rather than bearish, never a trigger to buy or sell.
How can you weigh bonds against stocks without going reflexively bearish?
The real distinction is time. Short bonds offer income certainty over a short holding period; stocks offer wealth accumulation over a long one.
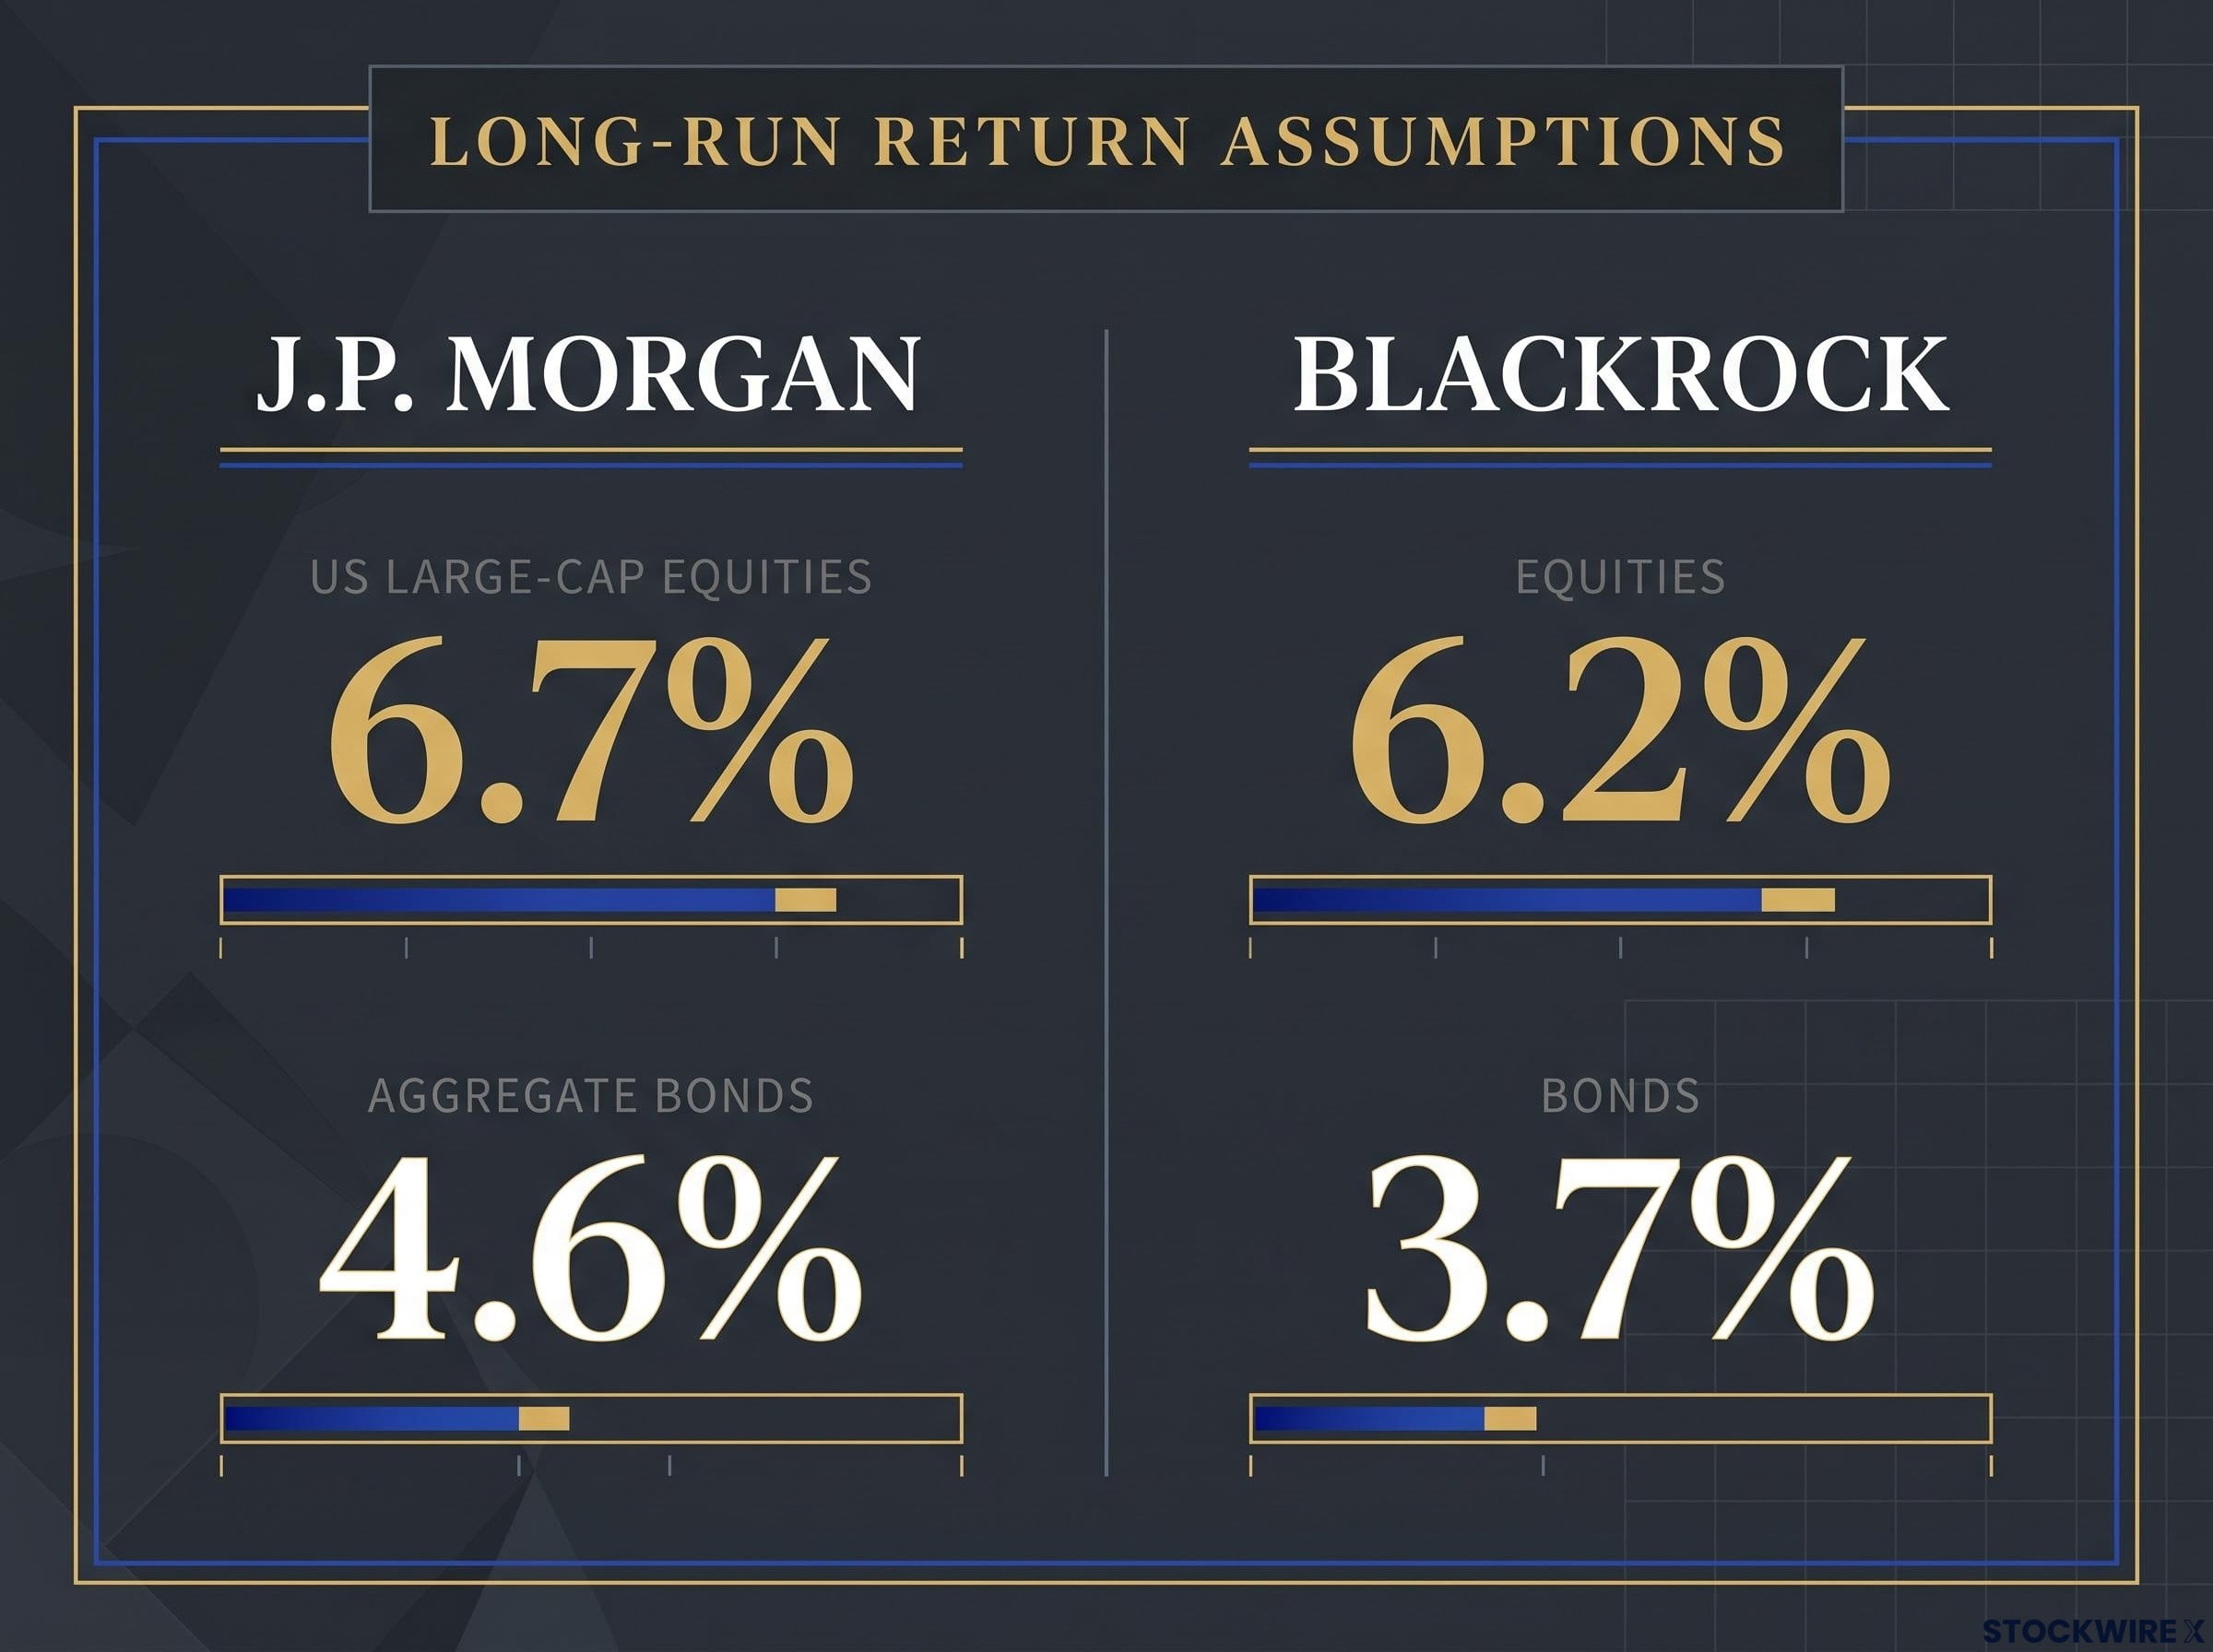
Institutional views reflect this split (not independently confirmed). Vanguard frames short-duration funds as defensive income holdings rather than replacements for long-term stock growth, and Morningstar calls stocks the superior long-term growth engine. J.P. Morgan’s long-run assumptions put US large-cap equities at about 6.7% a year against 4.6% for aggregate bonds, while BlackRock’s assumptions sit at about 6.2% versus 3.7%. These are projections, and past performance does not guarantee future results.
Every option carries a cost. Here are the trade-offs to weigh.
| Risk | Why it matters |
|---|---|
| Reinvestment | If the Fed cuts, maturing bonds roll into lower yields |
| Inflation | A nominal yield can shrink sharply in real terms |
| Tax drag | Bond interest is generally taxed as ordinary income federally; qualified dividends and long-term gains may face lower rates |
| Credit | Investment-grade bonds can still be downgraded or see spreads widen |
| Missed equity rallies | Earnings growth can lift stocks despite high yields, as in 2006 |
| Behavioural timing | Moving to bonds after a decline can lock in losses and make re-entry hard |
History supplies both sides. 2000-2002 is the strongest case for cutting equities: valuations were extreme and earnings expectations collapsed. The 2023-2024 move into cash and money-market funds shows the opposite risk, because those yields proved temporary and missed equity earnings growth.
A blend often fits better than a verdict. Short bonds can cover money you need within a few years, while stocks do the long-term compounding. Before shifting your allocation, ask:
- When do you need this money? Near-term spending suits short bonds; decades-away goals suit equities.
- What is your after-tax yield? Compare bond income against dividends and gains on the same tax basis.
- What credit quality are you buying? Know whether a yield comes from Treasuries, corporates or structured exposure.
- How would you react to a drawdown? If a 30% fall would push you to sell, size your equity holding accordingly.
Your time horizon, tax position and need for near-term cash should set the mix, not one yield figure or one signal reading.
For readers deciding whether to sell, shorten or hold, our full explainer on bond investing strategy when yields rise covers bond ladders and why selling after a rate jump can lock in losses.
What a high-yield bond market changes, and what it leaves alone
High short-term bond yields make bonds a credible home for near-term money. They do not erase the long-run role of equities, which history shows can deliver strong returns even when the 10-year sits above 5%, depending on valuation and earnings growth.
The 2022 figures here are a teaching case, and the 2026 readings are dated snapshots. Check current yields and signals fresh before acting.
Before changing your allocation, run through the variables: the credit quality inside any bond portfolio, its after-tax and after-inflation yield, your own time horizon, and what the VIX curve, breadth and skew say about how orderly the market is. If all of them point the same way, you have a decision. If they do not, a blend may serve you better than a switch.
This article is for informational purposes only and should not be considered financial advice. Investors should conduct their own research and consult with financial professionals before making investment decisions.