Gold fell about 2.7% to roughly US$3,910 an ounce in the 29 October session, even as investors were buying US Treasuries. If gold is meant to be a hedge, a bond rally alongside a gold slide looks like failure. That reading confuses a cash scramble with a broken gold price outlook.
The selloff has pushed gold into a deeper hole. Spot gold traded near $3,980.40 on 30 October 2026, according to Reuters, a 3½-month low. The metal is on track for a 4.3% fall in October and sits about 7.9% below where it ended 2025.
That follows a gain of roughly 65-66% last year, the strongest since 1979. When an asset swings that hard in both directions, a short-term price move can easily be mistaken for a verdict on the long-term thesis.
Here is how to separate the positioning-driven drop from the multi-year case for gold, and which holding period the metal actually suits.
Why did gold fall 2.7% while Treasuries rallied?
The drop did not come out of nowhere. On 22 October, gold had already shed 2.4% to $4,041.39, and Reuters tied both that day and the 29 October fall to investors reassessing Federal Reserve policy, higher oil prices and expectations that rates would stay elevated for longer.
That macro trigger is only the first layer. Underneath it sit several forces that often arrive together.
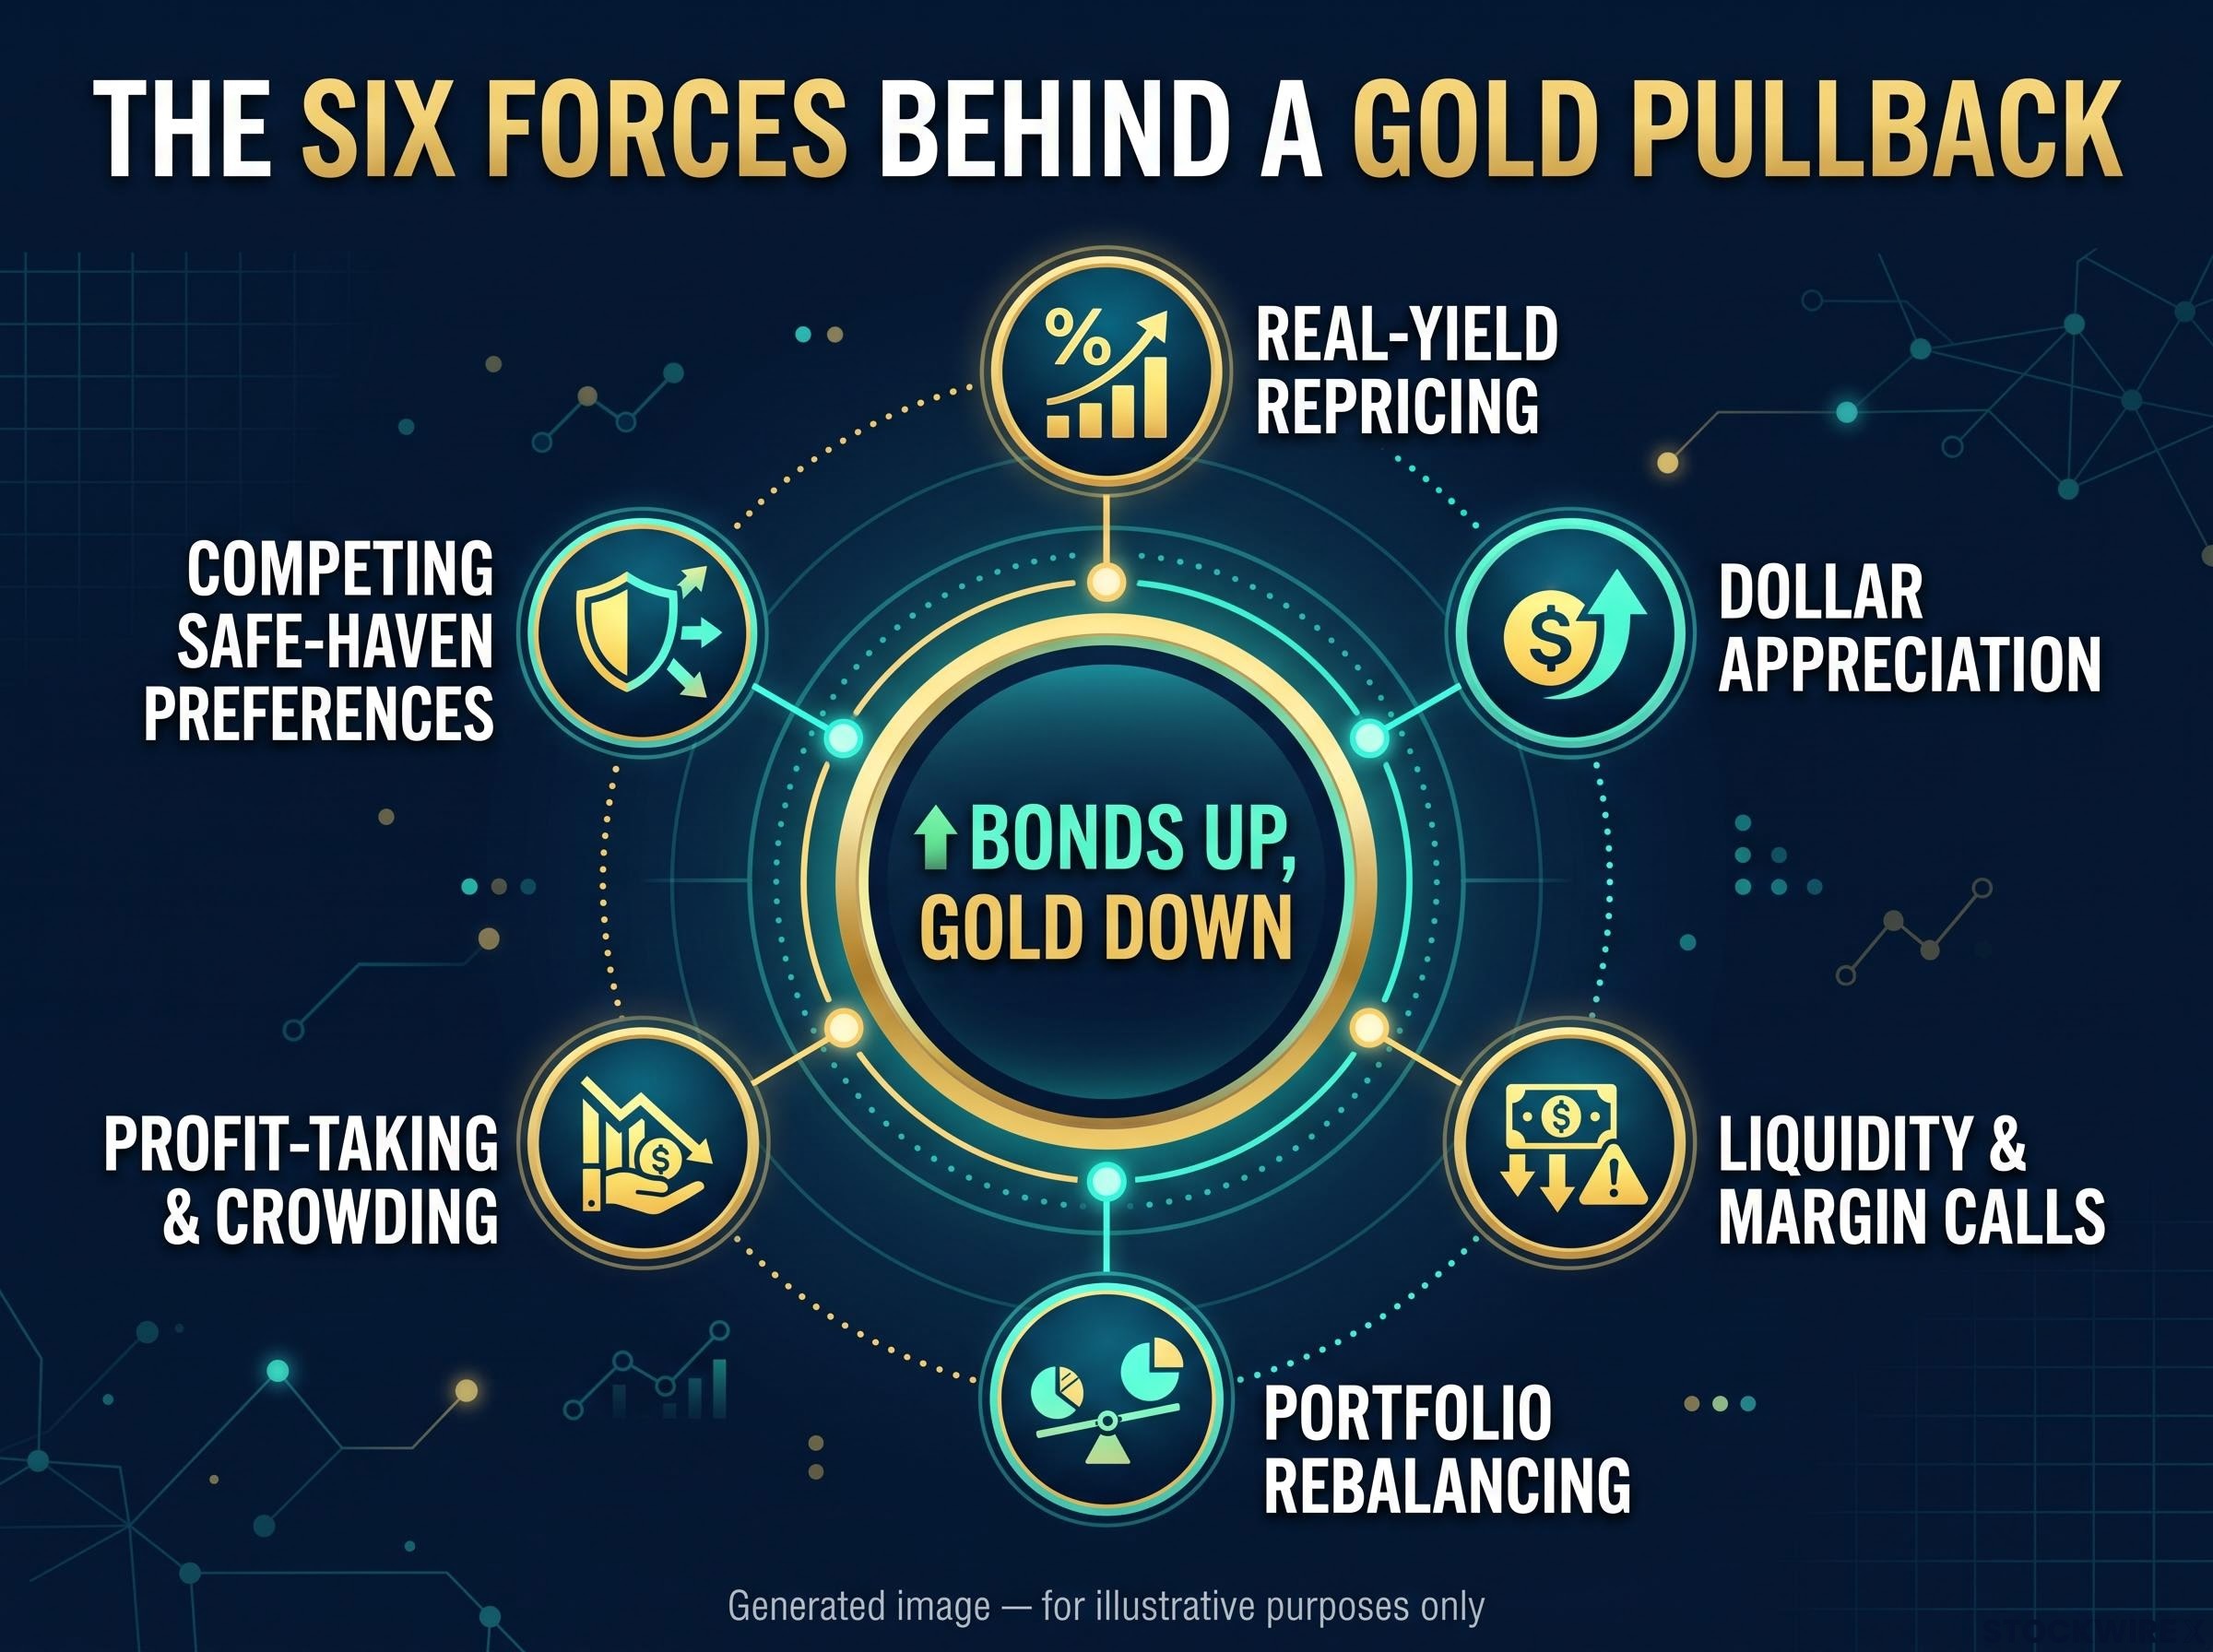
The six forces behind a bonds-up, gold-down day
- Real-yield repricing. Real yields are bond returns after inflation, and when they rise, holding gold (which pays no income) costs more in forgone returns.
- Dollar appreciation. A stronger dollar makes gold more expensive for non-US buyers and often signals tighter financial conditions.
- Liquidity and margin calls. A margin call is a demand from a broker for more cash when a leveraged position loses value, and gold is easy to sell quickly to raise it.
- Portfolio rebalancing. Systematic strategies can sell gold automatically once volatility rises or momentum turns, regardless of anyone’s long-term view.
- Profit-taking and crowding. After a very large rally, many holders cut exposure simply because their gains are large.
- Competing safe-haven preferences. In an acute cash shock, investors tend to favour cash and short-dated Treasuries over gold.
Put those together and the paradox starts to look familiar. Treasuries can rally as liquid collateral while gold is sold precisely because it is liquid.
What the strategists say
The institutional explanations line up closely.
| Source | Timeframe | Explanation |
|---|---|---|
| Suki Cooper, Standard Chartered (via Kitco) | 27 October 2026 | Margin calls and cash needs; speculative exposure cut for eight straight weeks to the lowest since May; at least 350 tonnes of ETP holdings moved into loss |
| J.P. Morgan Asset Management | August 2026 | Higher real yields, stronger dollar, ETF outflows and technical selling; roughly 25% pullback from the January high |
| WisdomTree | March 2026 | Monthly fall of about 12%, the worst since 2013, driven by liquidity-driven deleveraging and rising real yields |
| OCBC (Sim Moh Siong, Christopher Wong) | October 2026 | Gold’s failure to benefit from lower Treasury yields pointed to broader deleveraging |
The read for you is straightforward. A bonds-up, gold-down day tells you cash was in demand, not that the debasement argument has been refuted, so treat it as a signal about flows rather than fundamentals.
When big ASX news breaks, our subscribers know first
Crowded beta-1 hedging: what Carzan means by a positioning-driven drop
Market strategist Jim Carzan offers a sharper version of the flows story. In his view, the drop was about who owns gold and how they own it.
Jim Carzan on crowded hedging Carzan argues many investors hold gold as a beta-1 hedge, particularly risk-parity-style allocators for whom it worked in 2022, so crowded positioning can hurt it. He also notes that most investors do not use options.
A risk-parity portfolio aims to have equities, bonds and commodities each contribute a similar amount of volatility. When volatility in one asset jumps, or a technical level breaks, the model cuts that exposure mechanically.
A beta-1 hedge, in Carzan’s usage, means gold held as a broad, uniform protection against market stress. That works while few people share the trade, and becomes fragile when many holders run the same playbook and sell at once.
The 2022 record explains why the trade grew so popular. The World Gold Council (WGC) found gold returned roughly -0.4% to +0.7% that year despite a 250 basis point rise in 10-year TIPS real yields and a dollar gain above 8%. Holding steady through that was a strong advertisement.
The crowding then showed up in the numbers:
- ETF flows: 801.2 tonnes of inflows in 2025, worth about $82 billion, with total demand above 5,000 tonnes for the first time (WGC)
- Price setting: J.P. Morgan said ETF flows had become the marginal price setter
- Speculator cuts: eight consecutive weeks of falling exposure, per Cooper
- Underwater holdings: at least 350 tonnes of ETP holdings in loss
The risk-parity explanation rests on the original source’s account of Carzan’s view. Public sources discuss deleveraging and crowded exposure, but no primary note was found attributing the move specifically to risk parity.
If your gold exposure comes through ETFs or a systematic allocation, you are part of the same flow that can amplify a drop. Size and holding period matter as much as the thesis.
The 2026 gold bear market offers the clearest precedent: rising real yields and a firmer dollar overrode war, oil disruption and inflation data, while crowded positioning after the 2025 rally amplified the slide to a trough near $4,070 in June.
The long-term case: debasement risk, FX and gold volatility, and the 1970s precedent
Strip away the positioning noise and a different argument emerges. Carzan believes FX volatility and gold volatility are the most valuable volatility to own structurally over the next 5 to 10 years, because Fed and Treasury control may erode and currency debasement (a loss of a currency’s purchasing power) could trigger large exchange-rate moves.
Central bank reserve diversification is increasingly price-insensitive, with sovereign buying running near 1,000 tonnes a year and a survey showing more institutions intending to cut dollar holdings than raise them, which supports the structural bid under dips.
What supports a 5-to-10-year view
- Reserve diversification: central banks bought 1,092.4 tonnes in 2024 and 863.3 tonnes in 2025 (WGC, 29 January 2026)
- Fiscal credibility doubts: Reuters reported in October 2025 that investors were increasingly reluctant to treat long-dated Treasuries as the automatic safe haven; on 1 October 2026, it noted gold held above $4,000 as Treasury yields surged
- Broadening demand: returns of 14.0% in 2023, 25.8% in 2024 and 65.4% in 2025 (LBMA series)
- FX volatility as a complement: a loss of confidence in a currency may appear in exchange rates before conventional inflation data
Carzan’s expected path is dramatic: a grind higher with bounces, then a sudden 20% one-day jump, followed by a possible 100% gain in a quarter. That is his forecast, not established fact.
What history and the data warn about
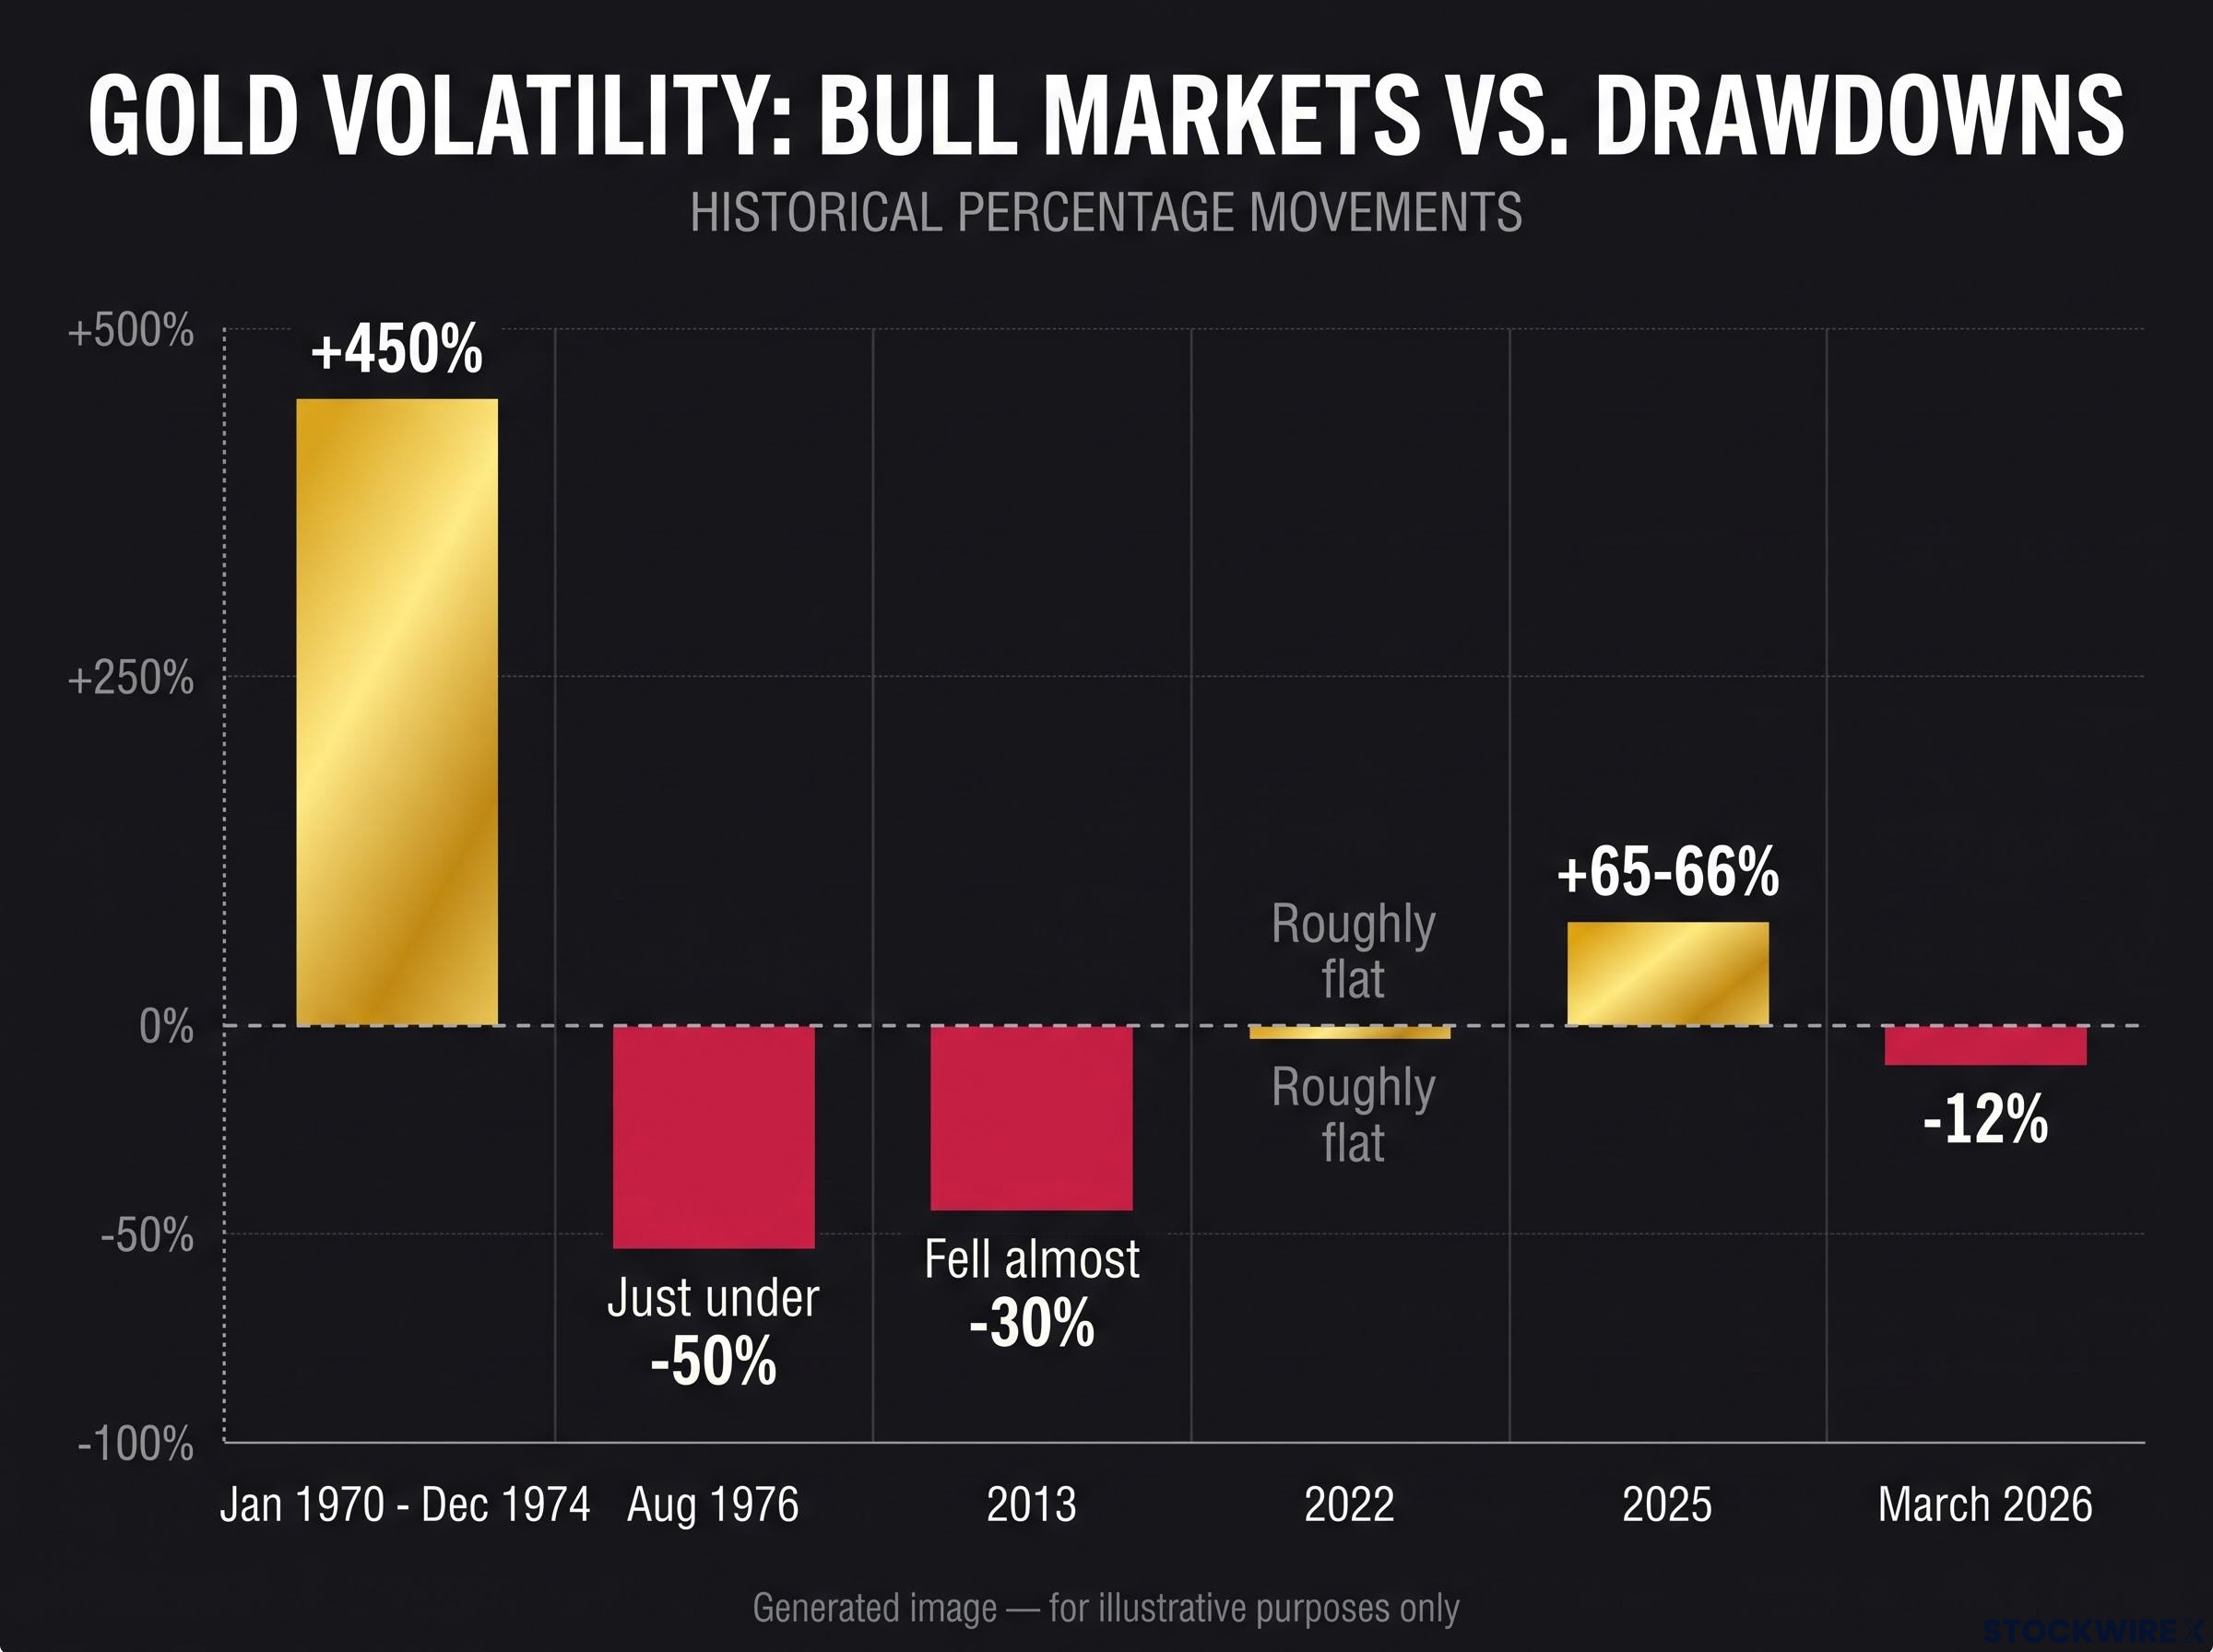
The 1970s, which Carzan calls gold’s best-performing and most volatile decade, cut both ways. Gold rose about 450% from January 1970 to December 1974, fell just under 50% to August 1976, then advanced again into 1980.
| Case | What happened | Relevance |
|---|---|---|
| 1970s | About +450%, then just under -50% before resuming | A huge drawdown did not end the bull market |
| 2013 | Fell almost 30% as real yields and the dollar rose | Demand composition shapes the response to rates |
| 2022 | Roughly flat despite surging real yields | Retail and central-bank buying cushioned selling |
| 2025 | Up about 65-66% | Set up profit-taking and crowding |
| March 2026 | About -12% in a month | A bullish asset can be sold in a cash squeeze |
The risks are real. Central-bank buying fell 21% in 2025, gold pays no cash yield, ETF liquidation can overwhelm physical demand in the short run, and gold suffered a roughly 71% drawdown between 1980 and 2000. The WGC also found record prices weakened jewellery demand.
The multi-year case rests on gold hedging a different regime, currency debasement and fiscal stress. Judge it against that regime, not against whether it rises on every stock or bond selloff.
Why gold is a poor vehicle for trades lasting days or weeks
Those two layers, flows in the short run and regime risk in the long run, explain why gold behaves so badly as a short-term trade. On any given week, its price answers to real yields, the dollar, ETF flows, futures positioning, margin requirements, technical levels and headlines, all at once.
The difficulty of timing gold is structural: with no cash flows or valuation anchor, past rate cycles repeatedly contradicted the most popular trading rules, which is why days-or-weeks trades expose holders to positioning risk.
The 2026 numbers show the cost. A metal that gained about two-thirds last year is down about 7.9% year to date, with October alone on track for -4.3%.
Jim Carzan on holding period Carzan’s guidance is that gold should not be used for trades lasting days, weeks or even a month.
He pairs that with a broader framework for managing portfolio risk:
- Own quality businesses. Hold cash-flow-generating companies that can survive a real downturn, rather than speculative names.
- Diversify into non-correlated strategies. He lists merger arbitrage, trend following and long/short credit among options, and argues bonds do not help.
- Rebalance using hedges. He likens hedges to brakes on a race car, which let you take more risk with control.
- Use options precisely. Shape exposure across outcomes, and monetise puts when they pay off so capital can be redeployed.
Carzan puts the S&P 500’s long-term Sharpe ratio, a measure of return per unit of risk, at about 0.5, which he calls poor. He claims optimised risk-adjusted returns could be around 500% better, a claim that is his own.
The practical rule follows. If you cannot tolerate a 20-50% swing, gold belongs as a strategic holding sized for years, not a tactical bet, because short-term trading exposes you to exactly the positioning risk behind this week’s drop.
What the pullback changes, and what it does not, for your gold price outlook
The pullback changes the short-term picture: positioning, liquidity, real yields and the dollar have turned against gold. It does not, on the evidence so far, overturn the long-term thesis built on debasement risk, central-bank demand and structural FX and gold volatility.
Three variables deserve your attention:
- Real-yield direction, the clearest pressure on a non-yielding asset
- The dollar, which shapes demand from non-US buyers
- ETF and speculative positioning, alongside whether central-bank buying holds near 2025 levels
The decision comes down to matching horizon to instrument. Carzan’s forecasts are his views, not established facts, and gold’s history rewards patience far more than timing.
The relationship between gold and real yields has also been weakening since 2022-2023, as central-bank accumulation and doubts over policy credibility have at times let gold rise even while real yields climbed.
These statements are speculative and subject to change based on market developments. Past performance does not guarantee future results.
This article is for informational purposes only and should not be considered financial advice. Investors should conduct their own research and consult with financial professionals before making investment decisions.