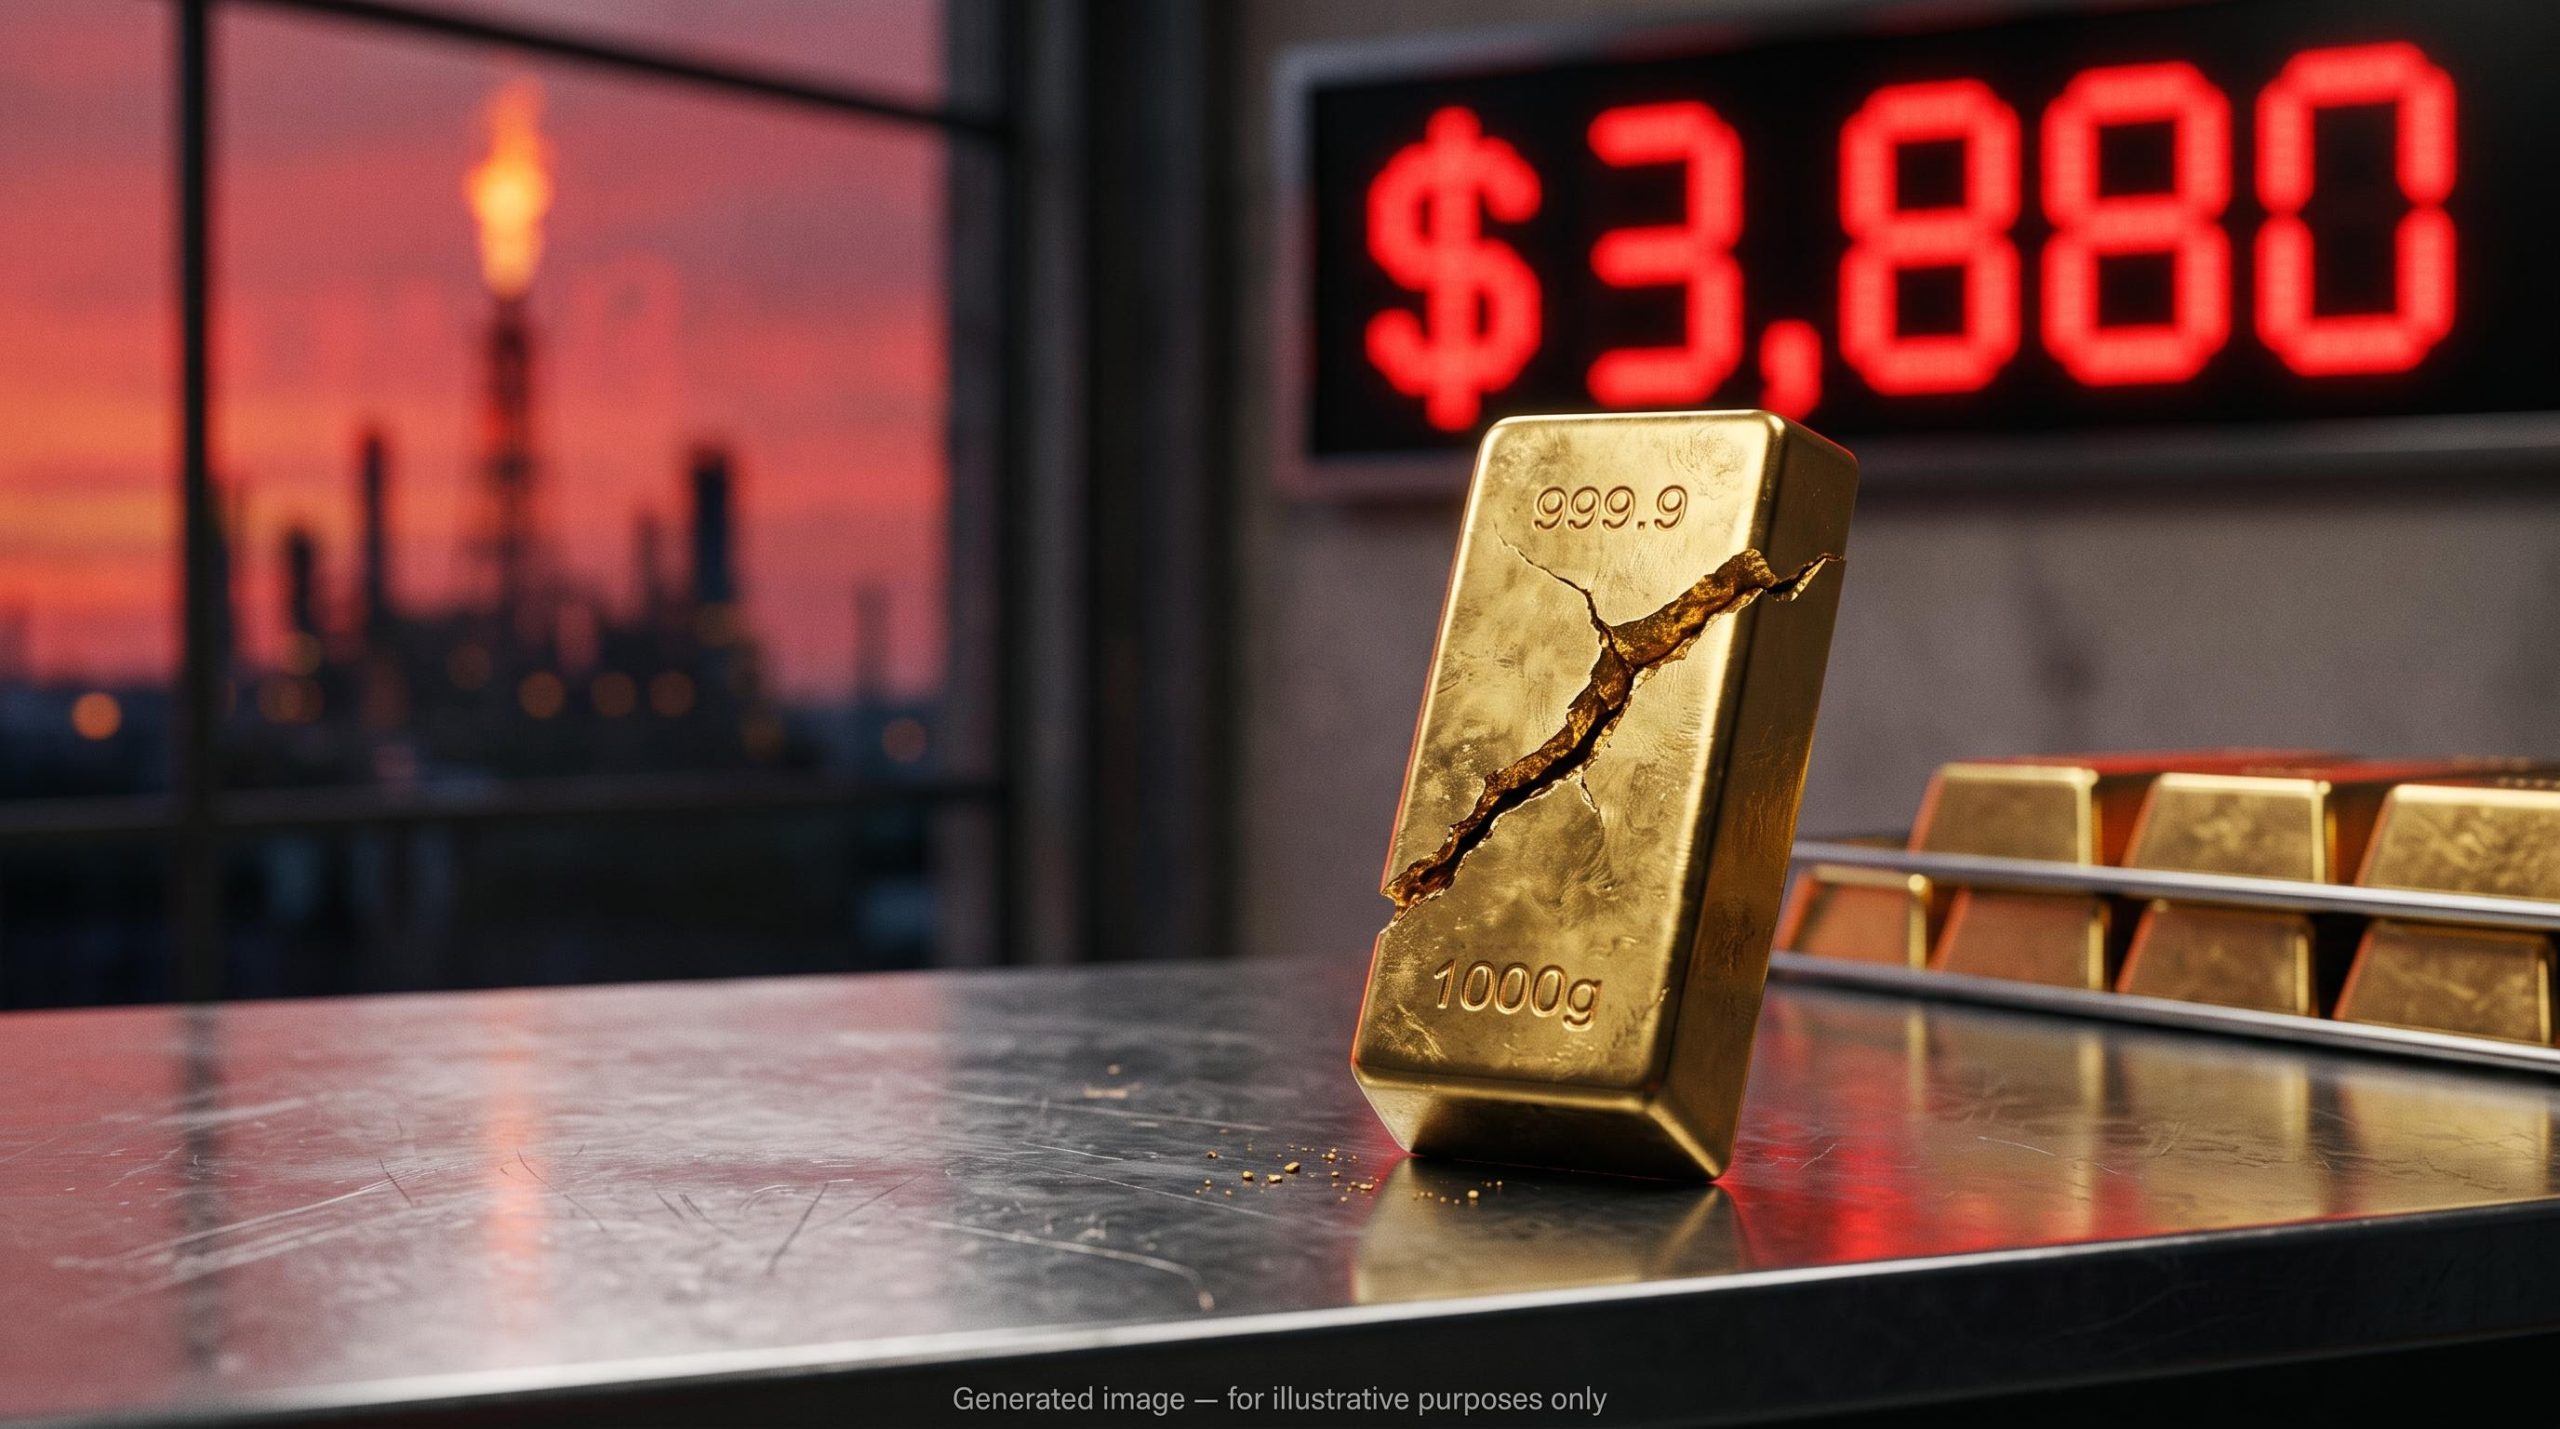
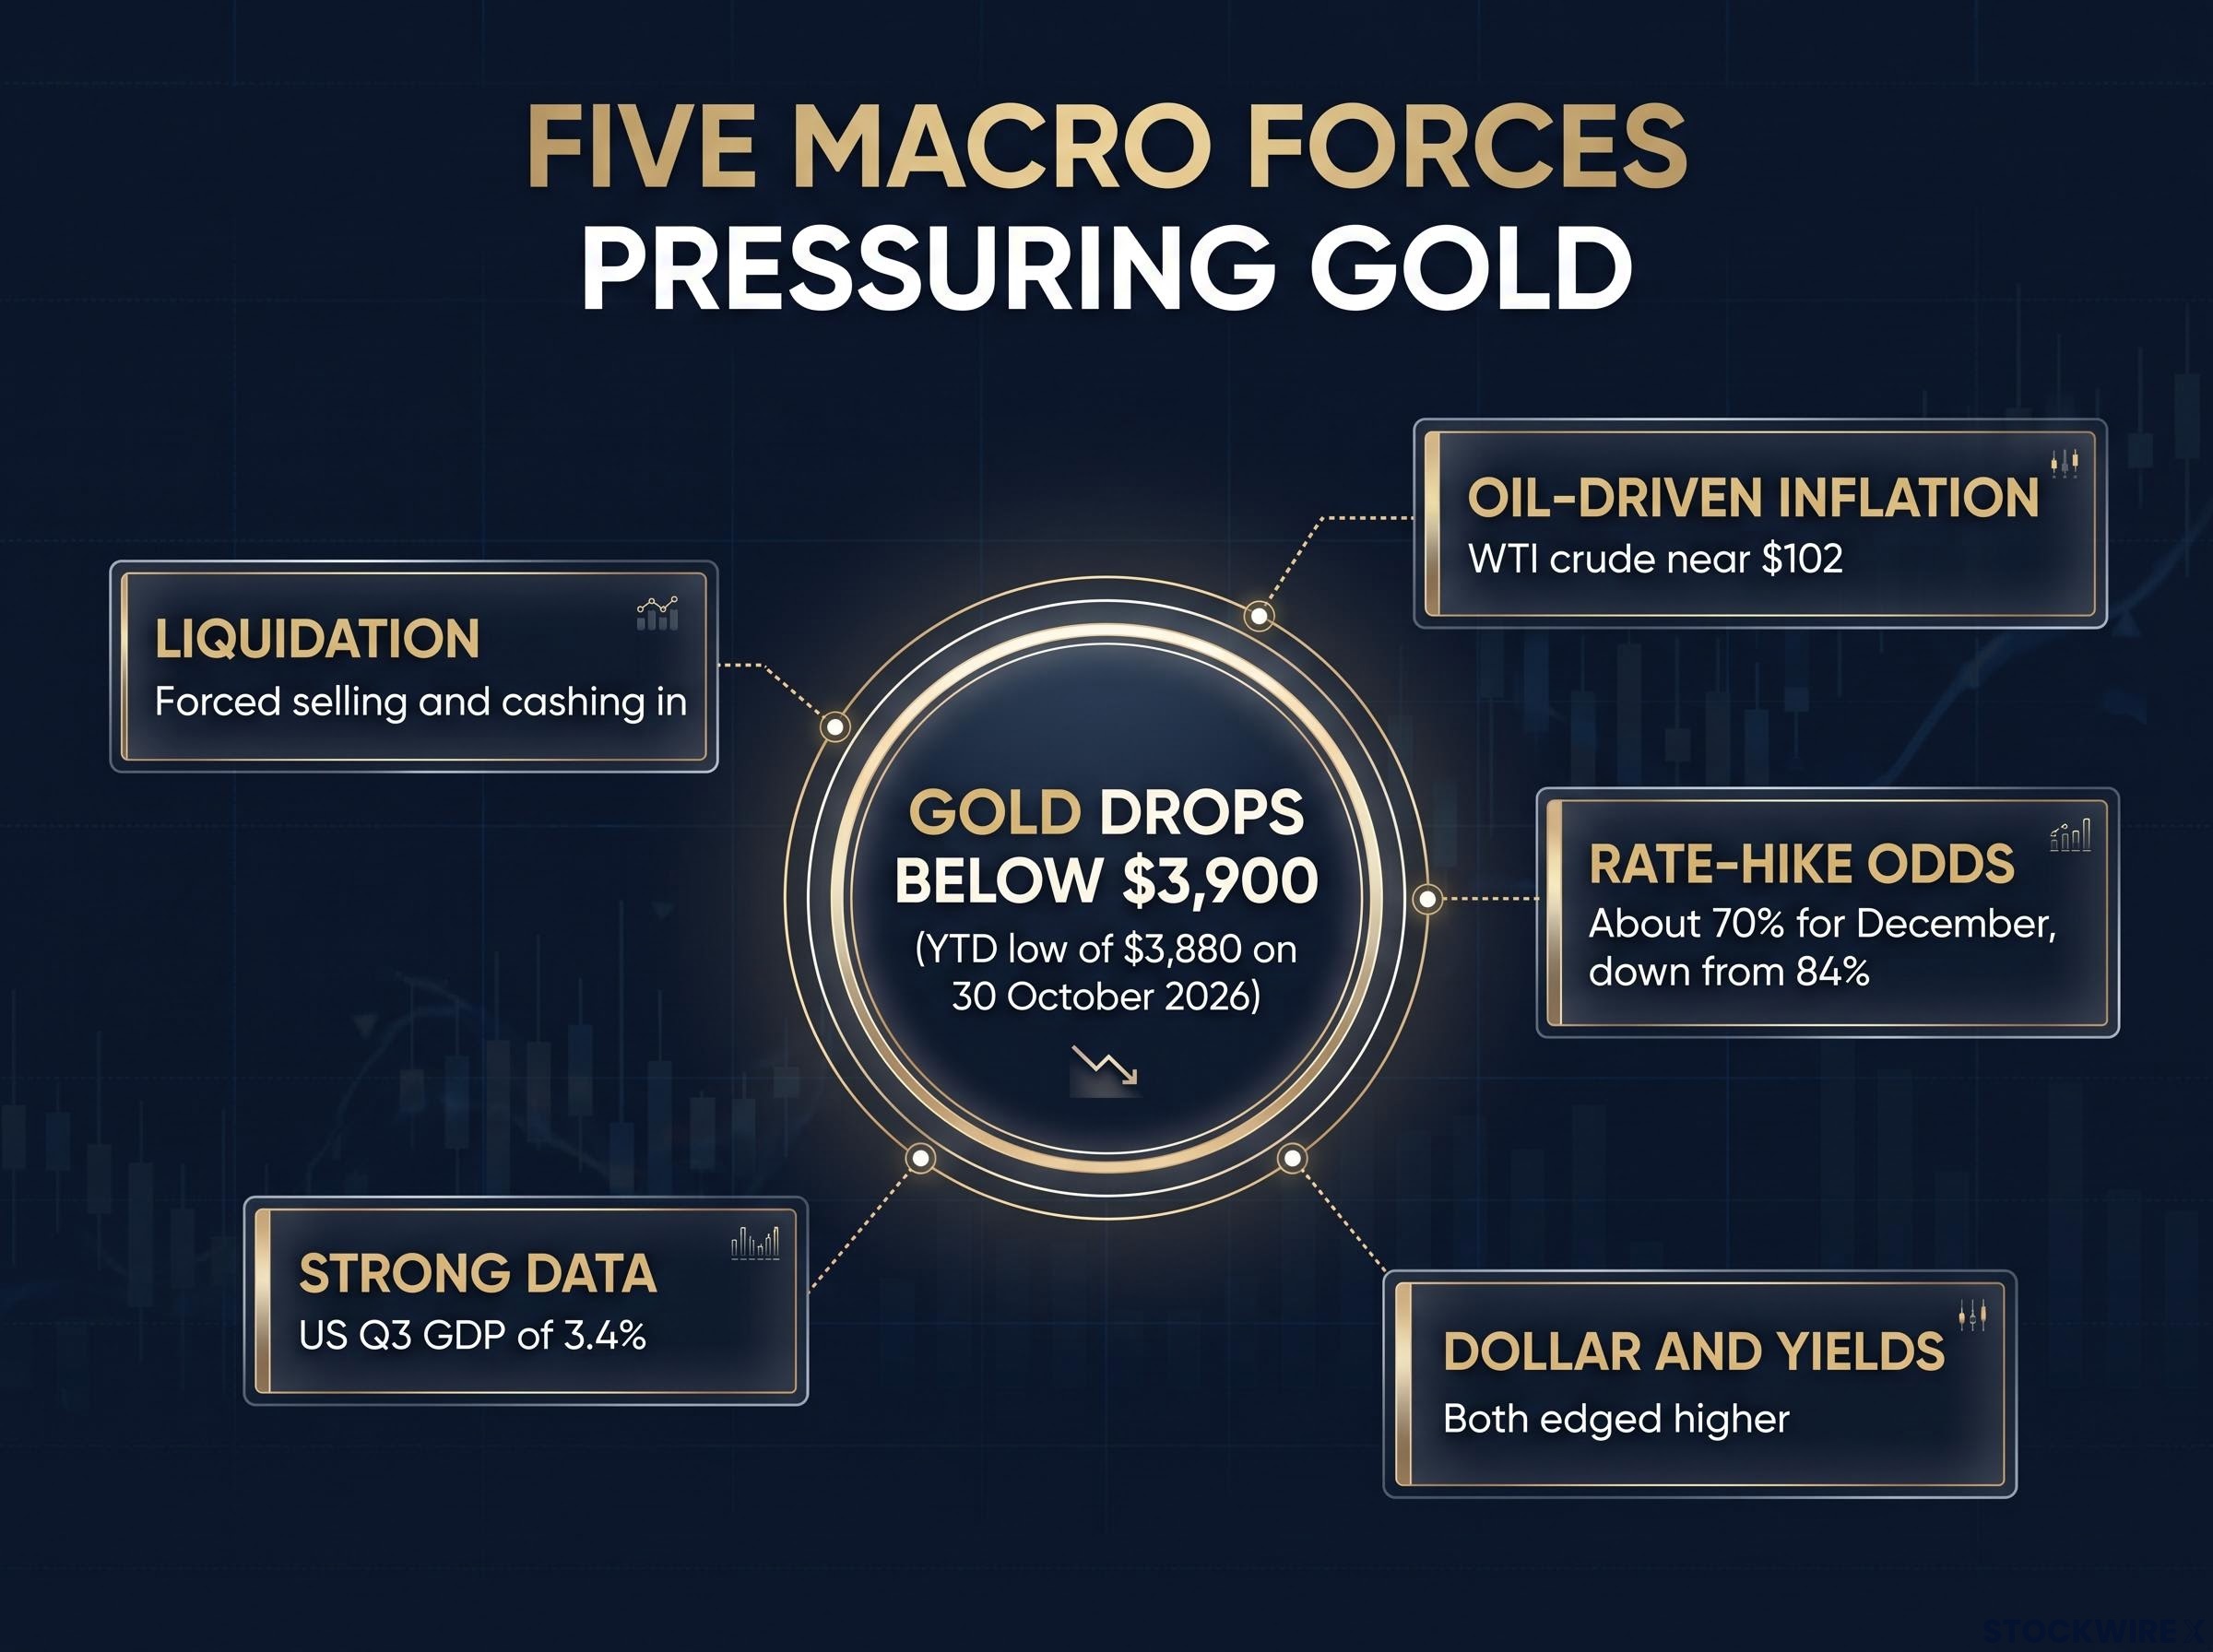
Gold broke below $3,900 on Friday for the first time in a year. FXStreet reported a new year-to-date low of $3,880 on 30 October 2026, a gold price drop that came in the middle of an oil shock and rising Iran tensions. Other sources placed spot gold nearer $4,000, so the exact level depends on which feed you follow.
Several forces hit gold at once. The US Federal Reserve sounded hawkish, December rate-hike odds sat at roughly 70-80%, US growth came in strong, and WTI crude held near $102 a barrel. Together they outweighed the safe-haven buying that a Middle East flare-up would normally bring.
Here is why the slide happened, which price levels traders are watching, and which data releases next week could decide gold’s next move.
Why did gold fall even with oil at $100 and Iran tensions?
On paper, the setup favoured gold. Oil was near $102, Iran was in the headlines, and US-Iran talks were reportedly still continuing, according to Axios.
Then the market did the maths on inflation. Higher oil means higher prices across the economy, and higher prices mean the Fed has less room to ease and more reason to hike. FXStreet put gold near $3,884, down more than 3.3% on the day, and Morningstar recorded a fall of about 3.6% over the past month.
The data added to the pressure. Five forces acted on gold at once:
- Oil-driven inflation: pricier energy threatens to keep inflation above target.
- Rate-hike odds: about 70% for December (CME FedWatch, per FXStreet), down from roughly 84% after Wednesday’s Fed decision. Other reports put the figure near 79.6%.
- Dollar and yields: both edged higher on Friday.
- Strong data: US Q3 GDP of 3.4% and sticky core inflation.
- Liquidation: commentary pointed to forced selling and investors cashing in profitable gold positions.
The figures differ by source, mostly because they use different measurement bases.
| Indicator | FXStreet figure | Other source figure | Basis note |
|---|---|---|---|
| Core PCE | 3.1% | 2.5%, down from 3.3% in Q2 | Year over year vs annualised quarterly (BEA-based) |
| Q3 GDP | 3.4% | 3.4% | Labelled year over year vs annualised real growth |
| WTI crude | Near $102 | About $101-$102 | Per barrel |
| December hike odds | About 70% | 79.6% | Timing of measurement differs |
Gold rose more than 3% in August 2026 when yields and the dollar fell. This week was the same mechanism running in reverse.
For you, the lesson is that in this market the rate path matters more than the headline risk. An oil spike is not automatically good news for gold.
How gold normally responds to the dollar, yields and rates
Gold pays no interest. When real yields rise (the return on bonds after inflation), holding gold costs you more in forgone income. According to World Gold Council background, gold also tends to move against the US dollar, because a stronger dollar makes it dearer for buyers using other currencies. In general, gold rises when rates fall and slips when they climb. Keep that in mind for the rest of this story.
PIMCO estimates that a 100 basis point rise in 10-year real yields produces an 18% decline in inflation-adjusted gold prices, which is why real yields, not nominal rates, are the variable that matters most for the metal.
What are Fed officials saying, and where are the key gold levels?
Early coverage framed Friday’s Fed speakers as split. They were not. All three were hawkish; they disagreed only on how fast and how far to go.
| Official | Stance | Key point |
|---|---|---|
| Lorie Logan, Dallas Fed | Hawkish | At least two more 25bp hikes; policy at least 50bp below modestly restrictive (Reuters) |
| Alberto Musalem, St. Louis Fed | Hawkish | Another hike “soon”; policy still too loose |
| Thomas Barkin, Richmond Fed | Hawkish, gradual | Prefers gradualism; says pressures are spreading and AI investment could add demand |
A basis point (bp) is one hundredth of a percentage point, so 25bp equals 0.25%. Even the most cautious voice sees inflation pressure widening, which tells you hike risk is not fading.
The hawkish tone is harder to read because Chair Kevin Warsh has removed forward guidance, leaving inflation prints and individual speeches to drive rate expectations rather than a signalled policy path.
Support and resistance traders are watching
Support is a price where buying has previously stepped in. Resistance is where selling has capped rallies.
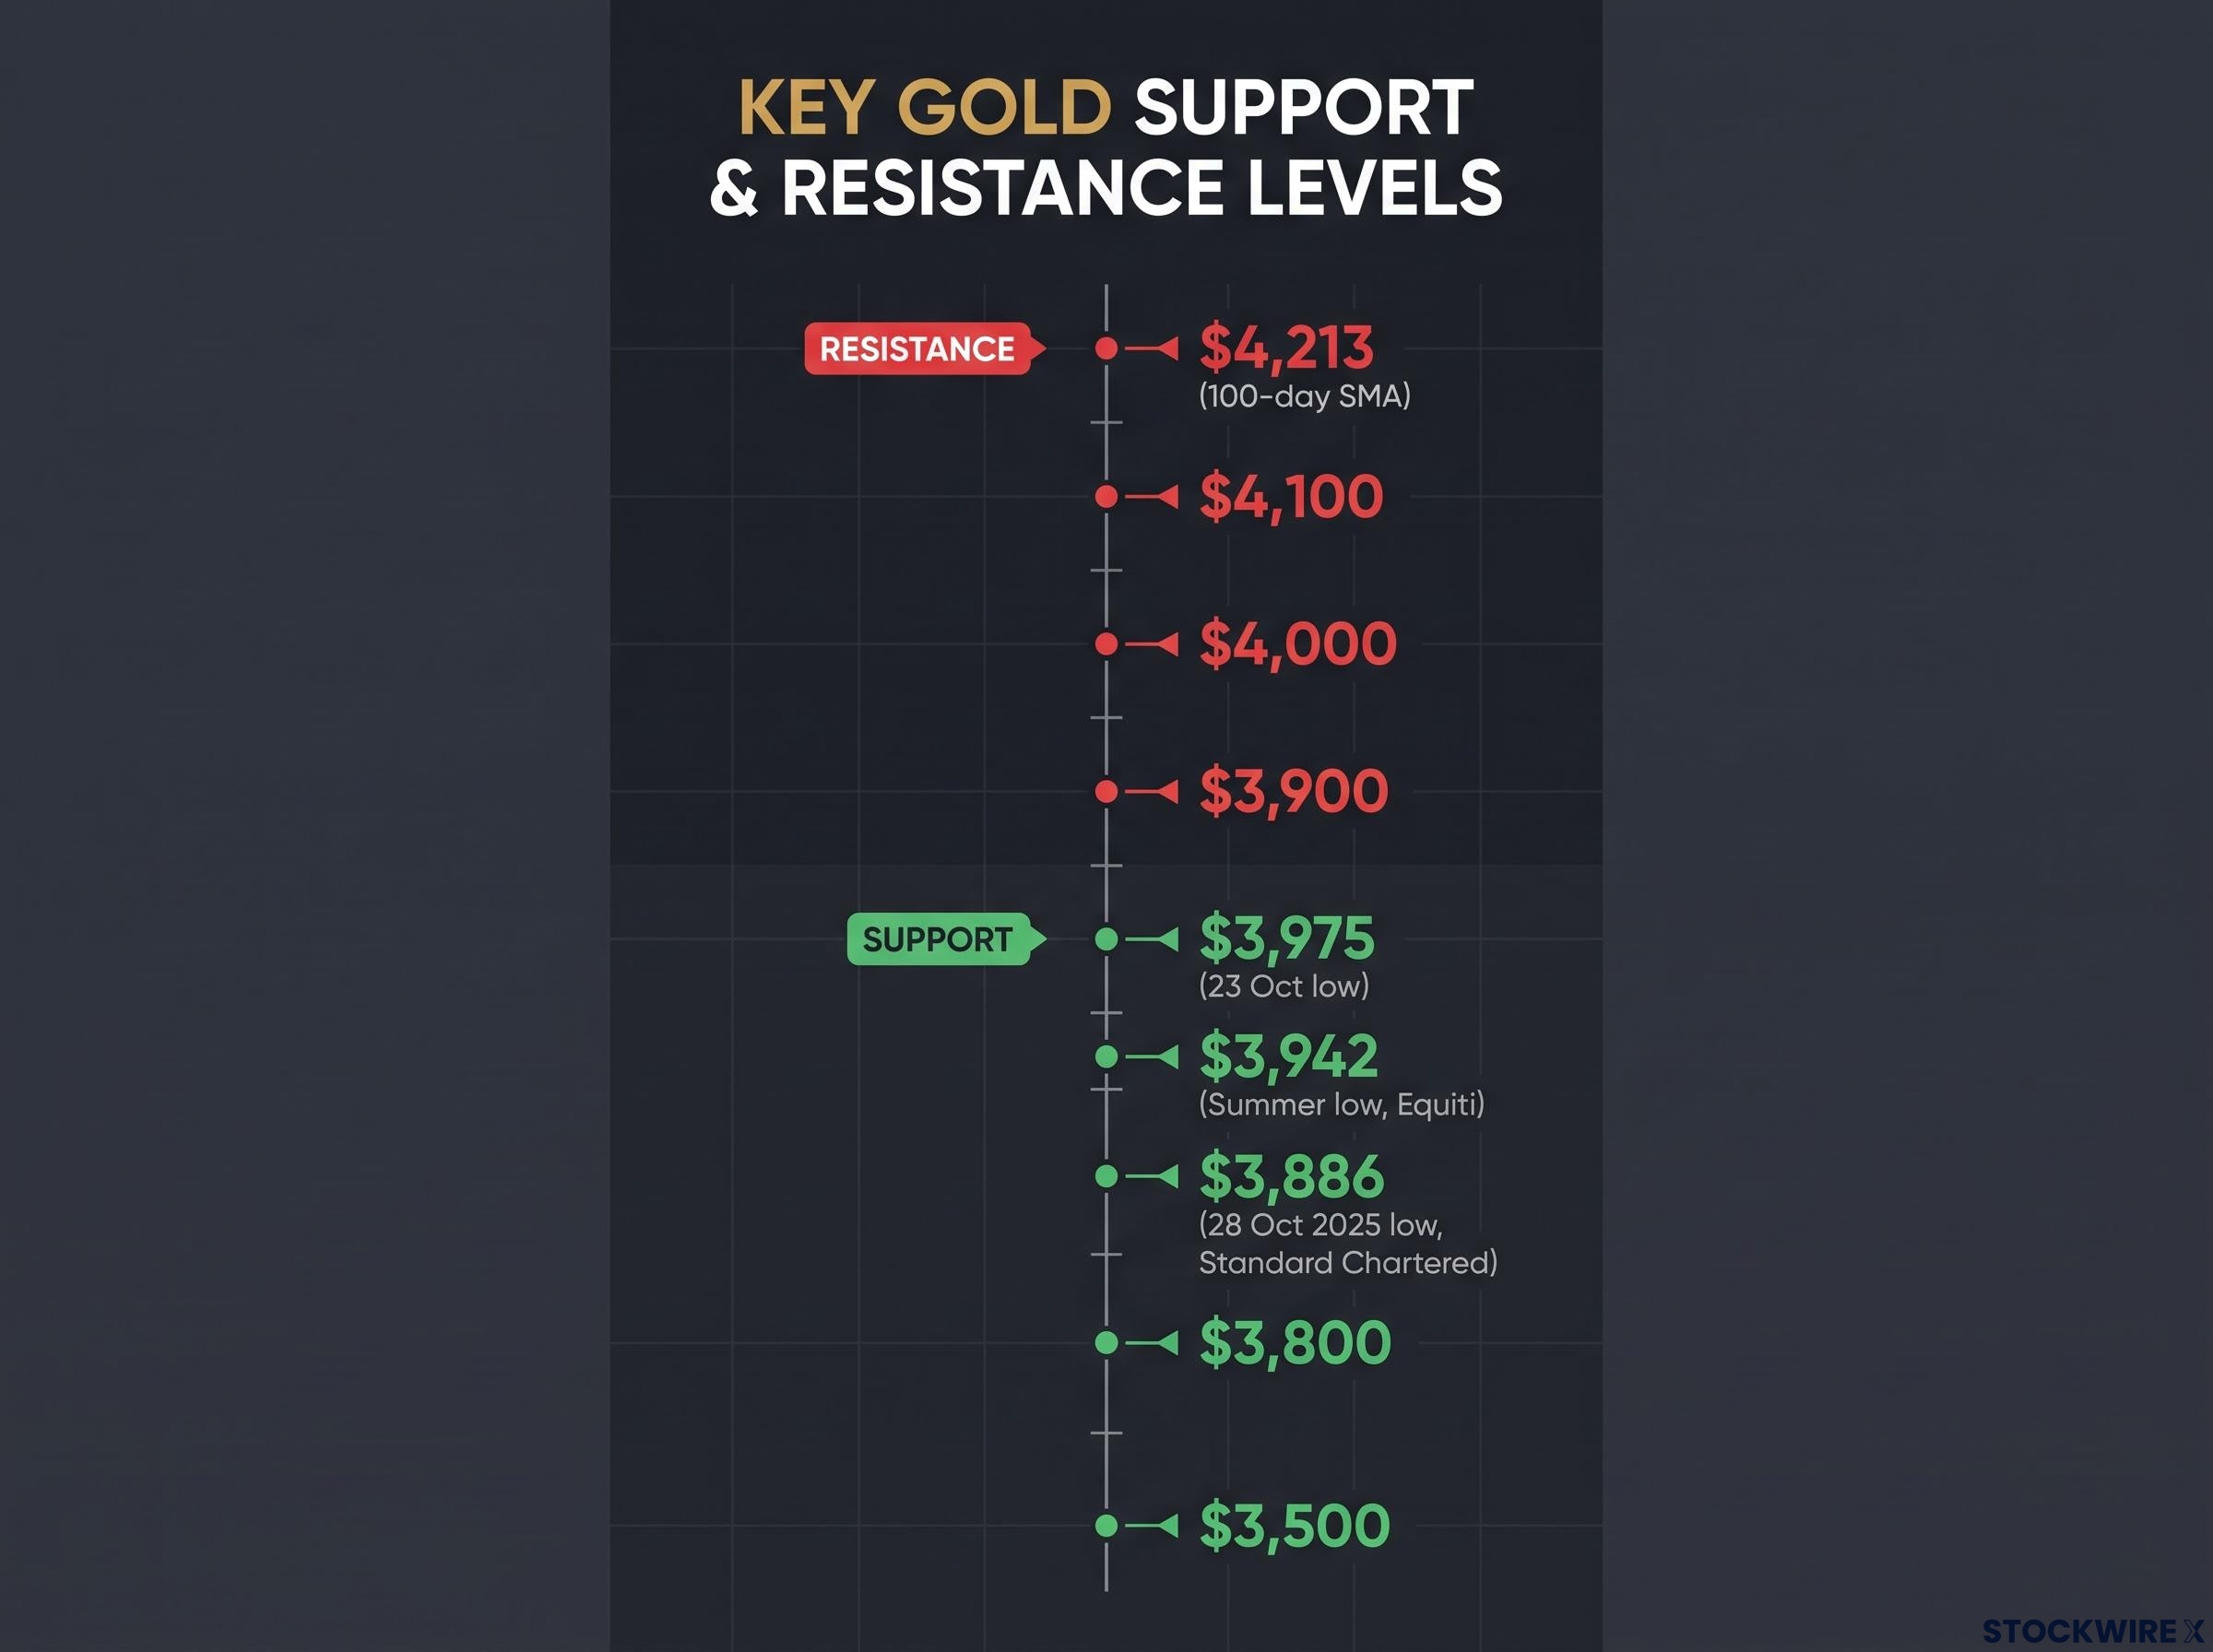
Support, from highest to lowest:
- $3,975: the 23 October low.
- $3,942: the summer low (Equiti).
- $3,886: the 28 October 2025 low, flagged as the key level by Standard Chartered.
- $3,800, then $3,500: FXStreet targets if gold posts a daily close below $3,886.
Resistance, from lowest to highest:
- $3,900
- $4,000
- $4,100
- $4,213: the 100-day simple moving average (SMA), the average closing price over 100 days, per FXStreet. An earlier 20 October reference put it near $4,235; the average shifts daily.
FXStreet notes the relative strength index (RSI), a momentum gauge, is approaching oversold. That signals a strengthening downtrend, but also a higher chance of a bounce. Any rebound would need to reclaim $3,900 and $4,000 first.
What does the data calendar mean for gold next week?
Gold heads into a crowded week of US data, and each release feeds straight into rate expectations.
| Release | Date | Consensus | Prior |
|---|---|---|---|
| ISM Manufacturing PMI | 2 November | 54.7 (Newsquawk) | 54.5 |
| JOLTS job openings | 3 November | No reliable consensus found | Not available |
| ISM Services PMI | 4 November | 54.7 (Newsquawk); 55.0 (Continuum Economics) | 54.9 |
| ADP Employment Change | 4 November | No consensus available | Not available |
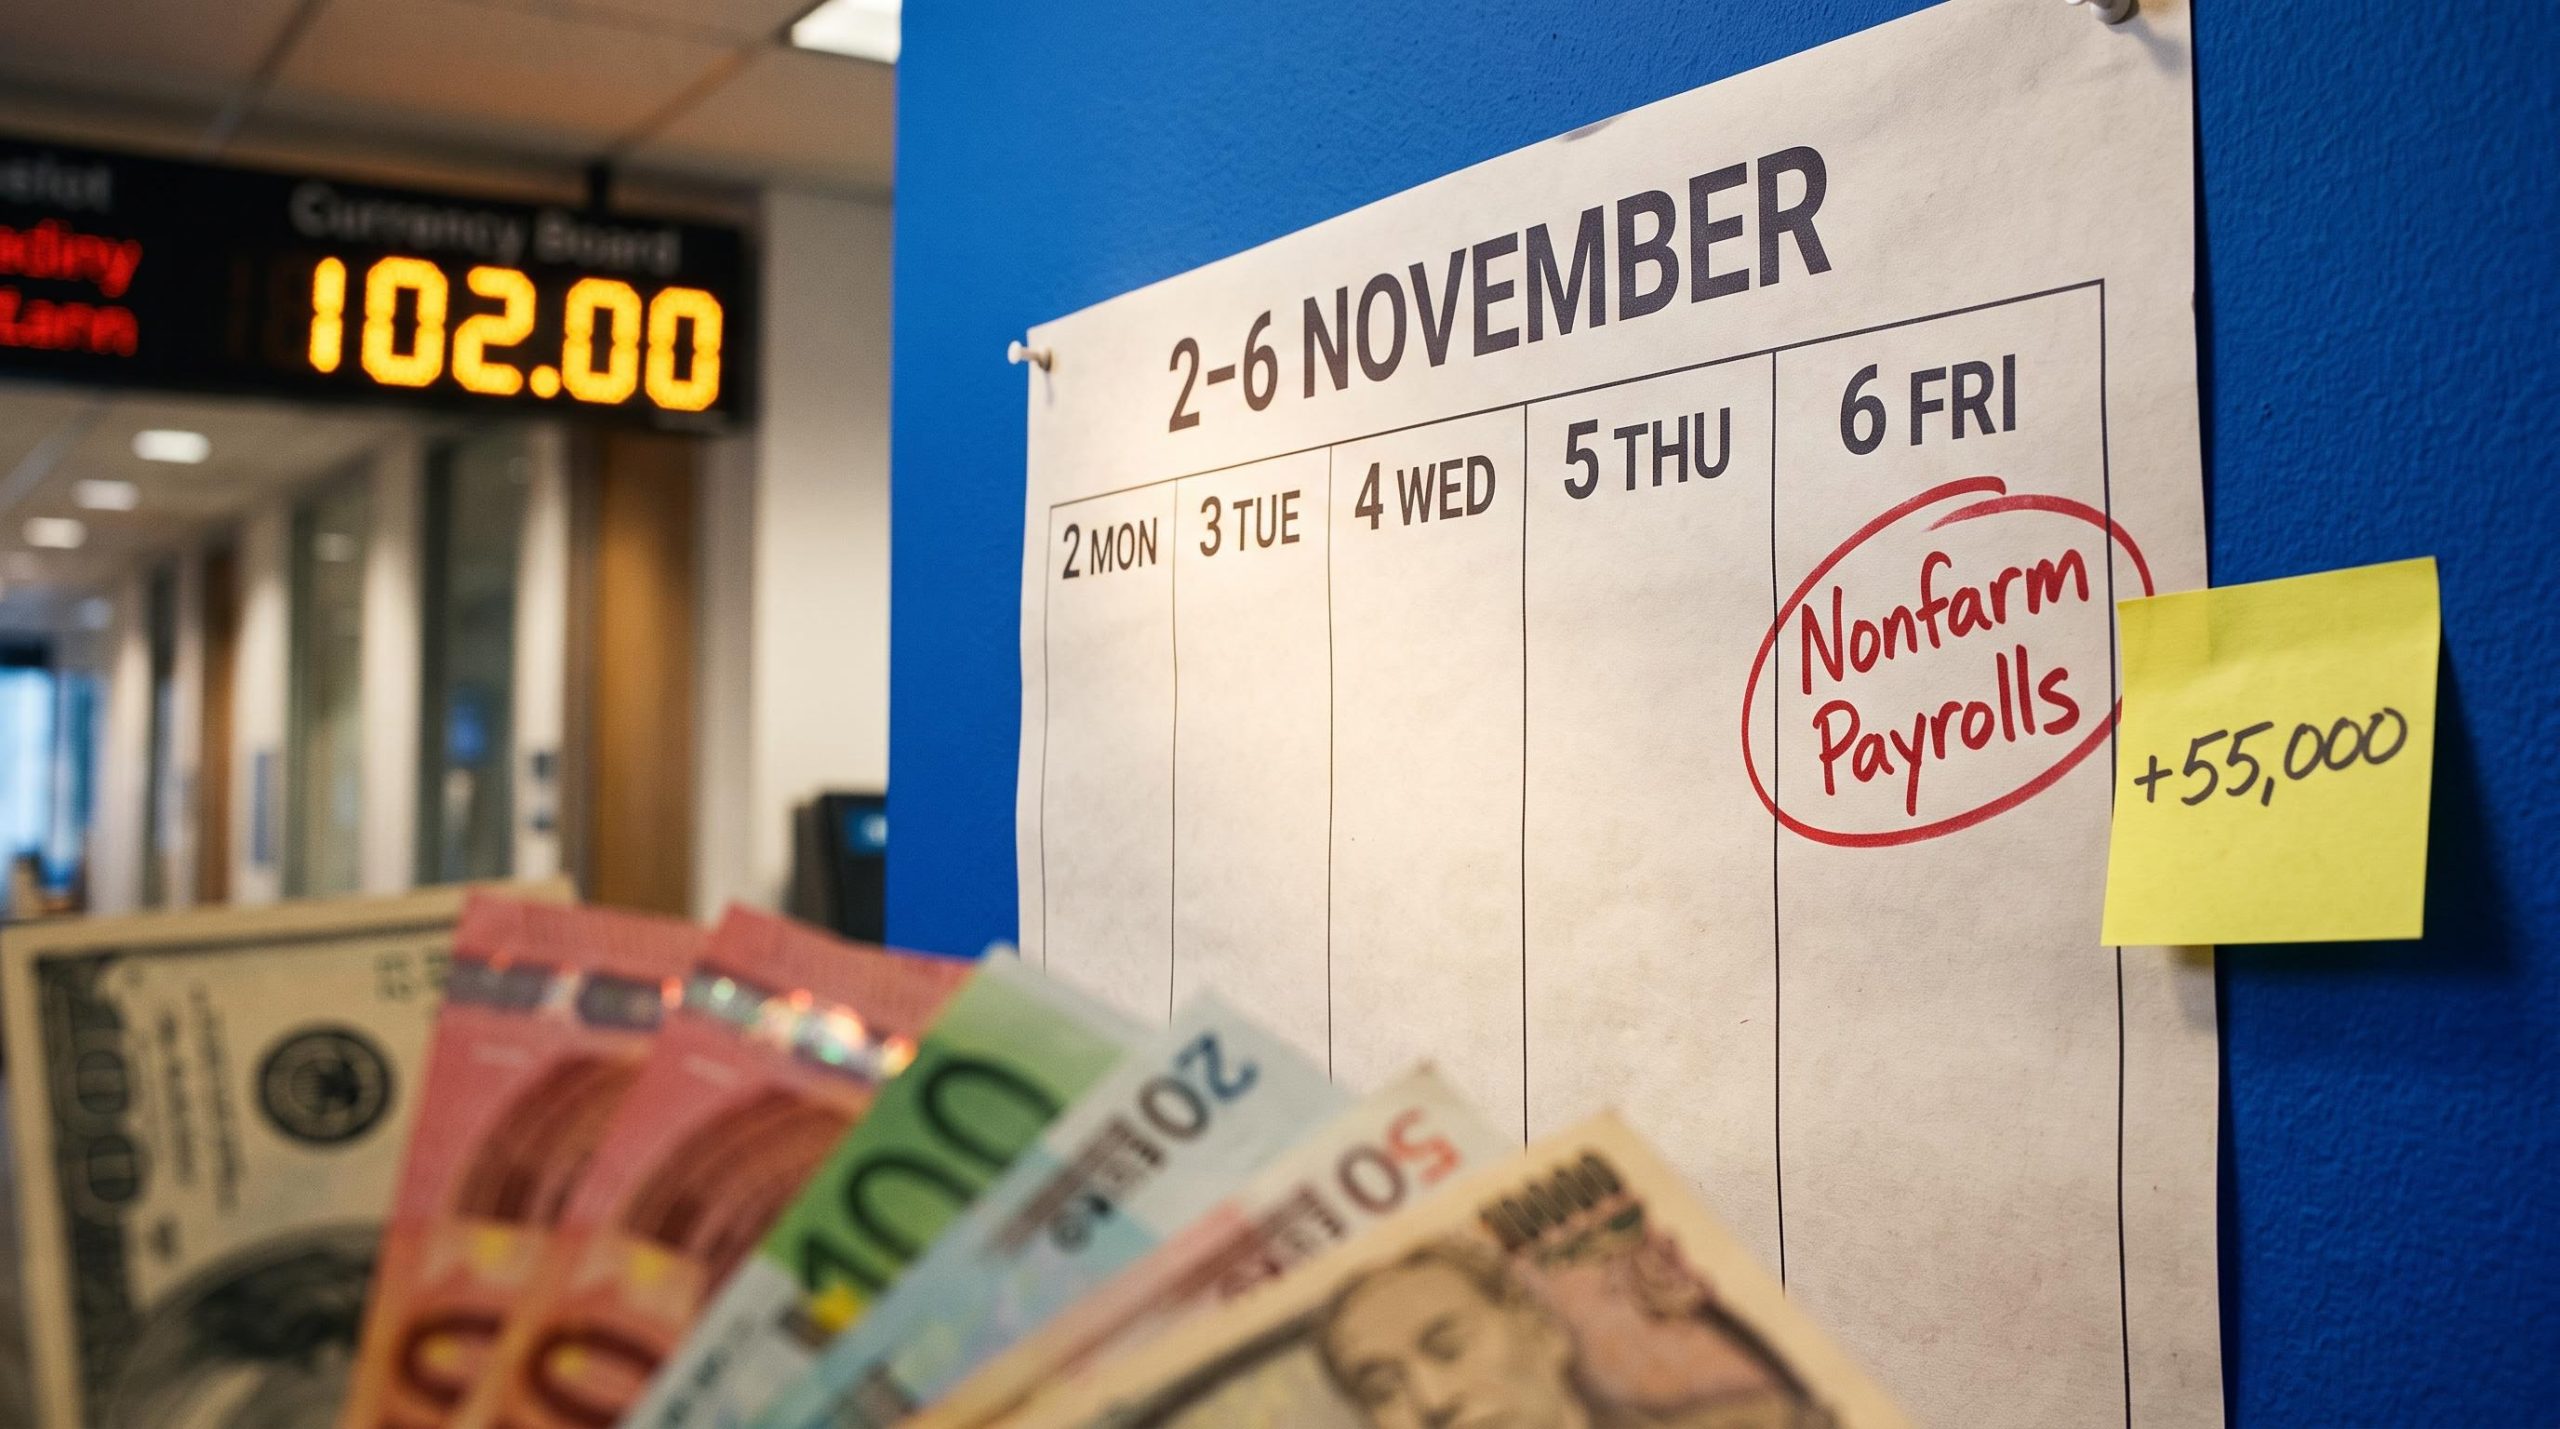
| Nonfarm Payrolls | 6 November | +55,000 (Newsquawk); +50,000 (Continuum) | Not available |
The purchasing managers’ index (PMI) surveys gauge business activity, where a reading above 50 signals expansion. The week builds towards Friday.
Main event: Nonfarm Payrolls, 6 November Newsquawk expects +55,000 jobs and 4.2% unemployment. Continuum Economics sees +50,000, with private payrolls at +45,000.
A stronger-than-expected payrolls print would likely reinforce hike bets and pressure gold, so treat Friday as the key risk event for the levels above.
There is a longer-term cushion. The World Gold Council’s October update showed central banks bought about 170 tonnes year to date, and 89% of central banks expect global reserves to rise. Morningstar notes first-half 2026 official buying was the lowest first-half total since 2022, though, and that support has not stopped the short-term selling.
The structural bid from central bank buying, running at roughly 1,000 tonnes a year, is largely price-insensitive because sovereigns accumulate for reserve diversification, which helps explain why it cushions drawdowns without preventing them.
What the gold slide changes, and the signals to watch into payrolls
For now, the market has ranked oil-driven inflation, hawkish Fed guidance and a firmer dollar above safe-haven demand. That ordering can change, but it will take data to change it.
The slide also lands after a gold bull market that was powered largely by central banks and physical buyers in Asia rather than mainstream ETF investors, which leaves the metal sensitive to shifts in positioning.
Three signals matter most. First, whether gold holds a daily close above $3,886. Second, where December hike odds settle after Wednesday’s swing. Third, the 6 November payrolls figure, which could either harden or crack the rate-hike story.
The $3,880 low is FXStreet’s figure, and prices and probabilities move intraday. Check a live feed before you act on any level.
This article is for informational purposes only and should not be considered financial advice. Investors should conduct their own research and consult with financial professionals before making investment decisions.