
In July, US real yields climbed to their highest point since the April 2025 tariff shock. The dollar lost key technical support. Gold advanced to its strongest price since June. All three moved within the same window, and all three moved in the wrong direction according to every institutional macro model built in the last two decades.
The standard framework is straightforward: rising real yields raise the opportunity cost of holding a non-yielding asset like gold, pull capital into dollar-denominated instruments, and strengthen the greenback. That framework has anchored institutional positioning for years. What is happening now suggests something more structural than a rate cycle is at work, and investors relying on the old correlation are likely reading the current environment backwards.
Here is the framework for understanding what gold, the dollar, and real yields are actually signalling when they diverge like this, and how to position around those signals before the official data and Federal Reserve communications confirm what asset prices have already told you.
The anomaly hiding in plain sight: gold up, dollar down, real yields rising
The sequence unfolded over a matter of weeks. Throughout July, gold held firm even as real yields continued grinding upward, effectively brushing aside what should have been headwinds. A Treasury announcement then acted as a catalyst, pushing gold up to its strongest level since June, with market participants referencing a preliminary near-term upside target of approximately $5,000.
The dollar, which should have strengthened on the back of those yields, did the opposite. Key technical levels gave way, with selling pressure broadening after the same Treasury announcement. Short positions were built against the dollar across four major pairs: the Australian dollar, British pound, euro, and Canadian dollar.
“US real yields hit their highest level since the April 2025 tariff shock in July, yet gold surged and the dollar fell.”
The concurrent movements, taken together, paint a picture that a single-asset headline misses:
- Gold at its highest since June, with a preliminary target near $5,000
- US real yields at their highest since the April 2025 tariff shock
- The dollar breaking key technical support, weakness broadening post-announcement
- Dollar short positions held across four major currency pairs (AUD, GBP, EUR, CAD), indicating broad-based structural positioning
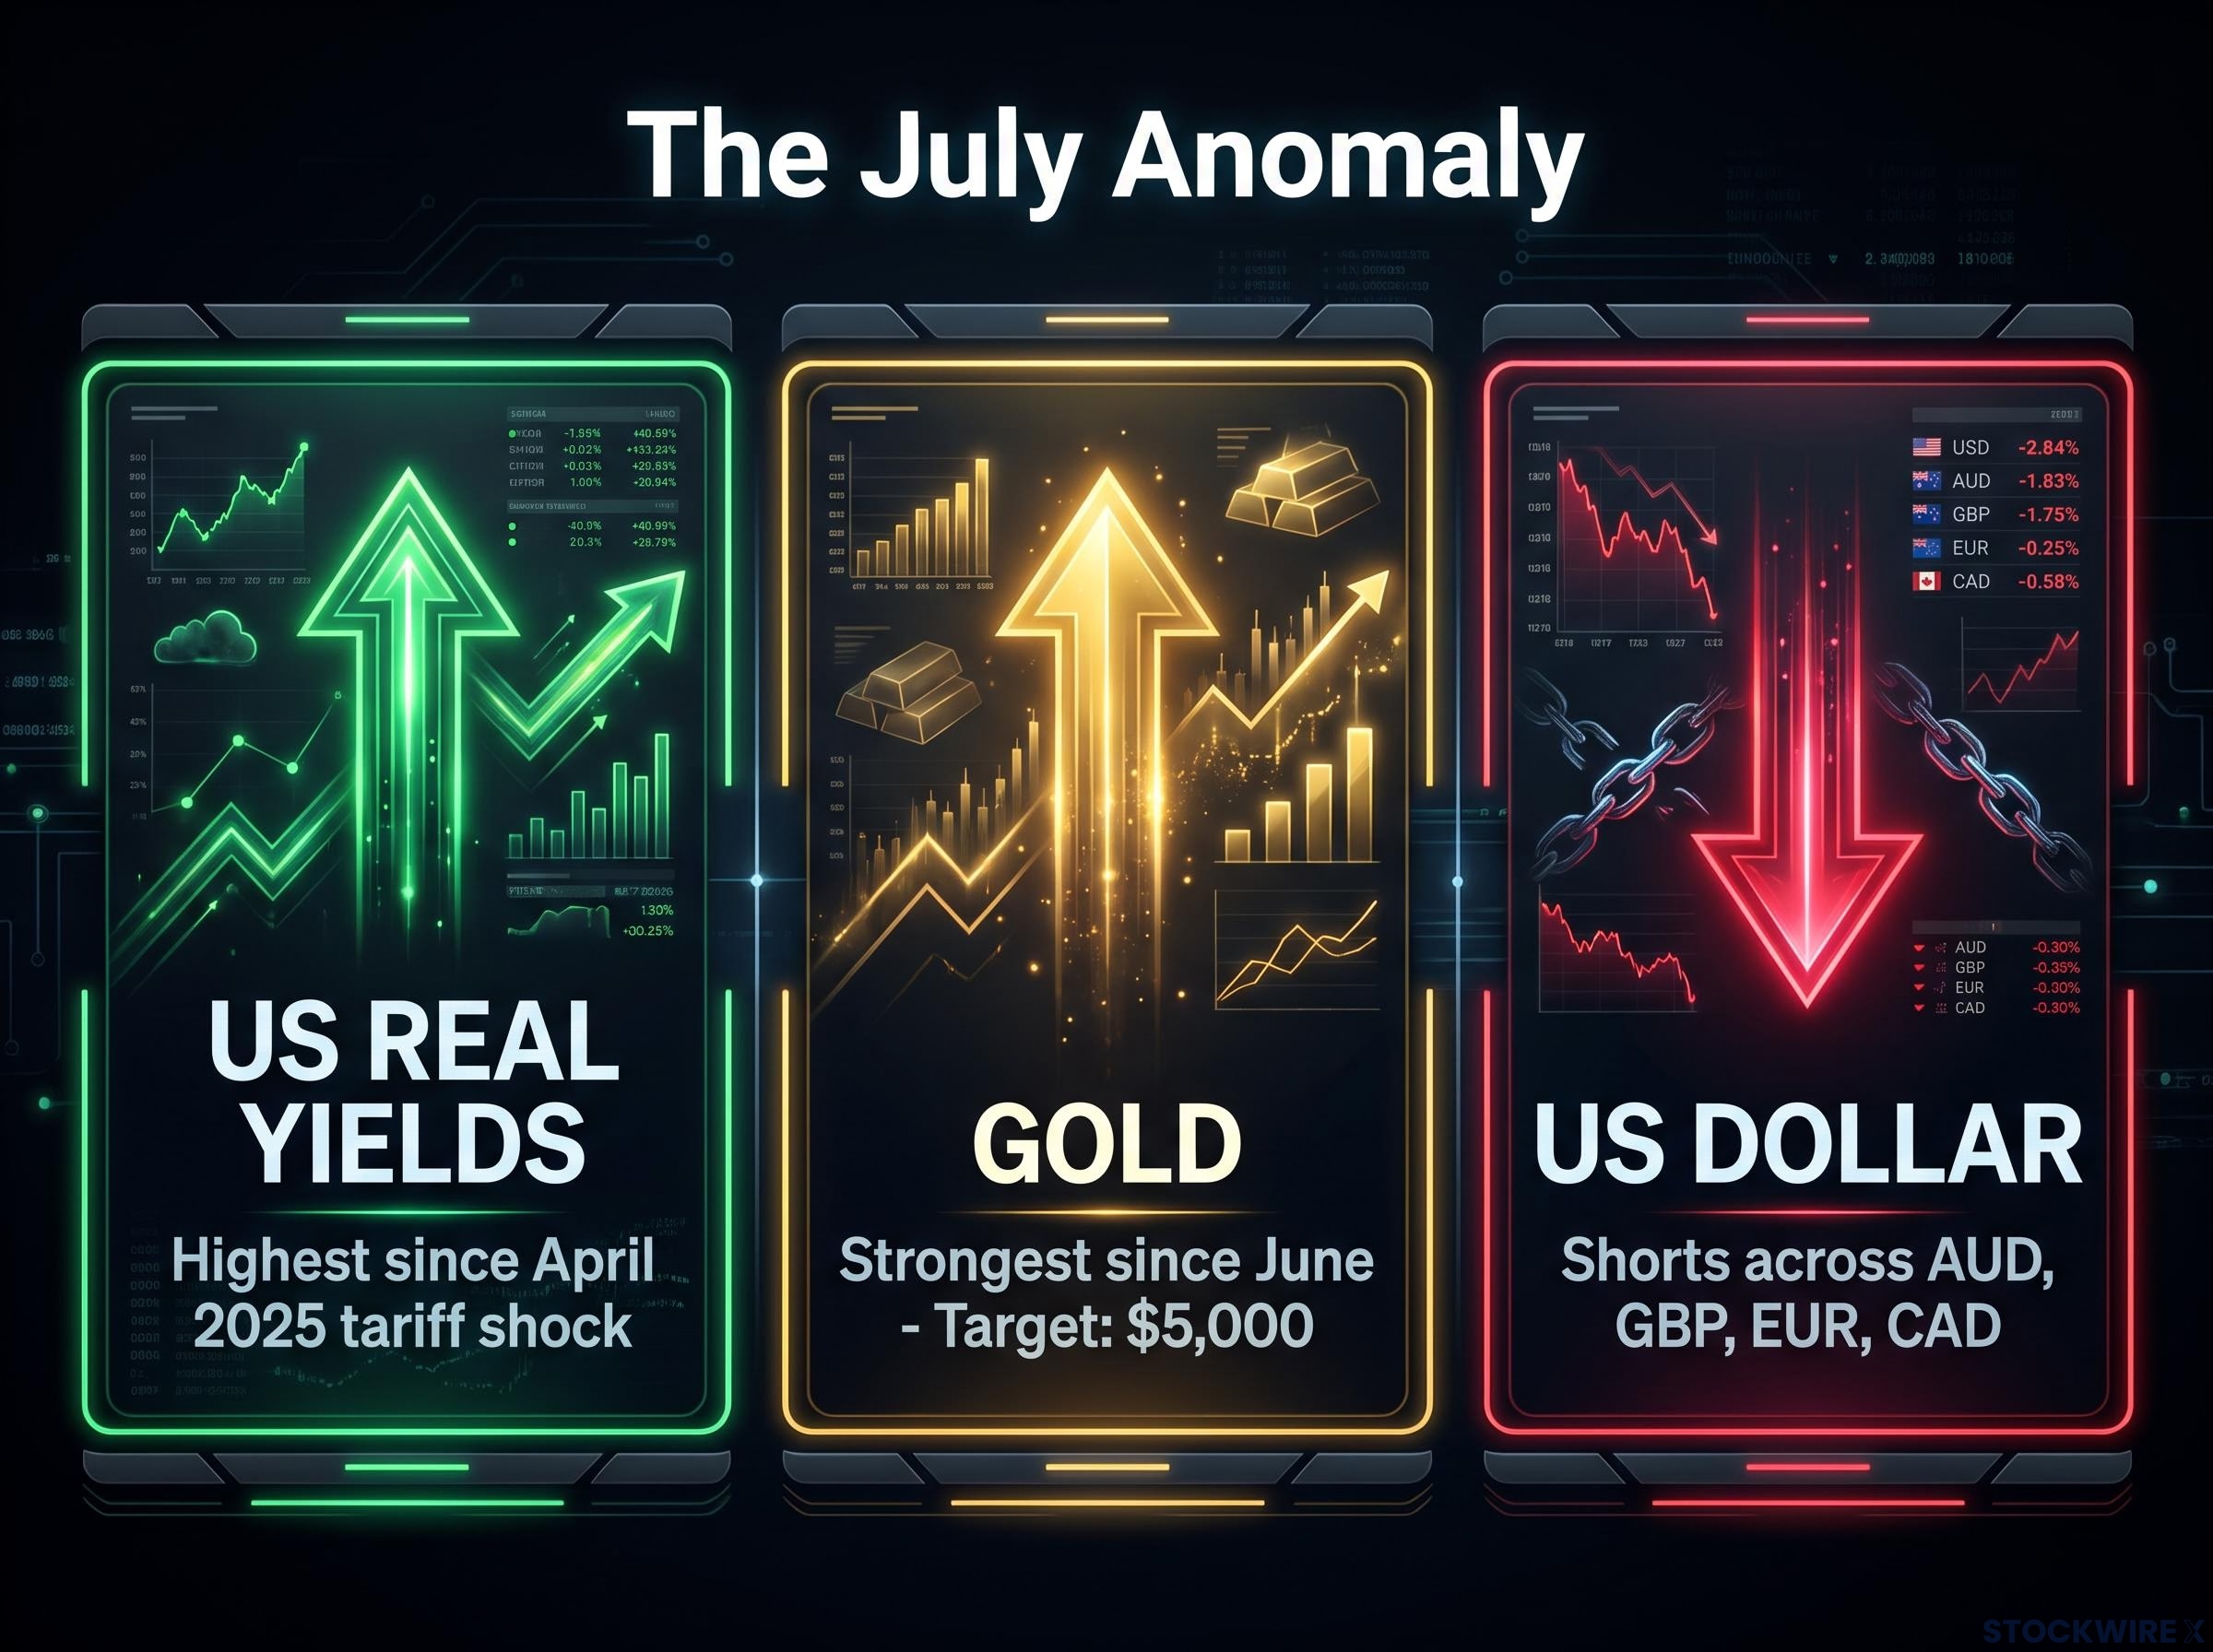
The fact that sophisticated participants built short dollar positions across four major pairs while simultaneously accumulating gold tells you this was treated as a structural call, not a tactical trade around one data point. Understanding these concurrent movements is the prerequisite for interpreting what comes next.
When big ASX news breaks, our subscribers know first
Why the real-yield-to-gold rule broke down
How the classic mechanism worked
The transmission chain was clean. Higher real yields raised the opportunity cost of holding non-yielding gold. Capital rotated toward dollar-denominated assets offering better risk-adjusted returns. The dollar strengthened. Gold fell. For decades, that inverse correlation held with enough reliability that institutional models were built around it.
The four forces that overrode it
Since approximately 2022-2023, the inverse correlation between gold and real yields has broken down, confirmed by multiple institutional analyses. Four structural forces explain why:
- Persistent central-bank and sovereign buying. Many central banks have increased gold reserves as part of de-dollarisation programmes. These buyers operate on multi-year horizons and are largely price-insensitive to cyclical rate moves.
- Geopolitical and systemic risk. Elevated tensions and financial-system fragility have strengthened gold’s role as a tail-risk hedge. In these regimes, investors pay less attention to opportunity cost and more to protection.
- Policy-credibility erosion and fiscal stress. Growing mistrust in the long-run discipline of monetary and fiscal policy, particularly in the US, has lifted gold’s baseline valuation. If investors doubt that central banks can sustain high real rates without destabilising growth, they treat current yields as temporary.
- Fully-priced rate cycles. Once a hiking cycle is mature and expectations are saturated, additional yield moves have diminishing impact. Assets respond more to changes in growth and policy reaction functions than to the absolute level of real rates.
Central-bank gold accumulation has doubled from roughly 500 tonnes per year to approximately 1,000 tonnes per year over the past four years, and the OMFIF Global Public Investor survey released 30 June 2026 recorded the first-ever instance of net dollar-reduction intent outnumbering net dollar-increase intent among sovereign institutions.
Gold positions were built up across an extended timeframe: initially established at an earlier breakout, added to during a period of consolidation, and extended further once prices broke to new highs. That accumulation pattern is consistent with structural positioning, not tactical rate trading.
If the rule that anchors most institutional gold models has been structurally broken for roughly three years, any analysis relying solely on real yields is offering you an incomplete, and potentially misleading, framework.
What the Federal Reserve’s own minutes reveal about the credibility gap
At the July Federal Open Market Committee (FOMC) meeting, the vote came in at 9-3 in favour of holding rates, with the three dissenters calling for an immediate increase. Those who wanted to move early framed their preference as bringing forward tightening rather than committing to a more sustained hawkish stance. A number of participants also raised the concern that financial conditions may not yet be tight enough to reliably push inflation back to the 2% target.
The market’s response was telling. It effectively looked past three members wanting an immediate hike and continued reducing rate-hike expectations across the board.
“9 voted to hold. 3 voted to hike immediately. Markets responded by pricing in fewer hikes.”
| Timeframe | Market Expectation | Trend Direction |
|---|---|---|
| September | No change expected | Stable |
| October | Roughly even odds of a hike | Declining probability |
| December | At least one hike anticipated | Shifting toward 50/50 |
| Post-December | Reduced expectations | Probabilities declining for 1, 2, and 3 additional hikes since early August |
Inflation data released after the July meeting showed a decline, further reducing the urgency reflected in the hawkish minority’s concerns. The minutes did not shift market direction because the market had already concluded the “higher for longer” narrative was losing credibility.
The Fed credibility gap widened materially at the July 29 press conference, with long-term yields rising while short-term rates fell, a yield curve steepening that analysts at Wolfe Research, Capital Economics, and Barclays attributed to a hawkish written statement mismatched against a cautious, non-committal press conference tone.
A market that looks past a 9-3 vote with three members wanting an immediate hike, and continues pricing in fewer hikes, is telling you something concrete: the “higher for longer” signal is no longer being taken at face value. That disbelief is precisely what gold and the dollar are reflecting.
The growth data telling the story asset prices are already pricing
Asset markets did not wait for the data. They moved first. The incoming economic numbers have since confirmed the narrative that gold and the dollar had already expressed in prices.
“The Atlanta Fed’s real-time GDP tracker shed close to 2 percentage points across roughly three weeks, sliding from around 6% down to around 4%.”
The deterioration was broad rather than isolated:
- Atlanta Fed GDPNow: The real-time GDP estimate for the third quarter dropped from approximately 6% at the start of August to roughly 4% within approximately three weeks, a decline of roughly 2 percentage points.
- Citigroup Economic Surprise Index: Through August, the index moved steadily lower as incoming US economic readings came in short of what analysts had forecast.
- Breakeven inflation rates: Testing below year-start levels despite rising crude oil prices. Markets concluded that disinflationary pressure from slowing demand was more than enough to offset any upward impetus from energy prices, with demand weakness identified as the dominant force.
- Consumer spending: Q1 consumption proved very subdued in the opening three months of the year, before recovering in the latter part of the period.
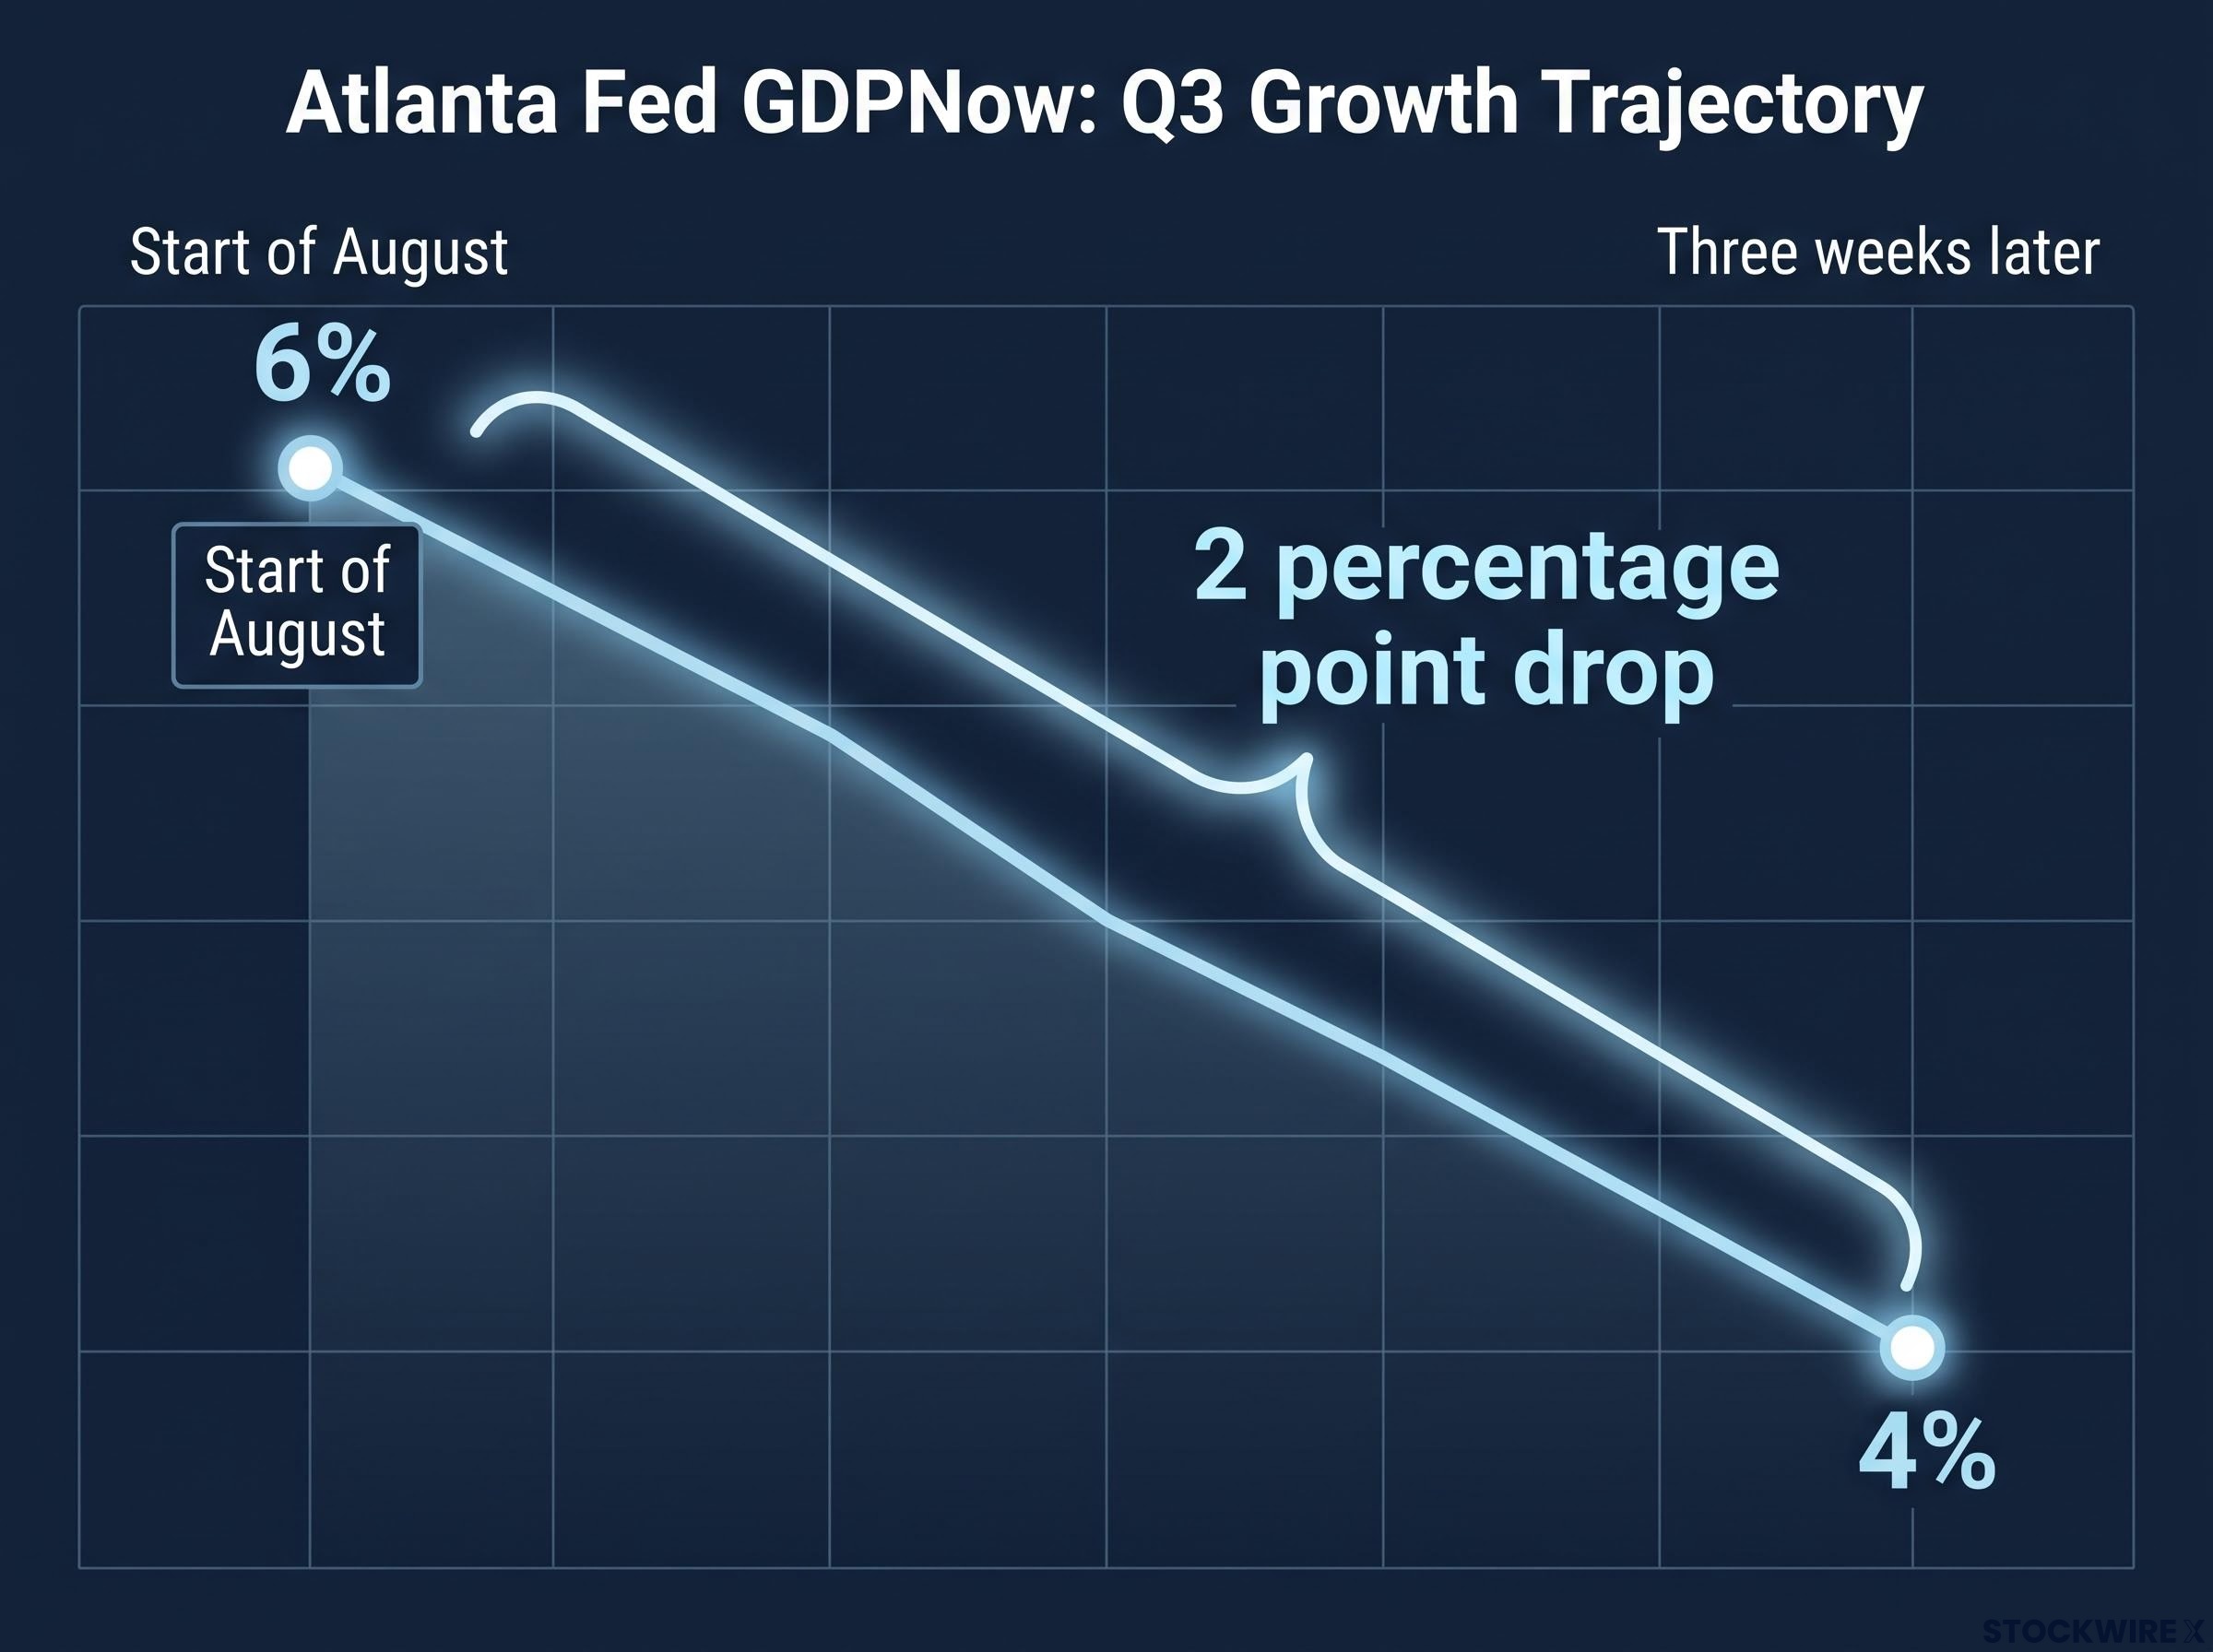
A GDPNow estimate falling 2 percentage points in three weeks tells you that the growth trajectory supporting current real yield levels is weakening in real time. Waiting for official GDP confirmation before adjusting a macro view means acting well after asset prices have already moved.
Real-time tracking tools like GDPNow and the Citigroup Economic Surprise Index are the early-warning system for the growth deterioration that gold and currency markets are already pricing. Learning to read them alongside asset divergences is where the practical edge sits.
Building a framework that replaces the broken rulebook
Real yields are still a meaningful input, but they are no longer enough on their own. At a mature stage of the rate cycle, once expectations have been fully absorbed, their ability to explain asset moves at the margin shrinks considerably. A model anchored solely on real yields needs to add five variables:
- Central-bank and sovereign flows that operate on multi-year horizons, independent of rate cycles
- Geopolitical and systemic-risk regime indicators that capture demand for tail-risk hedges
- Policy-credibility and fiscal trend signals that measure trust in the durability of current yield levels
- Market pricing of the future policy path rather than today’s real rate level
- Growth trajectory as captured by real-time tools like GDPNow and the Citigroup Economic Surprise Index
| Variable | What It Measures | Why It Now Matters for Gold and FX |
|---|---|---|
| Real yields (retained) | Opportunity cost of non-yielding assets | Still relevant, but diminished marginal impact at cycle maturity |
| Central-bank flows | Sovereign reserve diversification | Price-insensitive buying sets gold’s structural floor |
| Geopolitical risk regime | Demand for tail-risk hedges | Overrides opportunity-cost logic during elevated threat periods |
| Policy-credibility signals | Trust in monetary and fiscal discipline | Eroding credibility lifts gold’s baseline valuation |
| Growth trajectory | Real-time economic momentum | Weakening growth undermines sustainability of current yields |
The dollar requires its own adjustment. Elevated but flat real yields, combined with saturated rate expectations, mean dollar weakness can persist without aggressive cuts. FX positioning should incorporate relative growth and fiscal risk rather than defaulting to the assumption that high yields equal a strong dollar.
Equity risk premium compression is one consequence of elevated real yields that the gold-and-FX divergence often obscures: with the 30-year real yield approaching 3% and the implied equity risk premium sitting near 4.24%, the buffer equities offer above risk-free Treasuries is narrowing at the same time that growth expectations are being revised downward.
The evidence that this framework is already operational is in the positioning data. Across AUD, GBP, EUR, and CAD, dollar short positions were established on a broad basis, while gold longs were built up well ahead of the economic data that subsequently confirmed the growth slowdown. This tells you that the largest macro participants were already running this kind of multi-variable analysis before the official numbers arrived to support it. Acting on it late is the cost of waiting for official confirmation.
What the divergence signals about where the regime goes from here
Three scenarios the divergence is consistent with
The current asset market configuration, gold rising, dollar weakening, real yields elevated but losing explanatory power, is consistent with three macro regime outcomes:
- An earlier-than-consensus Fed policy pivot. Growth deterioration forces the Fed’s hand before the market’s current timeline suggests. Gold’s rally and the dollar’s weakness are pricing this scenario first.
- A structural acceleration of de-dollarisation flows. Central-bank and sovereign diversification away from dollar reserves persists regardless of rate outcomes, sustaining gold demand and dollar pressure on a multi-year basis.
- A fiscal-credibility crisis. If central banks cannot cut during a slowdown without reigniting inflation, fiscal authorities absorb the burden of economic support. That erosion of monetary-policy independence lifts gold’s valuation floor on a more permanent basis.
De-dollarisation flows are the second of the three regime scenarios the divergence is consistent with, and the measured pace of that shift matters for positioning: the dollar’s global reserve share stands at approximately 56.8%, down from a peak near 72% in 2000-2001, but a significant portion of that decline reflects currency-valuation effects rather than active central-bank portfolio decisions.
Three variables to watch
- GDPNow trajectory over the next three to six weeks. A confirming signal: continued decline toward or below 3%. A negating signal: stabilisation or reversal above 5%, suggesting the growth scare was transient.
- FOMC rate-hike probability shifts at one and two additional hikes. A confirming signal: continued decline in probability across both horizons. A negating signal: a sharp reversal higher, indicating the market has re-accepted the “higher for longer” narrative.
- Central-bank gold reserve reporting from major sovereign holders. A confirming signal: continued accumulation at pace. A negating signal: a meaningful deceleration or pause in reported purchases.
The compression-and-release dynamic in gold’s price action suggests the regime signal may have already passed its most profitable entry window for tactical participants. The preliminary target near $5,000 tells you how far the market’s regime thesis extends. If all three variables continue moving in the direction the July to August asset market behaviour implied, this is a regime shift with a multi-quarter duration, not a tactical trade that resolves when the next FOMC statement arrives.
Reading divergence before consensus catches up
Gold and the dollar have become barometers of confidence in the policy regime itself, not mechanical functions of the real yield level. The current divergence is the market’s forward-looking verdict on the durability of that regime, expressed in prices before the official data and central-bank communications confirm it.
Divergences between historically correlated assets precede official data confirmation. Investors who act only on confirmed data enter after the trade has already expressed itself. That gap between the signal and the confirmation is where the edge sits.
You now have the specific variables, the historical context of the correlation breakdown since 2022-2023, and the three regime scenarios to monitor. That is a more complete toolkit than relying on any single asset signal or waiting for an FOMC statement to tell you what gold and the dollar have already said.
This article is for informational purposes only and should not be considered financial advice. Investors should conduct their own research and consult with financial professionals before making investment decisions. Past performance does not guarantee future results. Financial projections are subject to market conditions and various risk factors.