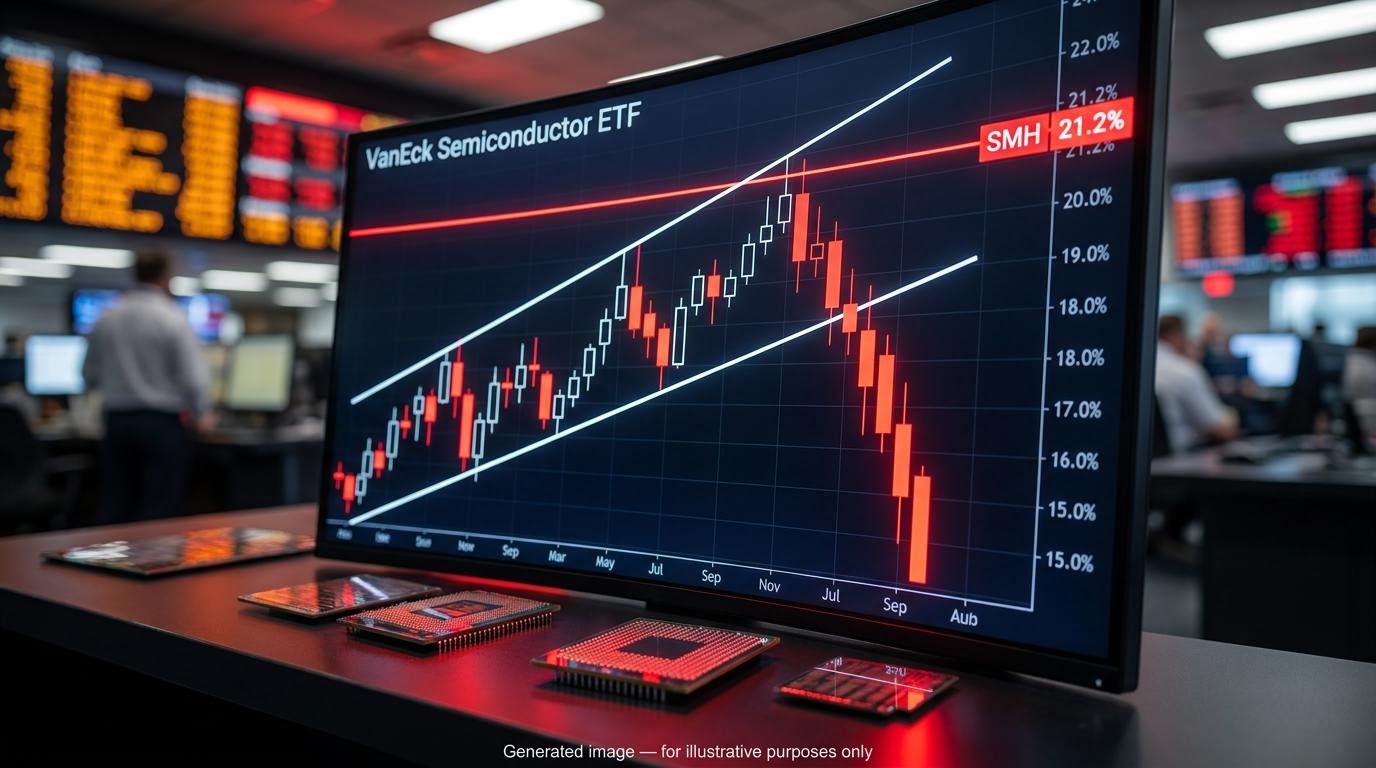
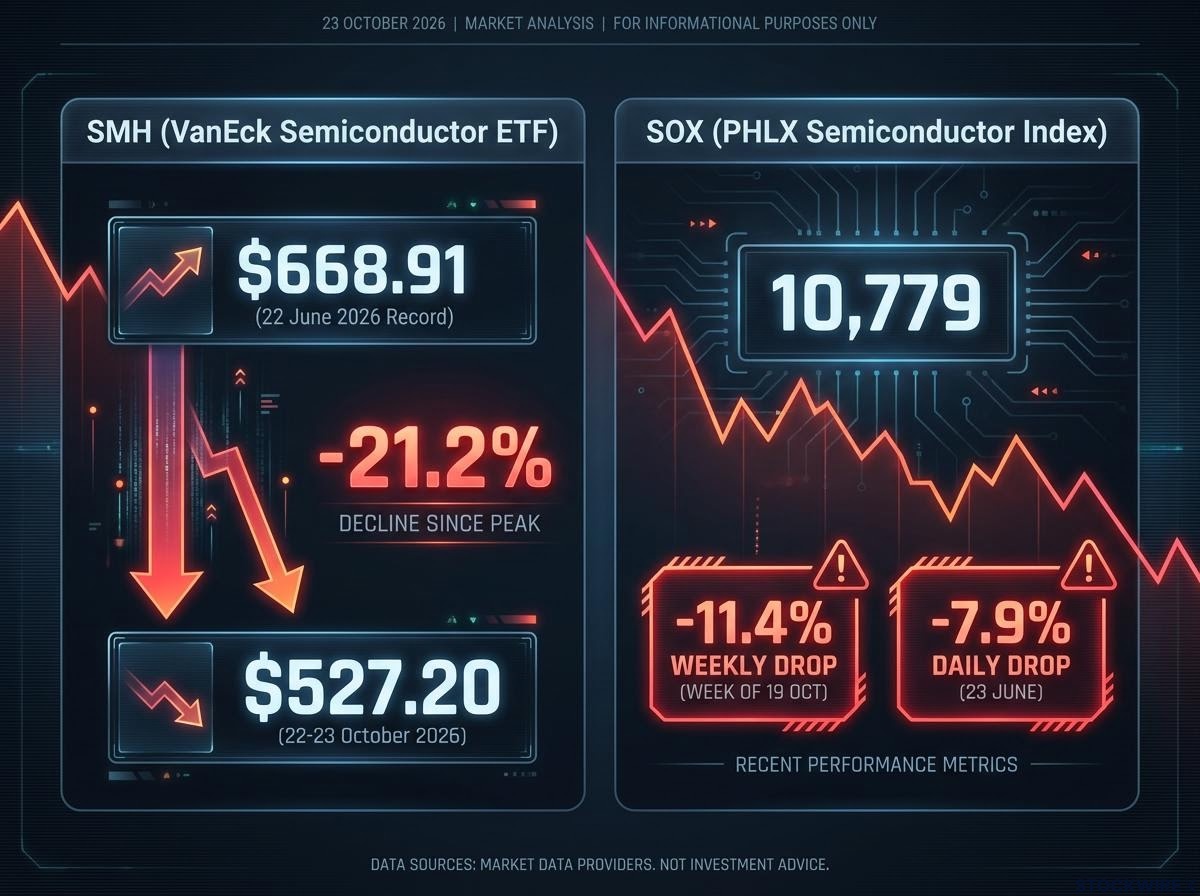
Seven markets, from Brazilian equities to US semiconductors, have each lost a trend line within weeks of one another. The sharpest of these trend line breaks belongs to the VanEck Semiconductor ETF (SMH), which now sits 21.2% below its record high of $668.91, set on 22 June 2026. Many investors can see the damage on a chart. Fewer know what it proves and what it does not.
The pressure has been building. The PHLX Semiconductor Index (SOX) recently posted its longest losing streak since 2008, and emerging market (EM) funds have dropped out of an ascending channel that held for roughly two years.
So is this a correction, or the start of something larger?
The answer depends on a method, not on a single chart. Here is a working way to judge whether a break is noise or a warning, and a clear read on which of these seven breaks carries the most weight.
What does a broken channel actually tell you, and what does it not?
Most investors read a broken trend line as a reversal signal: the uptrend is over, so prices fall from here. That reading is understandable. It is also too confident.
How channels and polarity work
An ascending channel is a price pattern bounded by two rising, roughly parallel lines. The lower line connects rising lows, showing where buyers keep stepping in. The upper line connects rising highs, showing where sellers keep taking profits.
When price falls through the lower line, it tells you buyers are no longer defending the old pace of the advance. It does not tell you they have disappeared.
The second idea is polarity. Polarity is the tendency for broken support to become resistance, because traders remember the prices where they previously bought and sold. A broken lower boundary often acts as a ceiling when price rallies back to it.
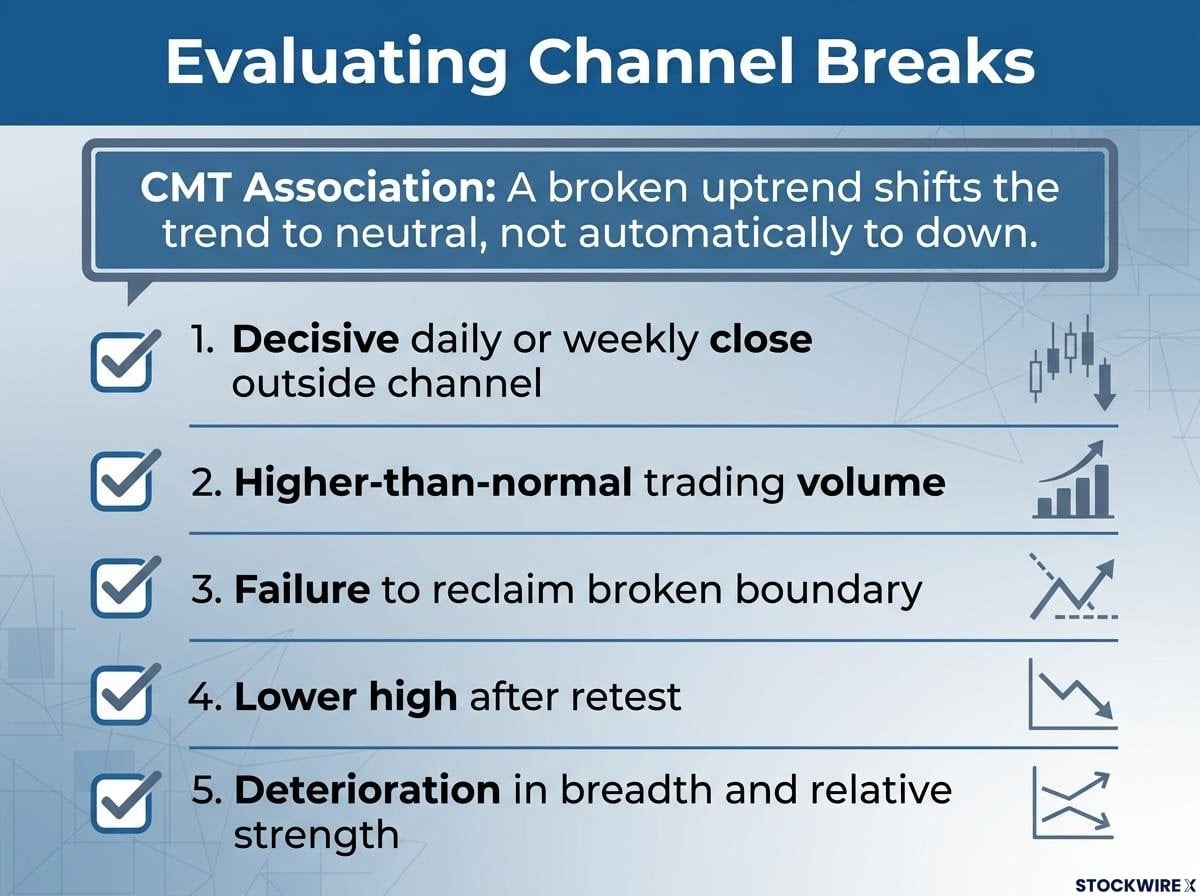
The neutral step: According to the CMT Association, the professional body for technical analysts, a broken uptrend first shifts the trend from up to neutral, not automatically to down. Tests of trendlines are “get ready” warnings that need confirmation.
Confirmation tools and their limits
A break gains weight when other evidence lines up behind it. Technical analysts look for:
A break backed by heavy trading carries more weight than a quiet one, and volume confirmation is what separates a genuine shift in conviction from a routine probe of the line, which is why it sits second on the checklist.
- A decisive daily or weekly close outside the channel
- Higher-than-normal trading volume on the break
- A failure to reclaim the broken boundary
- A lower high after price retests the line
- Deterioration in breadth (how many stocks are participating) and relative strength
Be sceptical of anyone quoting a fixed failure rate for channel breaks. The research finds no dependable universal figure; claims of 50%, 60% or 70% shift with market, timeframe and definition, and mean little without a stated sample.
The method has real limits too. Line placement is subjective, hindsight makes old breaks look obvious, and the charts that get shared tend to be the ones that worked. Treat every break below as an invalidation tool that tells you where risk has changed, not as a forecast of where prices will go.
When big ASX news breaks, our subscribers know first
Why is the semiconductor channel break the one that matters most?
Apply that filter to the seven charts, and one stands apart. The semiconductor break combines the longest trend, the steepest climb and the clearest fundamental debate.
What the chart shows
The broad semiconductor uptrend spans about 18 years. It steepened sharply after ChatGPT’s release on 30 November 2022, as the AI boom pulled capital into chipmakers.
The channel in question began at the Liberation Day lows of April 2025, after the US announced broad tariffs. Prices climbed to records in June, then a sharp drop took SMH cleanly below the lower boundary. The presenter of the chart review called this the week’s most important event and flagged Wednesday’s low as key resistance, without giving a price.
The numbers confirm the scale. SMH closed at $527.20 on 22-23 October 2026, down 13.4% for October. The SOX sat near 10,779 after falling 11.4% in the week reported on 19 October.
A separate technical report from 27 March 2026 had already flagged an earlier break of the same channel, with a reclaim level of about $400. That is a different reference point from a different timeframe, and it should not be confused with the current resistance.
What is driving the sell-off
The chart damage connects to a funding question rather than a demand collapse. On 23 June, the SOX fell 7.9% as investors questioned the scale and financing of hyperscaler AI spending, with Globalt’s Thomas Martin telling Reuters that investors were questioning AI capex and capacity expansion.
Reuters framing (June 2026): The semiconductor decline was presented as a clash between extraordinary AI optimism and doubts about how the next phase of AI infrastructure would be funded and whether it would earn adequate returns.
Valuations, rate risk and competition added to the strain. On 14 October, Reuters reported that signs of growing Chinese competition in memory chips hit EM indexes.
| Interpretation | Supporting evidence | Limitation |
|---|---|---|
| Ordinary correction | SMH rose dramatically on stretched AI valuations and positioning | Can deepen if the broken channel holds as resistance and earnings expectations fall |
| Start of a bear market | Channel from the April 2025 low broke and has not been reclaimed; SMH fell about 85.9% from its 2000 peak to its 2008 low | The 2000 case was a far larger valuation and business-cycle unwind |
| Structural semiconductor problem | Debt-funded AI build-out, uncertain capex returns, high valuations and Chinese memory-chip competition | AI demand may keep growing even if share prices reset |
The 85.9% drawdown shows how far a post-boom break can run, but it is history, not a forecast. The more immediate point concerns your exposure: if you hold broad-market or EM funds, semiconductor leadership is a concentrated risk inside them, so this single break can drag far more than one sector.
Earlier SOX drawdowns of more than 20% in 2011, 2015 and 2018 each unfolded inside a longer bull market, a counterweight to the 2000 precedent that shows how differently post-boom breaks can resolve.
How do the emerging market breaks compare with the earlier one?
That concentration matters most in emerging markets, where the EM ETF in the chart review has just failed its steep channel for the first time in roughly two years. The break was about 8 trading days old at recording.
The parallel is uncomfortable. In the fund’s roughly 20-year history, the presenter identified one comparable steep channel, and its failure was followed by a bear market lasting well over a year.
| Attribute | Earlier channel failure | Current channel failure |
|---|---|---|
| Channel height | Lower peak before breaking | Climbed higher before breaking |
| Aftermath | Bear market lasting well over a year | About 8 trading days old at recording; gap from Wednesday’s low marks overhead supply |
| Drivers | Not specified in the source | Semiconductor exposure, China, trade, geopolitics, energy |
| Status | Resolved | Unconfirmed; presenter does not call a full top |
Then the caveats arrive. The source does not say whether its chart shows EEM or VWO, and current levels for both were not found. That distinction is not trivial: Strategas-related commentary from June 2026 put EEM’s semiconductor exposure about five percentage points above VWO’s, so EEM can behave partly like an AI fund.
The EEM versus VWO question is partly a matter of index provider methodology, because MSCI and FTSE classify countries such as South Korea differently, which changes how much semiconductor exposure each fund carries.
The causes also run wider than chips. Reuters commentary on 20 October listed several pressures acting at once:
- Geopolitical conflict
- Trade friction
- An energy-price shock
- Fears of an AI bubble
The 2018 EM bear market offers a looser analogue, when top Chinese shares fell 25% and Turkey and Argentina dropped about 45% and 50% on rising rates, trade tensions and currency stress. For you, the practical read is that EM exposure carries several overlapping risks, not just a chart pattern, so the break is a prompt to check what your fund actually owns.
Brazil and China as case studies
Brazil (EWZ) hit record highs a couple of weeks before the recording, then an election-driven gap left it pressing against former support. Reuters reported that Flávio Bolsonaro’s surprise first-round lead lifted stocks 7.7% and the real by almost 4%, while a Quaest poll showed Bolsonaro at 46% and Lula at 44% ahead of the 25 October runoff. The presenter expects at least part of that gap to fill.
China (FXI) shows what a long-broken trend looks like. The fund peaked near $73 on 31 October 2007, fell roughly 73% into 2008, and still sat about 53% below that peak on a price basis in October 2026, drifting toward the presenter’s long-term target of about 27.
What are small caps, the S&P 500 and financials saying?
Back in the US, the breadth evidence tells a consistent story of failed retests.
Weak market breadth is the common thread here, with only a minority of S&P 500 stocks above their 50-day average even as the index sits near its record, though breadth warnings have often failed as timing tools.
IWM, the Russell 2000 small-cap fund, broke its uptrend and repeatedly met resistance at the broken line almost to the penny, sliding from a mid-August record in the presenter’s view. SPY broke a shorter-term line anchored to the Iran War bottom; Wednesday’s rally touched it and reversed. XLF lost a trend line dating to 2023 and formed a small topping pattern.
| Market | Broken line | Resistance noted | Status |
|---|---|---|---|
| IWM | Uptrend into mid-August record | Broken line; dashed short-term line | $275.75 on 23 October, up 1.96% on the week |
| SPY | Shorter-term line from Iran War bottom | Broken line rejected Wednesday’s rally | $759.97 on 23 October, near 4 August levels |
| XLF | Longer-term line dating to 2023 | Thursday’s high | Small topping pattern; latest level not found |
The 2022 precedent shows how this can play out. Nasdaq Dorsey Wright reported IWM breaking support near $205, about 15% below its November 2021 high, and later described a rally into the 50-day moving average as a failed retest.
Still, the bearish read has clear exit conditions:
- A quick reclaim of the broken lines
- Improving breadth across stocks
- Rising volume on the recovery
These are signs that risk appetite is narrowing, but they are shorter-term and less decisive than the semiconductor break. IWM’s weekly bounce is a reminder that a reclaim remains possible.
What the breaks change, and what they do not
The breaks confirm that leadership and risk appetite have deteriorated, with semiconductors the clearest casualty. They do not yet establish a secular bear market, and the presenter stops short of calling a definitive top.
The dividing line is whether broken boundaries are reclaimed, and whether earnings, AI-capex expectations, rates and liquidity improve. Three variables deserve your attention:
- Whether SMH, EM funds, SPY and IWM reclaim their broken lines on rising volume
- The 25 October Brazil runoff result and how EM funds react
- Upcoming major tech earnings and what they signal about AI spending
These statements are speculative and subject to change based on market developments. Past performance does not guarantee future results.
This article is for informational purposes only and should not be considered financial advice. Investors should conduct their own research and consult with financial professionals before making investment decisions.