
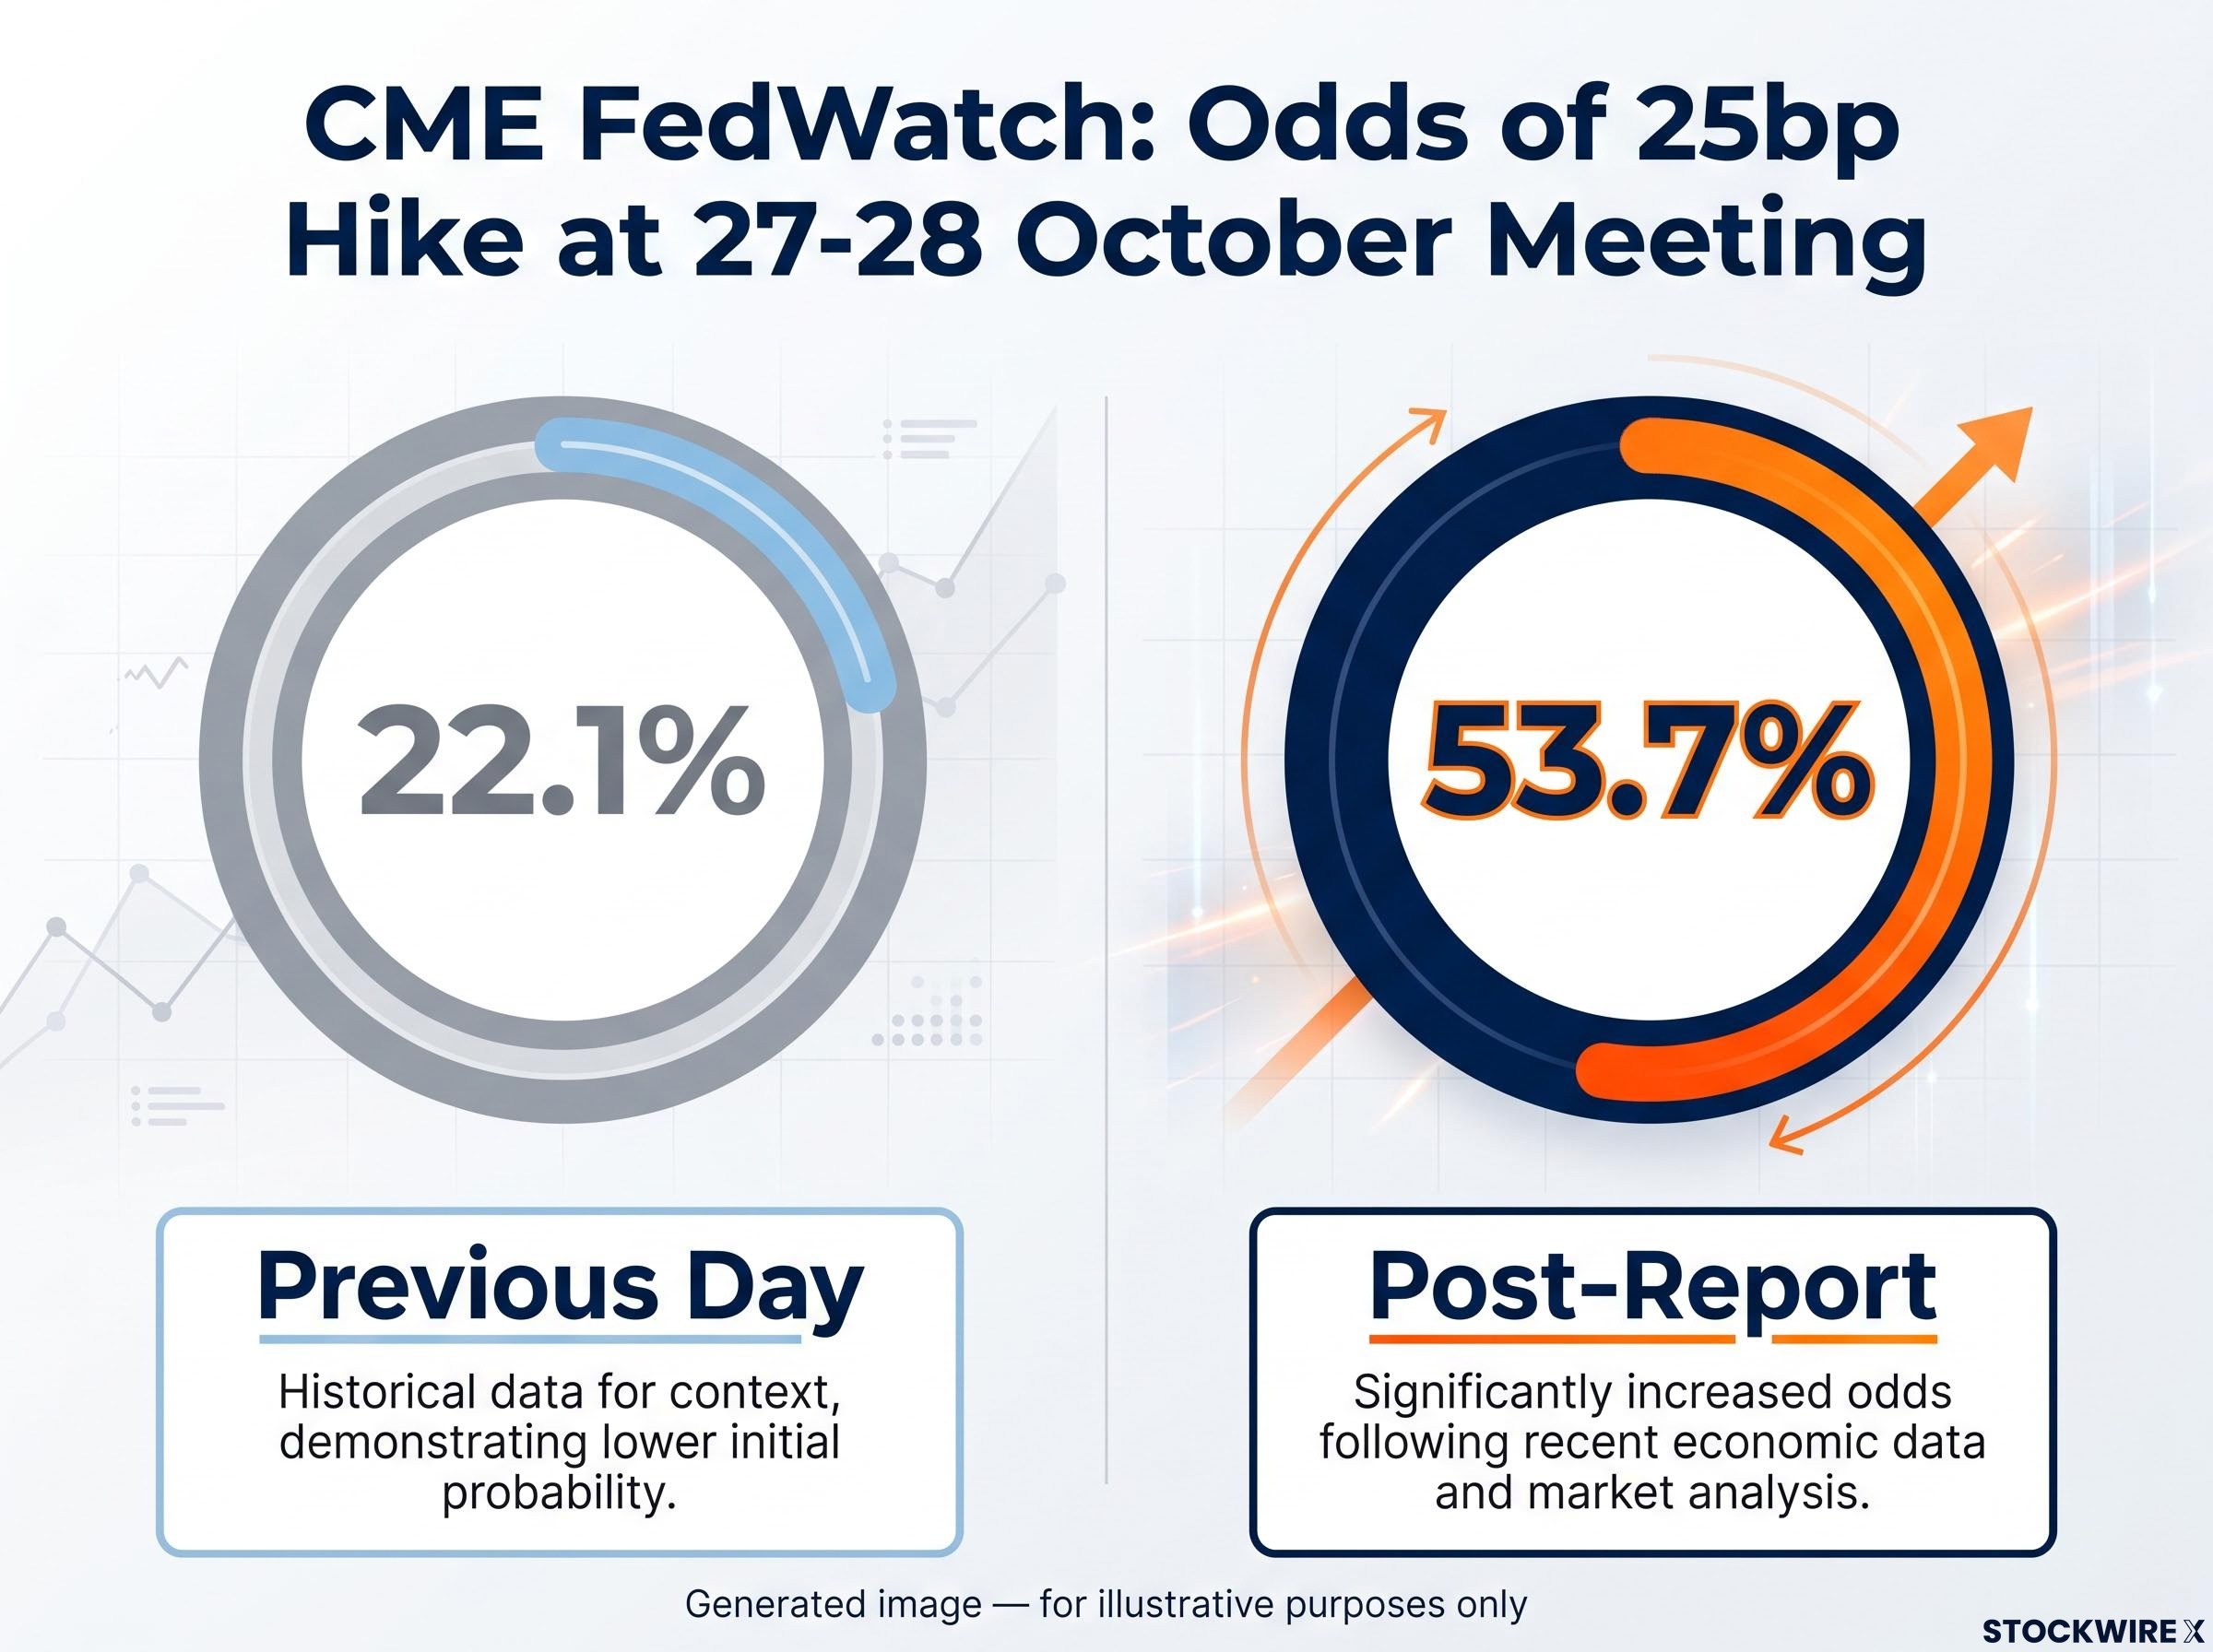
Within a day of the September CPI inflation report, traders turned an outside chance of a Federal Reserve rate hike into a coin flip. CME FedWatch odds of a hike at the 27-28 October meeting jumped from 22.1% to about 54%, the sharpest repricing of the cycle.
The trigger was core inflation. The Bureau of Labor Statistics (BLS) reported core CPI up 0.3% in September, or 2.6% annually, against a 0.2% forecast. Headline CPI rose 3.7% over the year against 3.6% expected.
The monthly headline rise of 0.6% matched consensus exactly. The surprise sat underneath, in the prices that exclude food and energy.
Here is what drove the number, why economists are reading it in two opposing ways, and what it could mean for your mortgage rate, your stocks and your bonds before the Fed meets in less than two weeks.
Why did rate-hike odds jump after the September CPI inflation report?
The repricing came fast. CNBC reported that the CME FedWatch probability of a 25 basis point hike in October climbed to 53.7% from 22.1% the previous day. A basis point is one-hundredth of a percentage point. Odds of at least one hike by year-end passed 95%, and the chance of a cumulative 50bp of hikes by December roughly doubled to about 40%.
Release day on Wednesday looked like this:
- Nasdaq fell about 2%, with chip stocks leading losses
- S&P 500 dropped about 1%
- Gold moved lower
- The 10-year Treasury yield rose to 5.30%, up about 8bp, according to CNN
Yield reports conflict. An earlier CNBC update put the 10-year at 5.19%, down slightly, but the later post-release CNN figure better captures the market’s reaction to the data.
Here is the gap between expectations and reality.
| Measure | Monthly actual | Annual actual | Consensus | Variance |
|---|---|---|---|---|
| Headline CPI | +0.6% | +3.7% | +0.6% m/m; +3.6% y/y | In line monthly; +0.1 annual |
| Core CPI | +0.3% | +2.6% (August: 2.4%) | +0.2% m/m; +2.5% y/y | +0.1 on both |
A 0.1 point miss mattered because markets had flagged it in advance. Reuters reported on 11 September that Seema Shah of Principal Asset Management saw a clean 0.3% core print, alongside rising energy prices, as effectively locking in a hike.
For you, higher hike odds mean borrowing costs are unlikely to ease soon. Freddie Mac put the 30-year fixed mortgage at 7.40% for the week ending 8 October, up from 7.28%, and rate-sensitive tech stocks face continued pressure.
For readers wanting to see how futures pricing swung on Fed speeches, our deep-dive into October Fed hike odds traces the moves from 8.8% to 73% and back.
When big ASX news breaks, our subscribers know first
What pushed prices up, and what held back?
Gasoline did most of the shouting. Pump prices rose 9.1% in September alone.
Key statistic: Gasoline accounted for more than half of the monthly all-items increase in September.
Over the year, fuel oil is up 74%, gasoline 34%, utility gas 5% and electricity 4.4%. Airfares have climbed 22%.
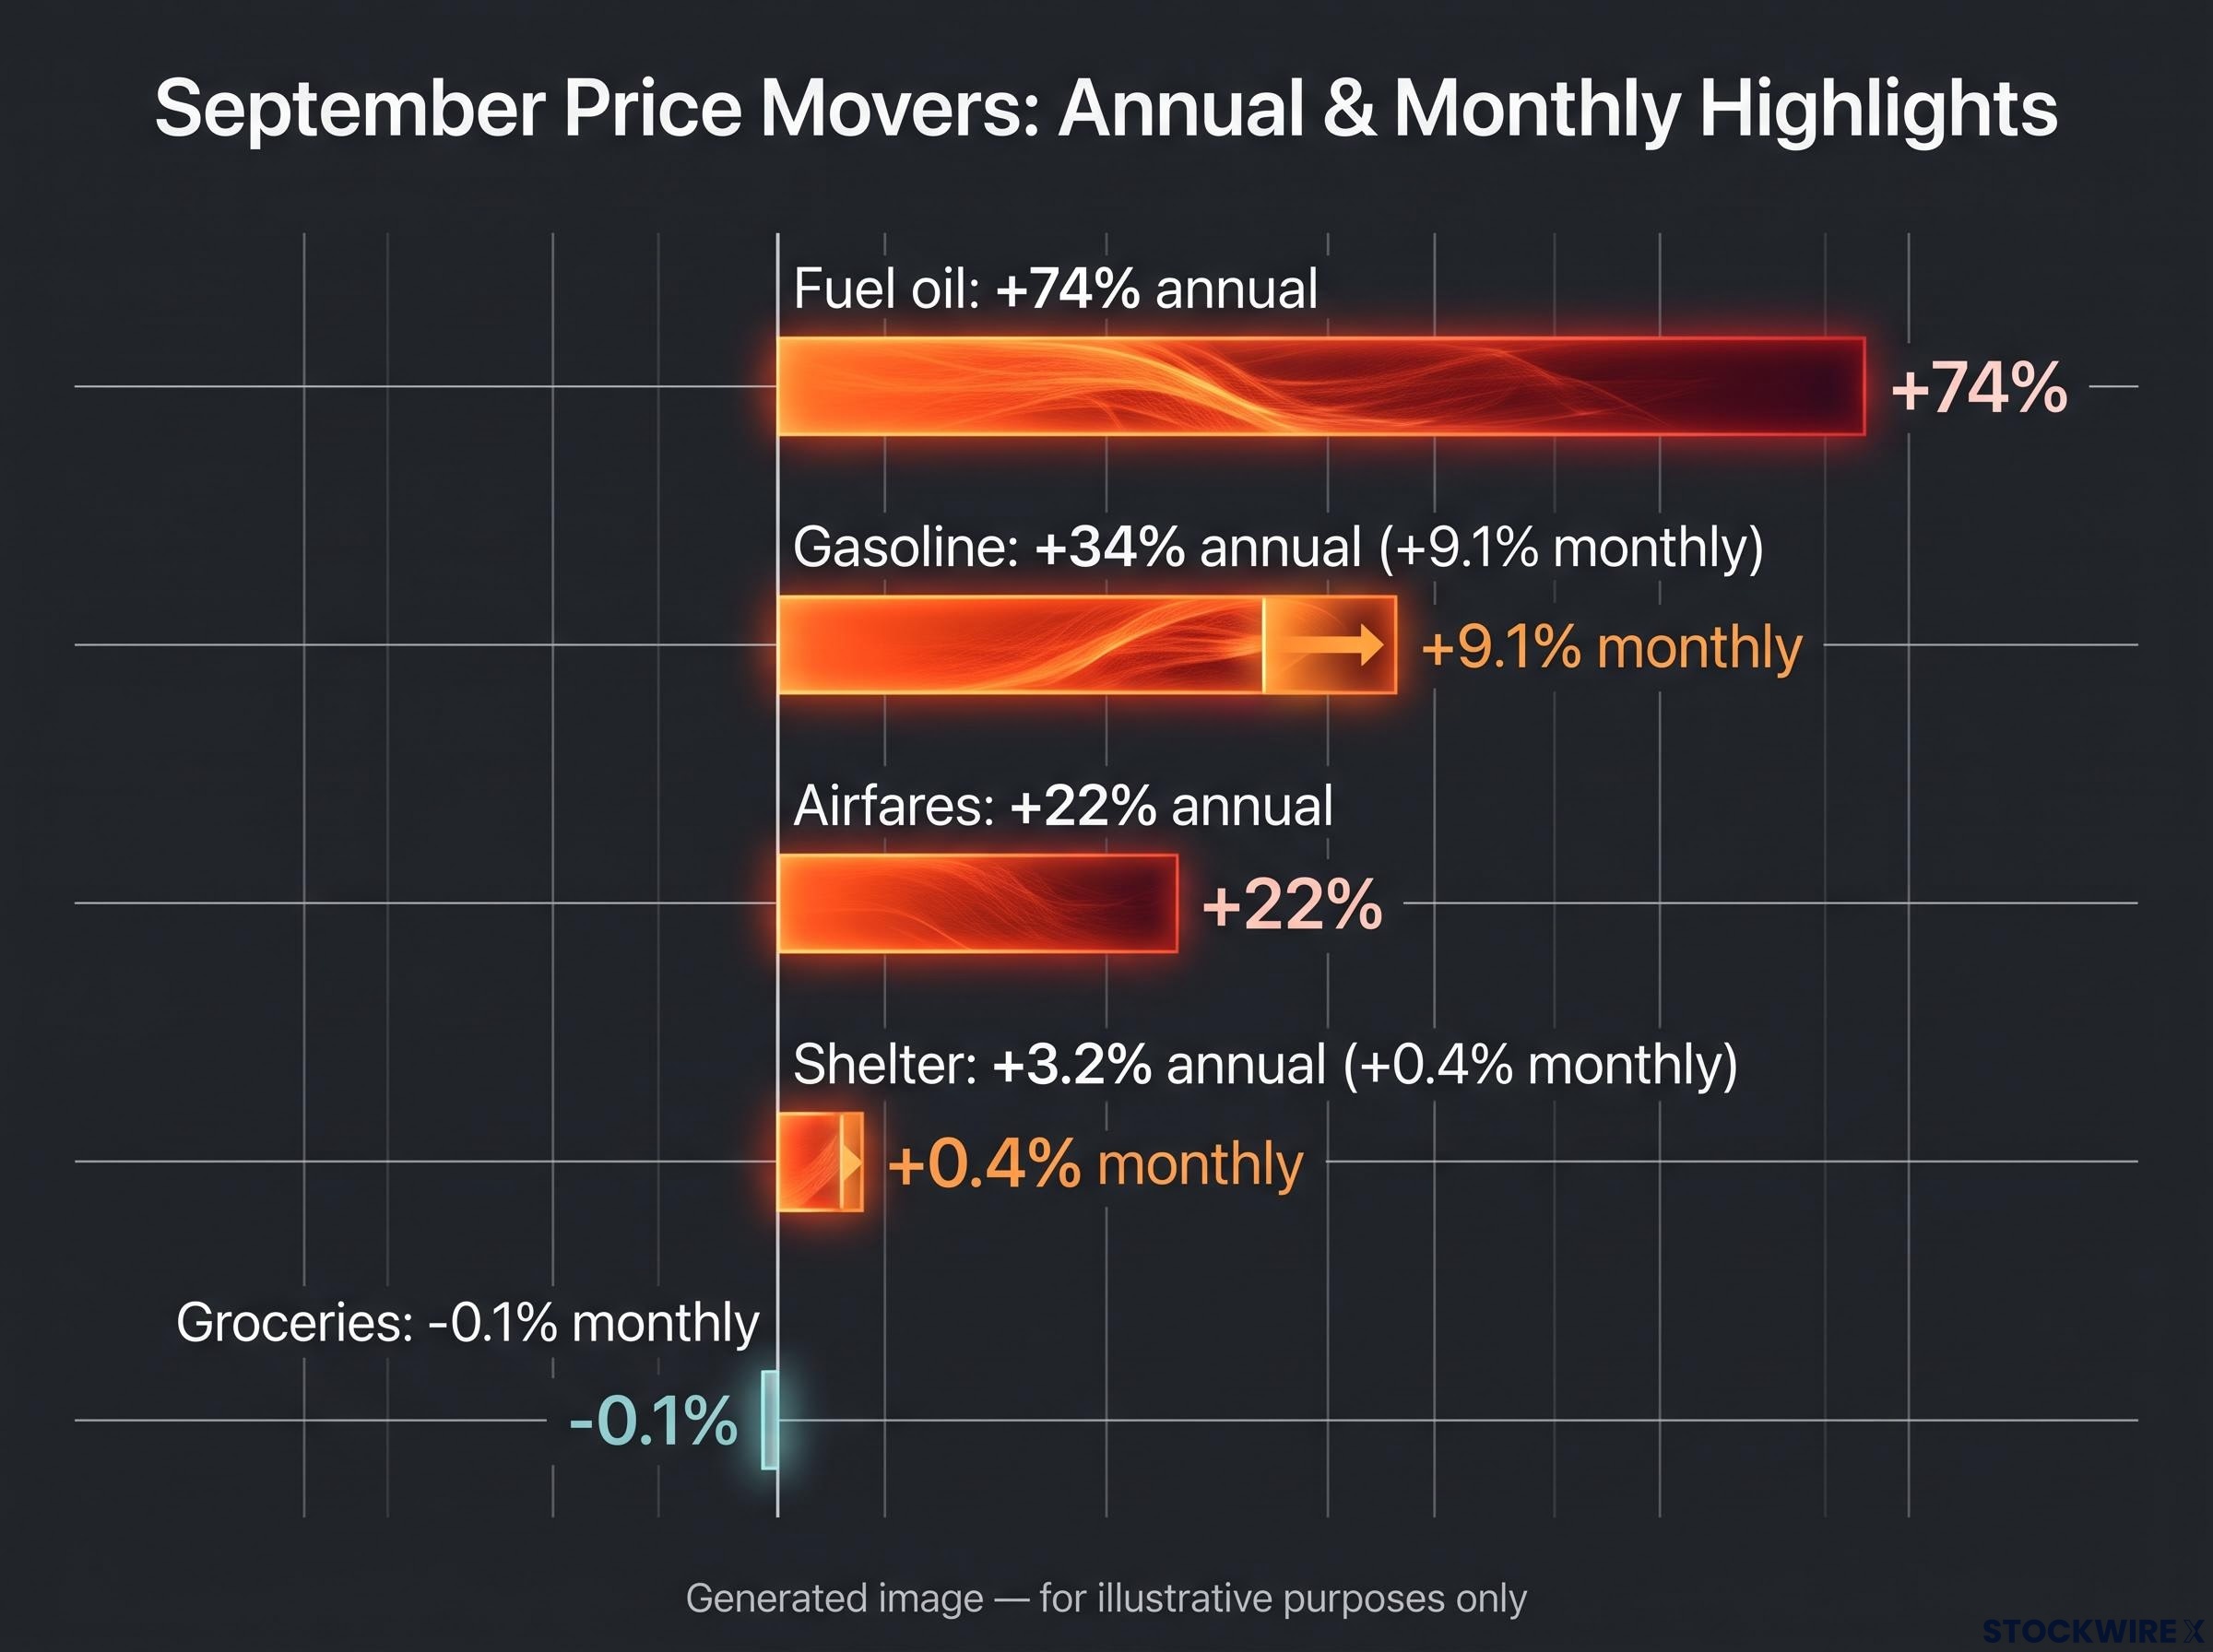
The quieter story is shelter, which rose 0.4% after 0.3% in August. Shelter and owners’ equivalent rent (OER) are up 3.2% from a year earlier.
Why shelter keeps rising while housing cools
OER is the BLS estimate of what homeowners would pay to rent their own home, based on owners’ own estimates rather than sale prices. Leases reset slowly, so analysts commonly estimate a 12-18 month lag before market rent changes appear in official data. OER makes up roughly 73% of shelter, and shelter is about a quarter to a third of the CPI basket.
| Component | Monthly change | Annual change | Direction signal |
|---|---|---|---|
| Gasoline | +9.1% | +34% | Main driver |
| Shelter | +0.4% | +3.2% | Sticky |
| Used cars and trucks | +0.7% | -1.5% | Mixed |
| New cars | Not specified | +0.6% | Below headline |
| Groceries | -0.1% | Not specified | Easing |
Groceries offered some relief, with beef down 1%, milk 2% and dairy 0.9%. That relief is small next to what you pay at the pump and in rent.
The pipeline looks worse still. September PPI, released today, rose 1.3% monthly and 6.3% annually, with energy up 10.8%, the largest monthly gain since March 2022. Producer prices often lead consumer prices, so more cost pressure may be on its way to you.
Is this an energy shock or broader inflation?
Treasury Secretary Scott Bessent argues energy is the whole story. In remarks on 7 October, he put underlying inflation at about 2.3%, citing strong Atlanta Fed GDP tracking and framing the shock as tied to the Middle East conflict. Bank of America, via Morningstar, expects second-round effects to stay relatively contained.
The other camp disagrees. Morningstar’s Preston Caldwell noted three-month annualised core inflation hit 3.4%, the fastest in a year. Christopher Rupkey of FWDBONDS told USA Today the energy shock is increasingly feeding into core goods and services.
| View | Who | Core argument | Reading of September |
|---|---|---|---|
| Energy shock | Bessent; Bank of America | Temporary; core well below headline | Gasoline explains over half the rise |
| Broadening | Caldwell; Rupkey | Energy spilling into core prices | 3.4% three-month core is a warning |
The Fed faces risk either way. Policy cannot produce oil, and hiking into a supply shock could hurt employment without lowering gasoline prices.
History offers partial comfort. In 1973-74, oil quadrupled and inflation took hold. Boston Fed research finds a 33% oil shock lifted year-ahead PCE inflation about 2.2 points before the mid-1980s, against about 1.5 points today.
The gap between 2.6% core and 3.7% headline is the battleground. The next one or two core readings will tell you whether September was a one-off or the start of a trend, and that is exactly what the Fed and markets are watching.
Analyst estimates suggest 40-60% of an oil price increase can pass through to core CPI over three to six months, which is why the next core readings carry more policy weight than the headline.
What does the money supply say about where inflation goes next?
Steve Hanke of Johns Hopkins rejects the energy-only story outright, calling Bessent’s view “totally incorrect”. His argument runs through money growth:
- Broad money growth above roughly 6% a year is inconsistent with a 2% inflation target
- Excess money lifts nominal spending after about 12-24 months
- Higher spending pushes inflation up
- Rates stay elevated until money growth slows
Hanke cites Divisia M4, published by the Center for Financial Stability, growing about 7.5%. A current CFS figure could not be independently confirmed.
Fed Chair Kevin Warsh has framed recent policy through a monetarist analytical lens, treating M2 and Divisia M4 as active co-signals, which gives Hanke’s money-growth argument more institutional weight than it carried under the prior Fed leadership.
Hanke’s view: Rates stay high until money growth slows.
The AI lending channel
Hanke says bank lending tied to AI infrastructure is expanding deposits and therefore the money supply. JPMorgan estimates AI infrastructure investment at roughly $1 trillion in 2026, and about $1.4 trillion of debt has reportedly financed data centres, with banks holding about half. The Dallas Fed estimates AI-related investment-grade bond issuance could reach about $300 billion this year, pressuring long yields.
Hanke also sees no near-term recession and points to real wages falling for roughly six or seven months, citing the Atlanta Fed wage tracker. Mainstream economists counter that broad-money relationships have become unstable, and the Minneapolis Fed describes AI’s aggregate inflation effect as present but moderate.
If the monetarists are right, you should not plan your portfolio or borrowing around a quick return to 2% inflation.
What the hot print changes, and what it does not
The September data has pushed hike odds above 50%, but one month cannot settle whether this is an energy blip or broadening inflation. Before the 27-28 October FOMC meeting, watch three things:
- Whether core inflation repeats near 0.3%
- Whether PPI’s surge passes through to consumer prices
- Whether gasoline prices ease
Equities, especially long-duration tech, remain exposed to higher rates. Long-dated bonds face a rising term premium, the extra yield investors demand for holding longer maturities. Mortgages near 7.4% are unlikely to fall soon, while gold is caught between inflation support and higher real yields.
A hotter print lifts rate-hike expectations and a stronger dollar, which raises the opportunity cost of holding a non-yielding asset like gold and explains why higher real yields weigh on bullion.
Separate what you know, the data and the repricing, from what is still contested: the cause and its persistence.
This article is for informational purposes only and should not be considered financial advice. Investors should conduct their own research and consult with financial professionals before making investment decisions. Past performance does not guarantee future results. Financial projections are subject to market conditions and various risk factors.