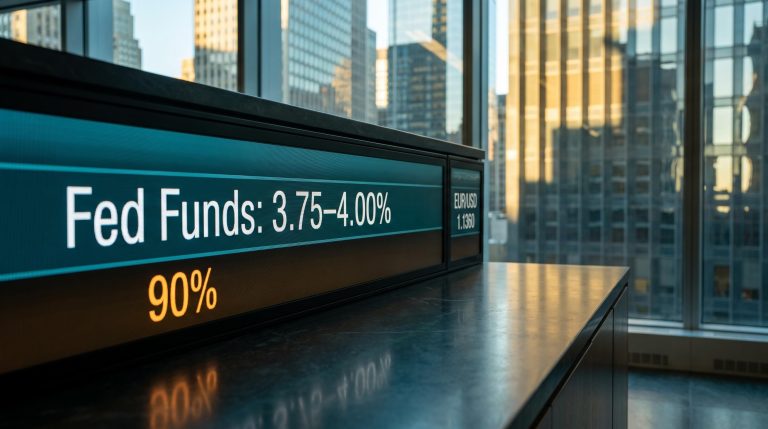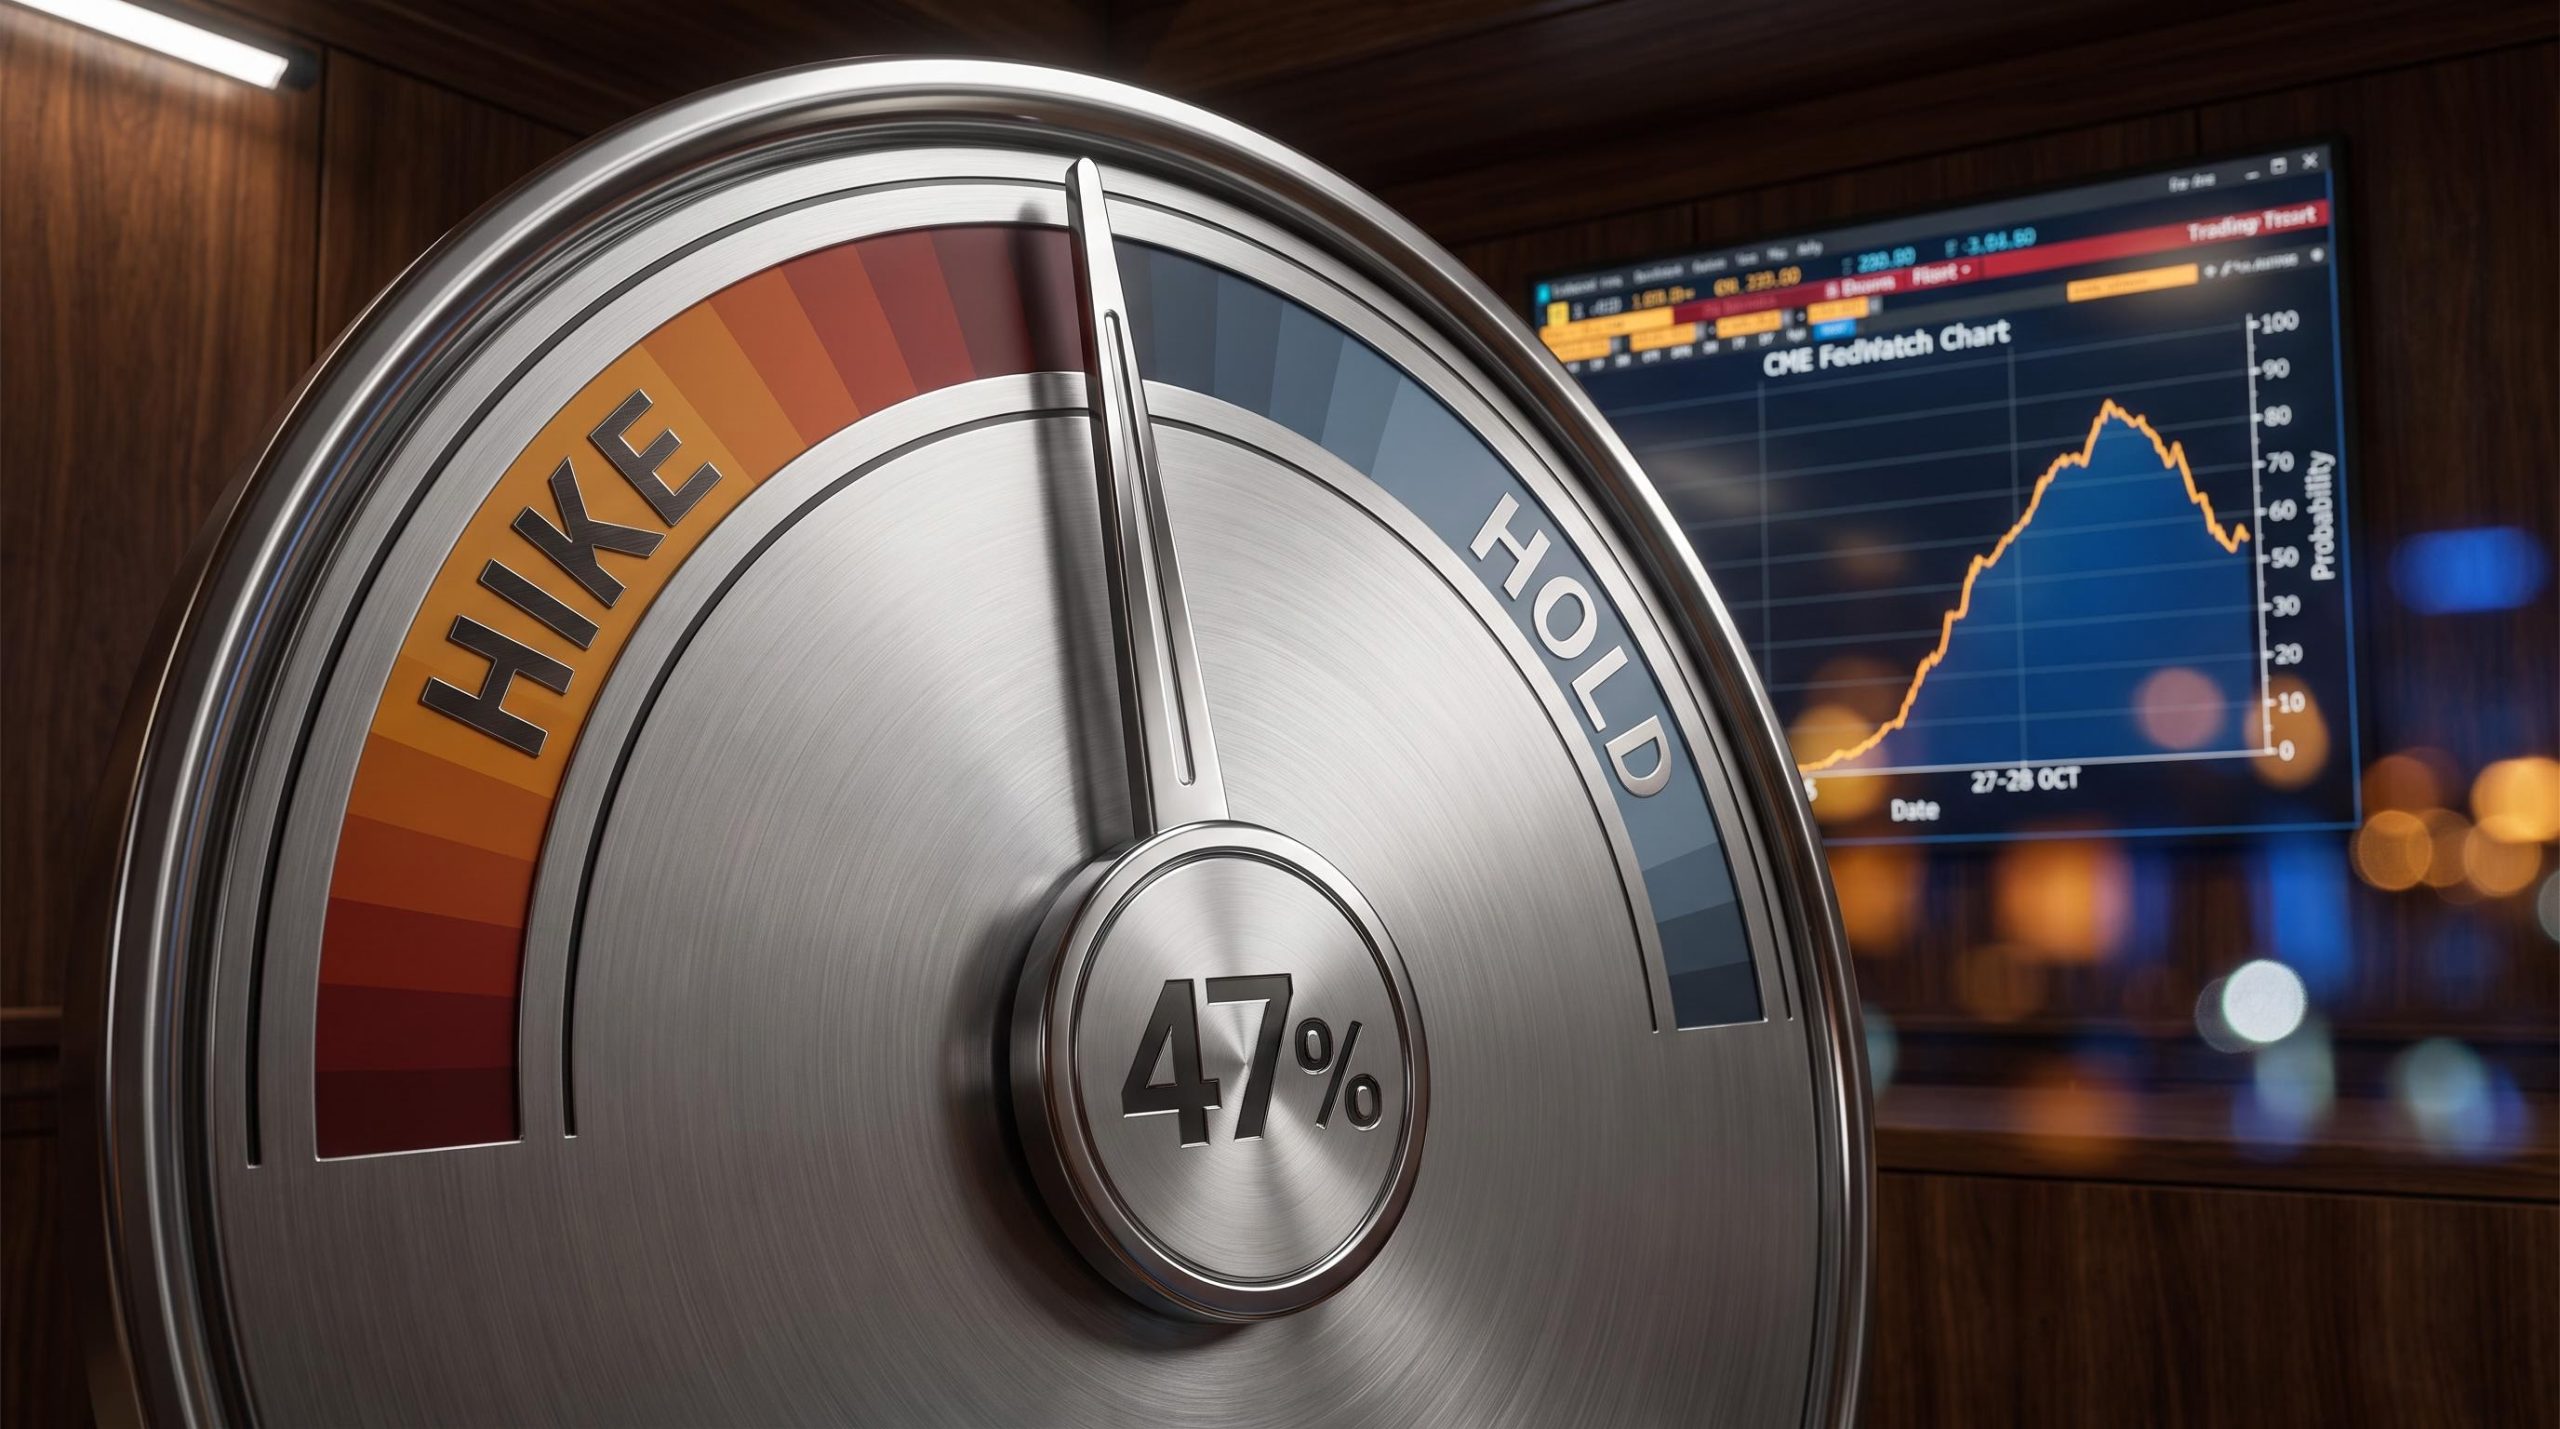
Fed funds futures put the odds of another rate hike at the October meeting at roughly 47%, with the decision less than a month away and the data that will settle it not yet released.
That number is more interesting than a lopsided one would be. At near-parity, the market is genuinely split, no consensus has formed, and every incoming data point carries maximum influence over where the odds land next. For an investor, that creates a two-sided problem: a surprise hike reprices rate-sensitive assets one way, a hold reprices them the other, and no single position hedges both outcomes cleanly.
Here is what the probability split actually means for how you read the next jobs report, what these odds measure, and how to interpret the next CME FedWatch update you see before the 27-28 October meeting.
How the odds moved from 8% to 47% in six weeks
The 47% figure looks like a neutral baseline until you trace how it got there. It is the residue of a much sharper swing that got partially corrected, not a stable reading that settled on its own.
Rewind to late August. Implied odds for an October hike sat at roughly 8.8%, according to CME FedWatch data reported by Finance Yahoo. A consecutive move looked like a remote possibility.
Then the September meeting delivered a 25 basis point hike, lifting the federal funds target range to 3.75-4.00%. Odds for October jumped to around 53% immediately afterward, Reuters reported via CME FedWatch on 17 September.
From there, the climb accelerated. Fed Vice Chair Michael Barr flagged risks to the 2% inflation target, fresh S&P Global data pointed to building price pressures, and the odds surged to better than 70%. CNBC put the reading near 73% on 23 September; Finance Yahoo had it at nearly 70% the following day.
Here is the arc at a glance:
- Late August: approximately 8.8% implied odds
- Post-September hike (17 September): approximately 53%
- Peak (23-24 September): 70-73% after Barr’s comments and hot inflation data
- Post-Williams (30 September): back to approximately 47%
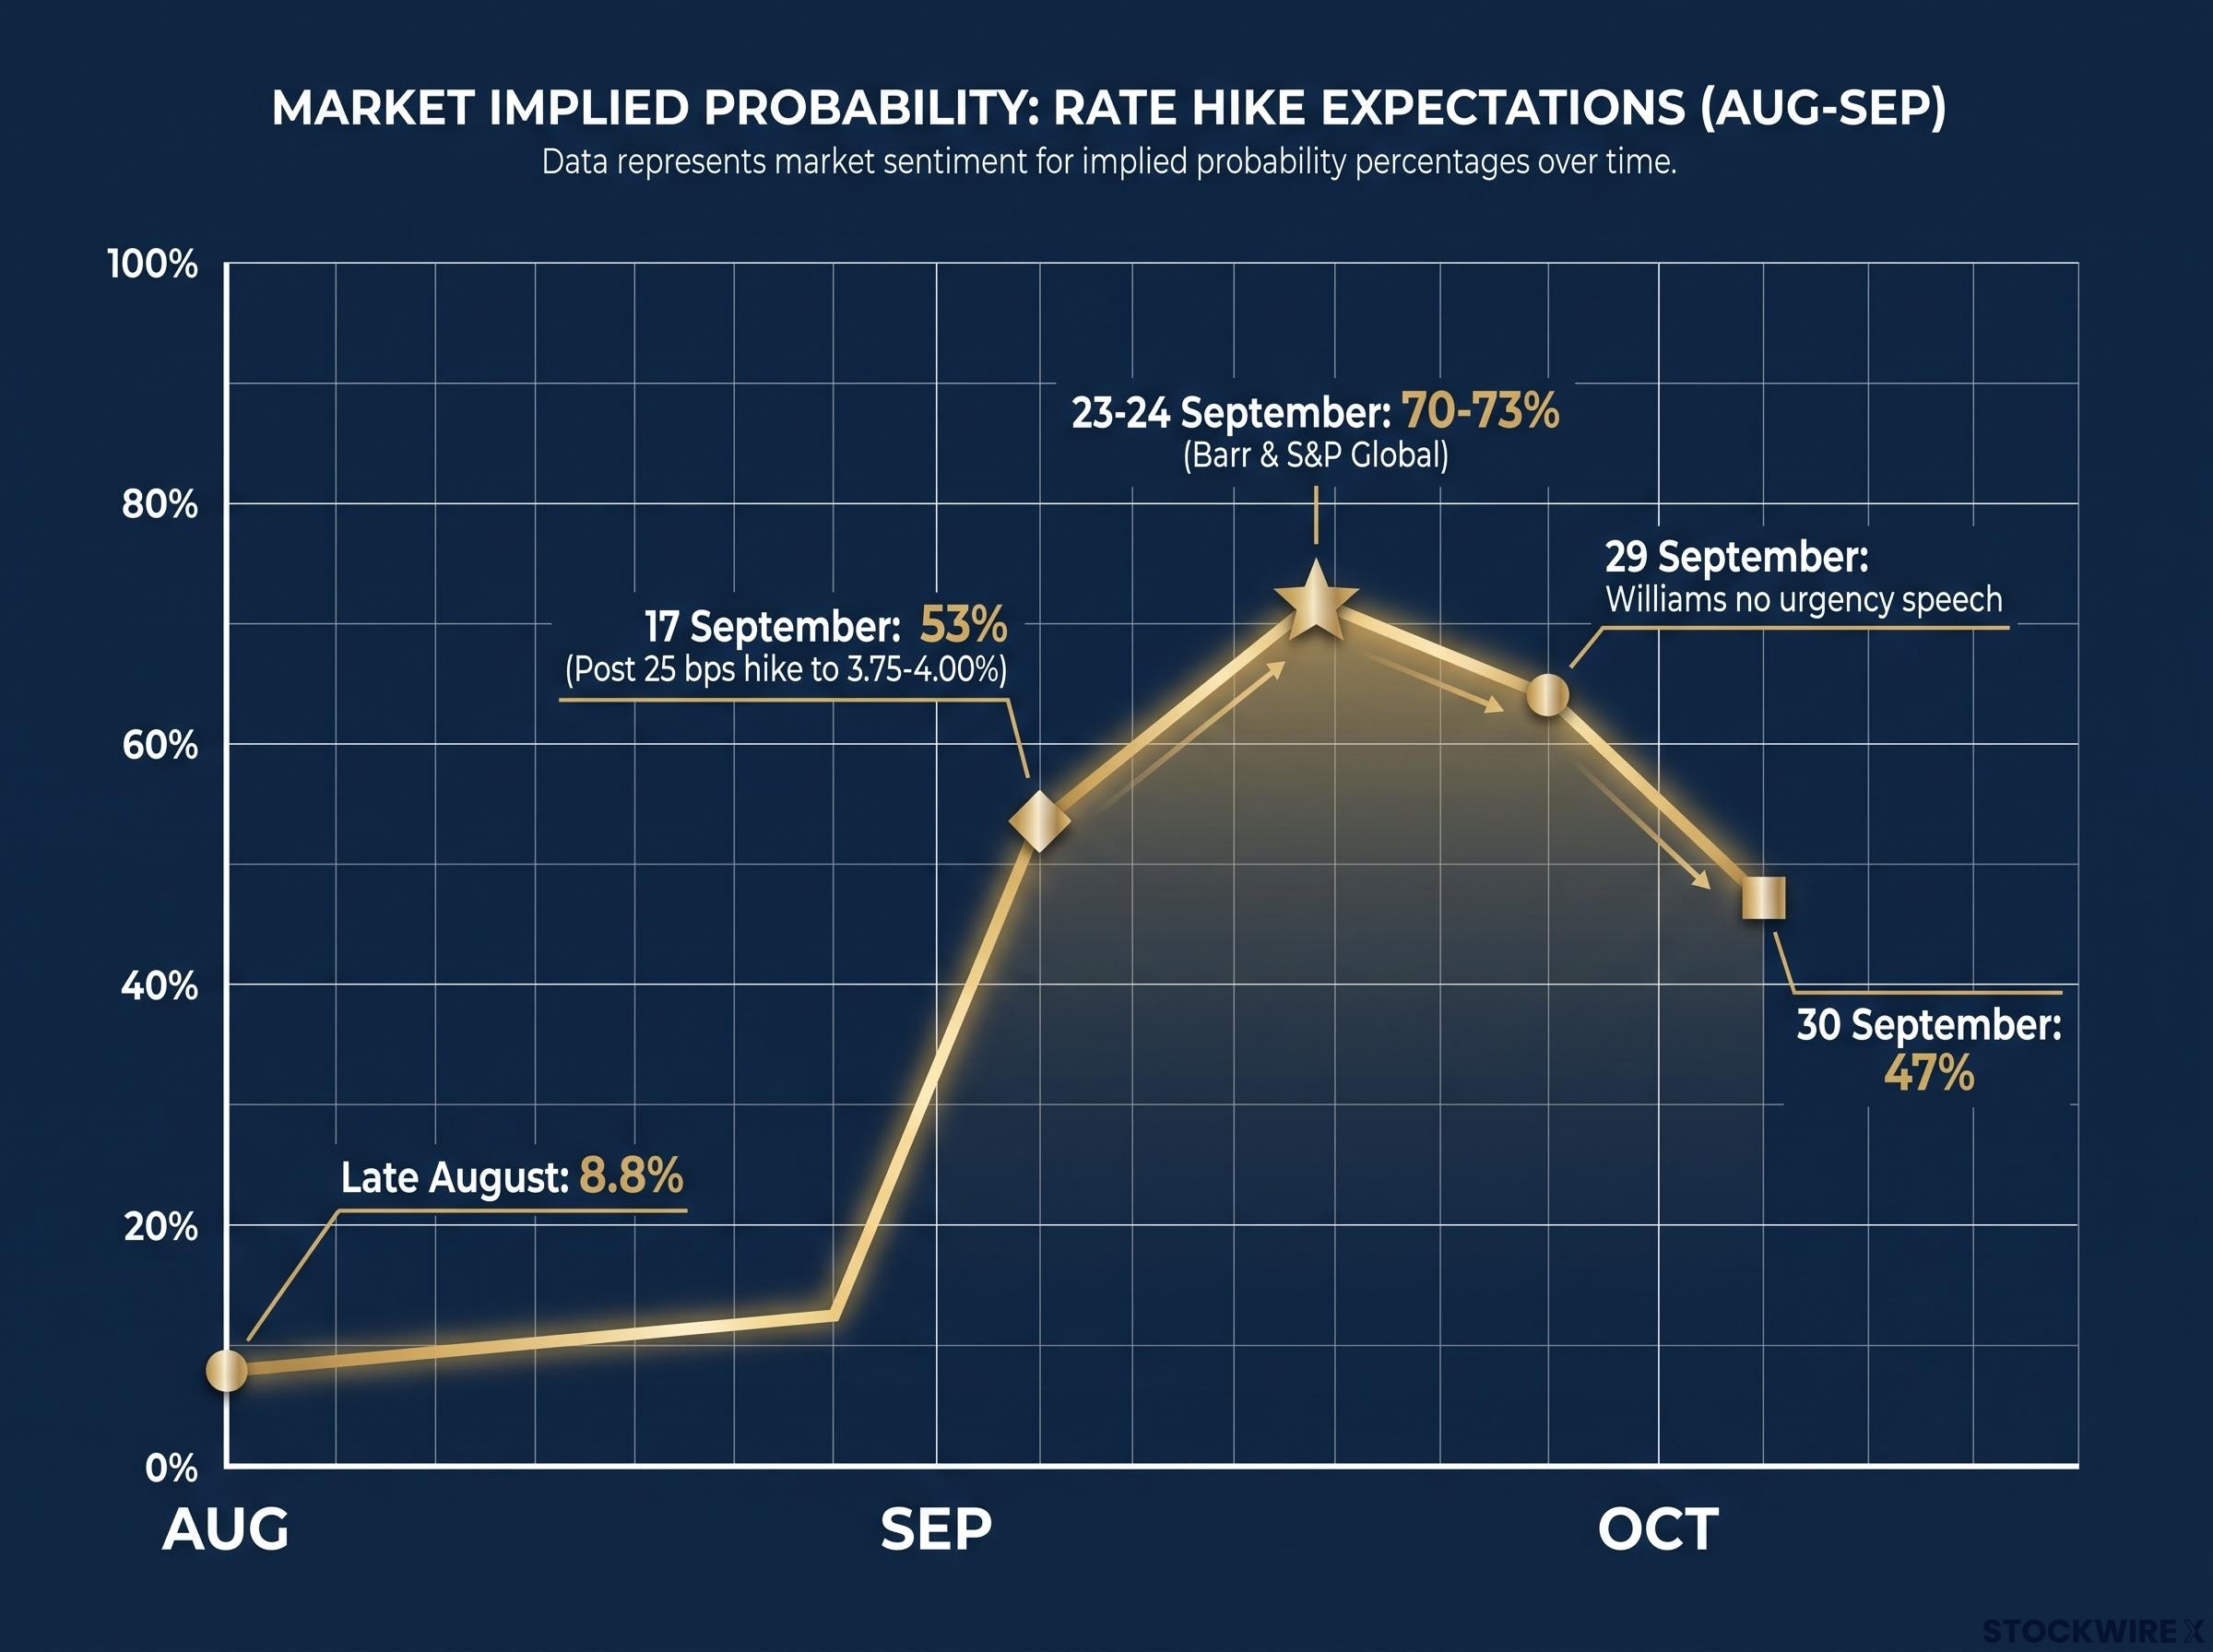
The correction came from New York Fed President John Williams. Speaking at the University at Buffalo on 29 September, he pushed directly against the back-to-back narrative the market had built.
“With the policy action we took at our September meeting, there is no need for urgency, and we have time to gather more information.”
Williams did not rule out further tightening. He framed his baseline as one more hike “late this year” if the data cooperated, subject to incoming information. That is a deliberate effort to deflate over-extended positioning, not a neutral data update. Odds fell from roughly 70% to about 50% on that single speech, per Seoul Economic Daily.
There is a structural reason the pushback landed. The October meeting is a non-projection meeting, meaning it lacks the updated Summary of Economic Projections that accompanies December. Without fresh projections as cover, the case for a high-profile consecutive move weakens.
The read for you is straightforward: a 47% figure that swung this violently reflects recent narrative flows and positioning, not a settled consensus. The next jobs report or inflation print carries disproportionate weight precisely because the number is this unstable.
When big ASX news breaks, our subscribers know first
What is actually driving the case for a consecutive hike
Williams pushed the odds down, but they did not collapse. They held above 40% because the case for October rests on a set of reinforcing signals, not a handful of unconnected data points.
The proximate trigger was inflation. Renewed S&P Global data showed growing price pressures, and Barr’s explicit reference to risks around the 2% target gave the surge to 70% its foundation. When a top Fed official flags inflation risk at the same moment the data confirms it, markets read that as a genuine tightening signal rather than noise.
Barr’s explicit reference to the 2% inflation target captures a broader tension in dual mandate tensions that the current data makes acute: the Fed is simultaneously seeing unemployment hold near 4.1% while inflation sits above target, a configuration in which the committee faces the hardest tradeoffs between its competing objectives.
The labour market added a second layer. The unemployment rate is expected to hold near 4.1%, jobless claims remain persistently low, and PMI readings from the prior week were firm. According to DBS Group Research economist Eugene Leow, several US employment indicators have improved relative to conditions six months ago. That paints a labour market that has cooled without breaking, which keeps the door open to further tightening.
Labour market resilience, however, is not a monolithic signal: beneath persistently low jobless claims and firm PMI readings, participation rate shifts and savings rate compression complicate any straightforward reading of employment as a green light for further tightening.
The institutional response amplified the move
The third driver was the banks. After the September decision, both Goldman Sachs and Bank of America shifted their house views to an October hike call, Reuters and Mitrade reported. When major institutions move together, the effect on odds compounds.
The three drivers in order of impact:
- Inflation persistence: fresh S&P Global data and Barr’s reference to risks around the 2% target
- Labour market resilience: unemployment near 4.1%, persistently low jobless claims, firm PMI readings
- Institutional forecast shifts: Goldman and Bank of America both moving to October hike calls
Those forecast changes created self-reinforcing momentum. Odds climbed from roughly 30% before the September decision to 55-62% as the bank revisions filtered through, per Mitrade. The 2-year Treasury yield reached 4.89% on 29 September, reflecting the tightening expectations embedded in the front end of the curve. UBS, for its part, has priced roughly 91 basis points of cumulative hikes over the coming year, the longer-run backdrop against which any single meeting gets judged.
For you, this means the October case is not speculative chatter. It is grounded in real signals that major institutions acted on, which is exactly why Williams had to speak so pointedly to deflate it. Distinguishing fundamental tightening pressure from positioning-driven overshoot is the difference between reading the next FedWatch swing correctly and overreacting to it.
How Fed funds futures odds actually work, and why they move so sharply
A percentage on a screen looks authoritative. Understanding what sits behind it changes how much weight you should give it.
CME FedWatch derives its probabilities from 30-day Fed funds futures prices. The tool takes the futures-implied average effective funds rate for a given contract month and maps it into probabilities across the discrete target-range outcomes the Fed might set, such as 3.75-4.00% or 4.00-4.25%, under a no-arbitrage assumption, according to Finance Yahoo.
The key point is what those probabilities embed. They are not pure forecasts. They carry risk premia, positioning constraints, and liquidity conditions alongside genuine rate expectations. During periods of elevated uncertainty, that mix can systematically overprice tail outcomes, so the number reflects where the crowd is positioned today rather than what the Fed will do.
The October arc is the clearest example available. Odds ran from under 20% in late August to over 70% by late September, then back to roughly 47% after Williams spoke. A single speech moved the reading by about 20 percentage points, Seoul Economic Daily reported, which tells you how quickly sentiment repositions when a policymaker speaks directly.
The speed of that repricing reflects a feature of FOMC structure that is easy to underestimate: the voting composition and the authority of regional presidents differ meaningfully, which is why a single speech from Williams, a voting member and New York Fed president, carries more pricing weight than comparable remarks from a non-voting regional president.
The distinction between what these numbers do and do not tell you matters:
| What FedWatch measures | What FedWatch does not measure |
|---|---|
| Current market sentiment | Fed commitment or intention |
| Risk-neutral implied probability | An accurate forecast of the outcome |
| Real-time positioning | A data-grounded consensus |
| Short-term volatility in expectations | The direction of policy |
MarketWatch captured the risk of taking the numbers at face value.
Traders expecting a back-to-back rate hike from the Fed in October “may have gotten ahead of themselves.”
Evercore ISI reached a similar conclusion, judging that Williams “clearly put the brakes on back-to-back increases in October” and that December “now looks more likely.”
The takeaway for you is that a FedWatch number is a snapshot of the crowd, not a preview of the decision. Treating a 47% reading as a stable forecast understates how fast the next data release can flip it. Readers who grasp the mechanics avoid overreacting to the next swing, because they understand the swing was always possible.
What the October 2 jobs report could do to these odds
Everything discussed so far is context. The single highest-impact variable still in play is the September nonfarm payrolls report, due 2 October, and it carries a clear asymmetric read.
Consensus forecasts sit in a narrow band: 84,000 jobs per Reuters’ Morning Bid column on 28 September, and 90,000 per TradingEconomics on 30 September. The unemployment rate is expected to hold near 4.1%, signalling a labour market that has cooled but not broken.
At this level, the direction of the surprise matters more than the headline number. DBS Group Research economist Eugene Leow identifies 90,000 as a figure that could meaningfully shift rate hike odds in either direction, framing it as a genuine two-way catalyst rather than a directional bet.
Three scenarios frame the likely reaction:
- Strong beat: a print well above 90,000 would reinforce the tightening case and likely push odds materially higher.
- On-consensus: a number in the 84,000-90,000 range keeps the split roughly intact, leaving Williams’s “no urgency” framing in place and the debate unresolved.
- Miss: a materially weaker print would likely pull odds lower and tilt the balance toward a December-only move.
What that means for your positioning
The 2 October release is not just another data point. It is the moment the current 47% split starts resolving toward one side, with roughly 46-47% priced for a hike and about 54% for a hold as of 30 September, per DeFiRate and DBS Group Research.
Against the longer-run backdrop, remember that UBS has priced roughly 91 basis points of cumulative hikes over the coming year. Even an on-consensus print will be read through that lens. If you hold Treasuries, rate-sensitive equities, or anything exposed to the cost of capital, your positioning should reflect that this binary lands before you can react to it, not after.
What the 47% split tells you before the October meeting arrives
A near-even probability is not an invitation to sit still. It is a signal that the range of outcomes is wide and that rate-sensitive exposure carries real near-term variance.
Three variables will decide whether October ends in a hike or a hold. Keep them on a short watchlist over the coming weeks:
- The 2 October jobs report: the immediate swing factor, with consensus at 84,000-90,000 and the direction of surprise the thing to watch.
- Fed communication after 2 October: any further remarks in the days following the print, given how much Williams’s single speech moved the odds.
- Remaining inflation data: CPI, PCE, and PMI releases still scheduled before the meeting, any of which can reprice the odds quickly.
Be clear about what the 47% reading does and does not tell you. It reflects roughly balanced sentiment, maximum data sensitivity, and no institutional consensus. It does not reveal the Fed’s actual intention or the likely market reaction to either outcome.
Williams framed one further hike “late this year” as conditional on the data, and Evercore ISI reads December, the meeting that comes with updated projections, as now more likely than the 27-28 October decision. Neither view settles the question.
At near-parity odds, the cost of being wrong runs symmetric in both directions. That makes preparation for both outcomes more valuable than any attempt to call the number. Reading the jobs report with a clear framework matters more here than it would in a low-uncertainty environment, because the distribution of outcomes is genuinely wide.
Investors wanting to map the full portfolio impact of a sustained tightening cycle will find our deep-dive into Treasury yield repricing across asset classes, which covers how a move from 5% to 6% on the 10-year would compress equity multiples, push mortgage rates higher, and reset fixed income duration positioning.
This article is for informational purposes only and should not be considered financial advice. Investors should conduct their own research and consult with financial professionals before making investment decisions.
Past performance does not guarantee future results. Financial projections are subject to market conditions and various risk factors. Probability figures from futures and prediction markets reflect risk-neutral measures and are not official Fed forecasts or commitments.