
Most borrowers watch the Federal Reserve. The rates that shape your mortgage and your retirement savings are set somewhere else: by the buyers of long-term Treasury yields, who are now demanding more compensation than at any point in over two decades. On 5 October 2026, the 10-year Treasury touched 5.349% and the 30-year hit 5.703% intraday, levels CNBC reported had not been seen since 2002.
Yesterday, 14 October, the 10-year sat at 5.19% and the 30-year at 5.525%, according to CNBC. That is a little calmer, but still near the top of a range most investors have never lived through.
The sell-off reaches well beyond bond portfolios, into mortgages, car loans, corporate debt and the borrowing costs of foreign governments. The next major checkpoint arrives on 4 November, when the US Treasury publishes its quarterly refunding statement.
Here is a clear picture of who stopped buying, what Treasury is doing about it, and why one piece of arithmetic, known as r versus g, sits behind the growing worry about US debt.
Why do long-term Treasury yields reach into your mortgage, car loan and retirement account?
Start with your own monthly payment. A Treasury yield is the annual return a buyer earns for lending money to the US government. Neither the government nor the Fed sets it; buyers do, and when they demand more compensation, the yield rises.
Nearly every other loan is priced as that Treasury yield plus a spread. A spread is the extra interest a lender charges above the government rate to cover the borrower’s risk.
| Security | Yield on 14 October | Recent intraday high | Last seen |
|---|---|---|---|
| 10-year Treasury | 5.19% | 5.349% (5 October) | April 2002 |
| 30-year Treasury | 5.525% | 5.703% (5 October) | Late May 2002 |
The original source behind this coverage dated the last comparable level to 2007, but CNBC and Reuters market data place it in 2002.
What it means at home
The 10-year is the main benchmark for 30-year fixed mortgages, though the gap between the two also depends on demand for mortgage-backed securities (MBS), which are bundles of home loans sold to investors, and on bank funding costs. Widen the circle and the same mechanism repeats across the economy.
| Borrower | How Treasury yields feed in | Effect of higher yields |
|---|---|---|
| Homebuyers | 10-year benchmark plus mortgage spread | Higher fixed mortgage rates |
| Car buyers | Lender funding costs plus credit spread | Higher base rate on auto loans |
| Companies | Treasury yield plus credit spread | A 100 bp rise with unchanged spreads makes a new 10-year bond roughly 100 bp costlier |
| Commercial property | Valuations discounted at Treasury-linked rates | Lower prices, dearer refinancing |
| States and municipalities | Debt trades at spreads over Treasuries | Higher absolute borrowing costs |
| Pensions and insurers | Liabilities discounted at government yields | Funded status can improve, but leveraged hedges may face collateral stress |
A basis point (bp) is one hundredth of a percentage point. The takeaway is simple: a move in the 10-year is effectively a move in the price of your own borrowing, even if the Fed has not touched its policy rate.
Your lender starts from the 10-year yield and adds a spread of roughly two percentage points, so the bond market effectively writes the number on your mortgage rate sheet before the Fed says anything.
What it means abroad
Treasuries serve as the world’s risk-free reference rate. When US yields climb, capital flows toward dollars, hedging costs rise, and other governments must offer more to attract lenders. A Bloomberg chart cited in the source shows yields rising from below 1% in 2022 to roughly 6%, a figure taken from that chart rather than from official data.
When big ASX news breaks, our subscribers know first
Who stopped buying: Japan, the Fed and a heavier supply of debt
If yields rise when buyers want more pay, the obvious question is which buyers stepped back. The answer involves three suspects, and none of them is acting alone.
Japan comes home
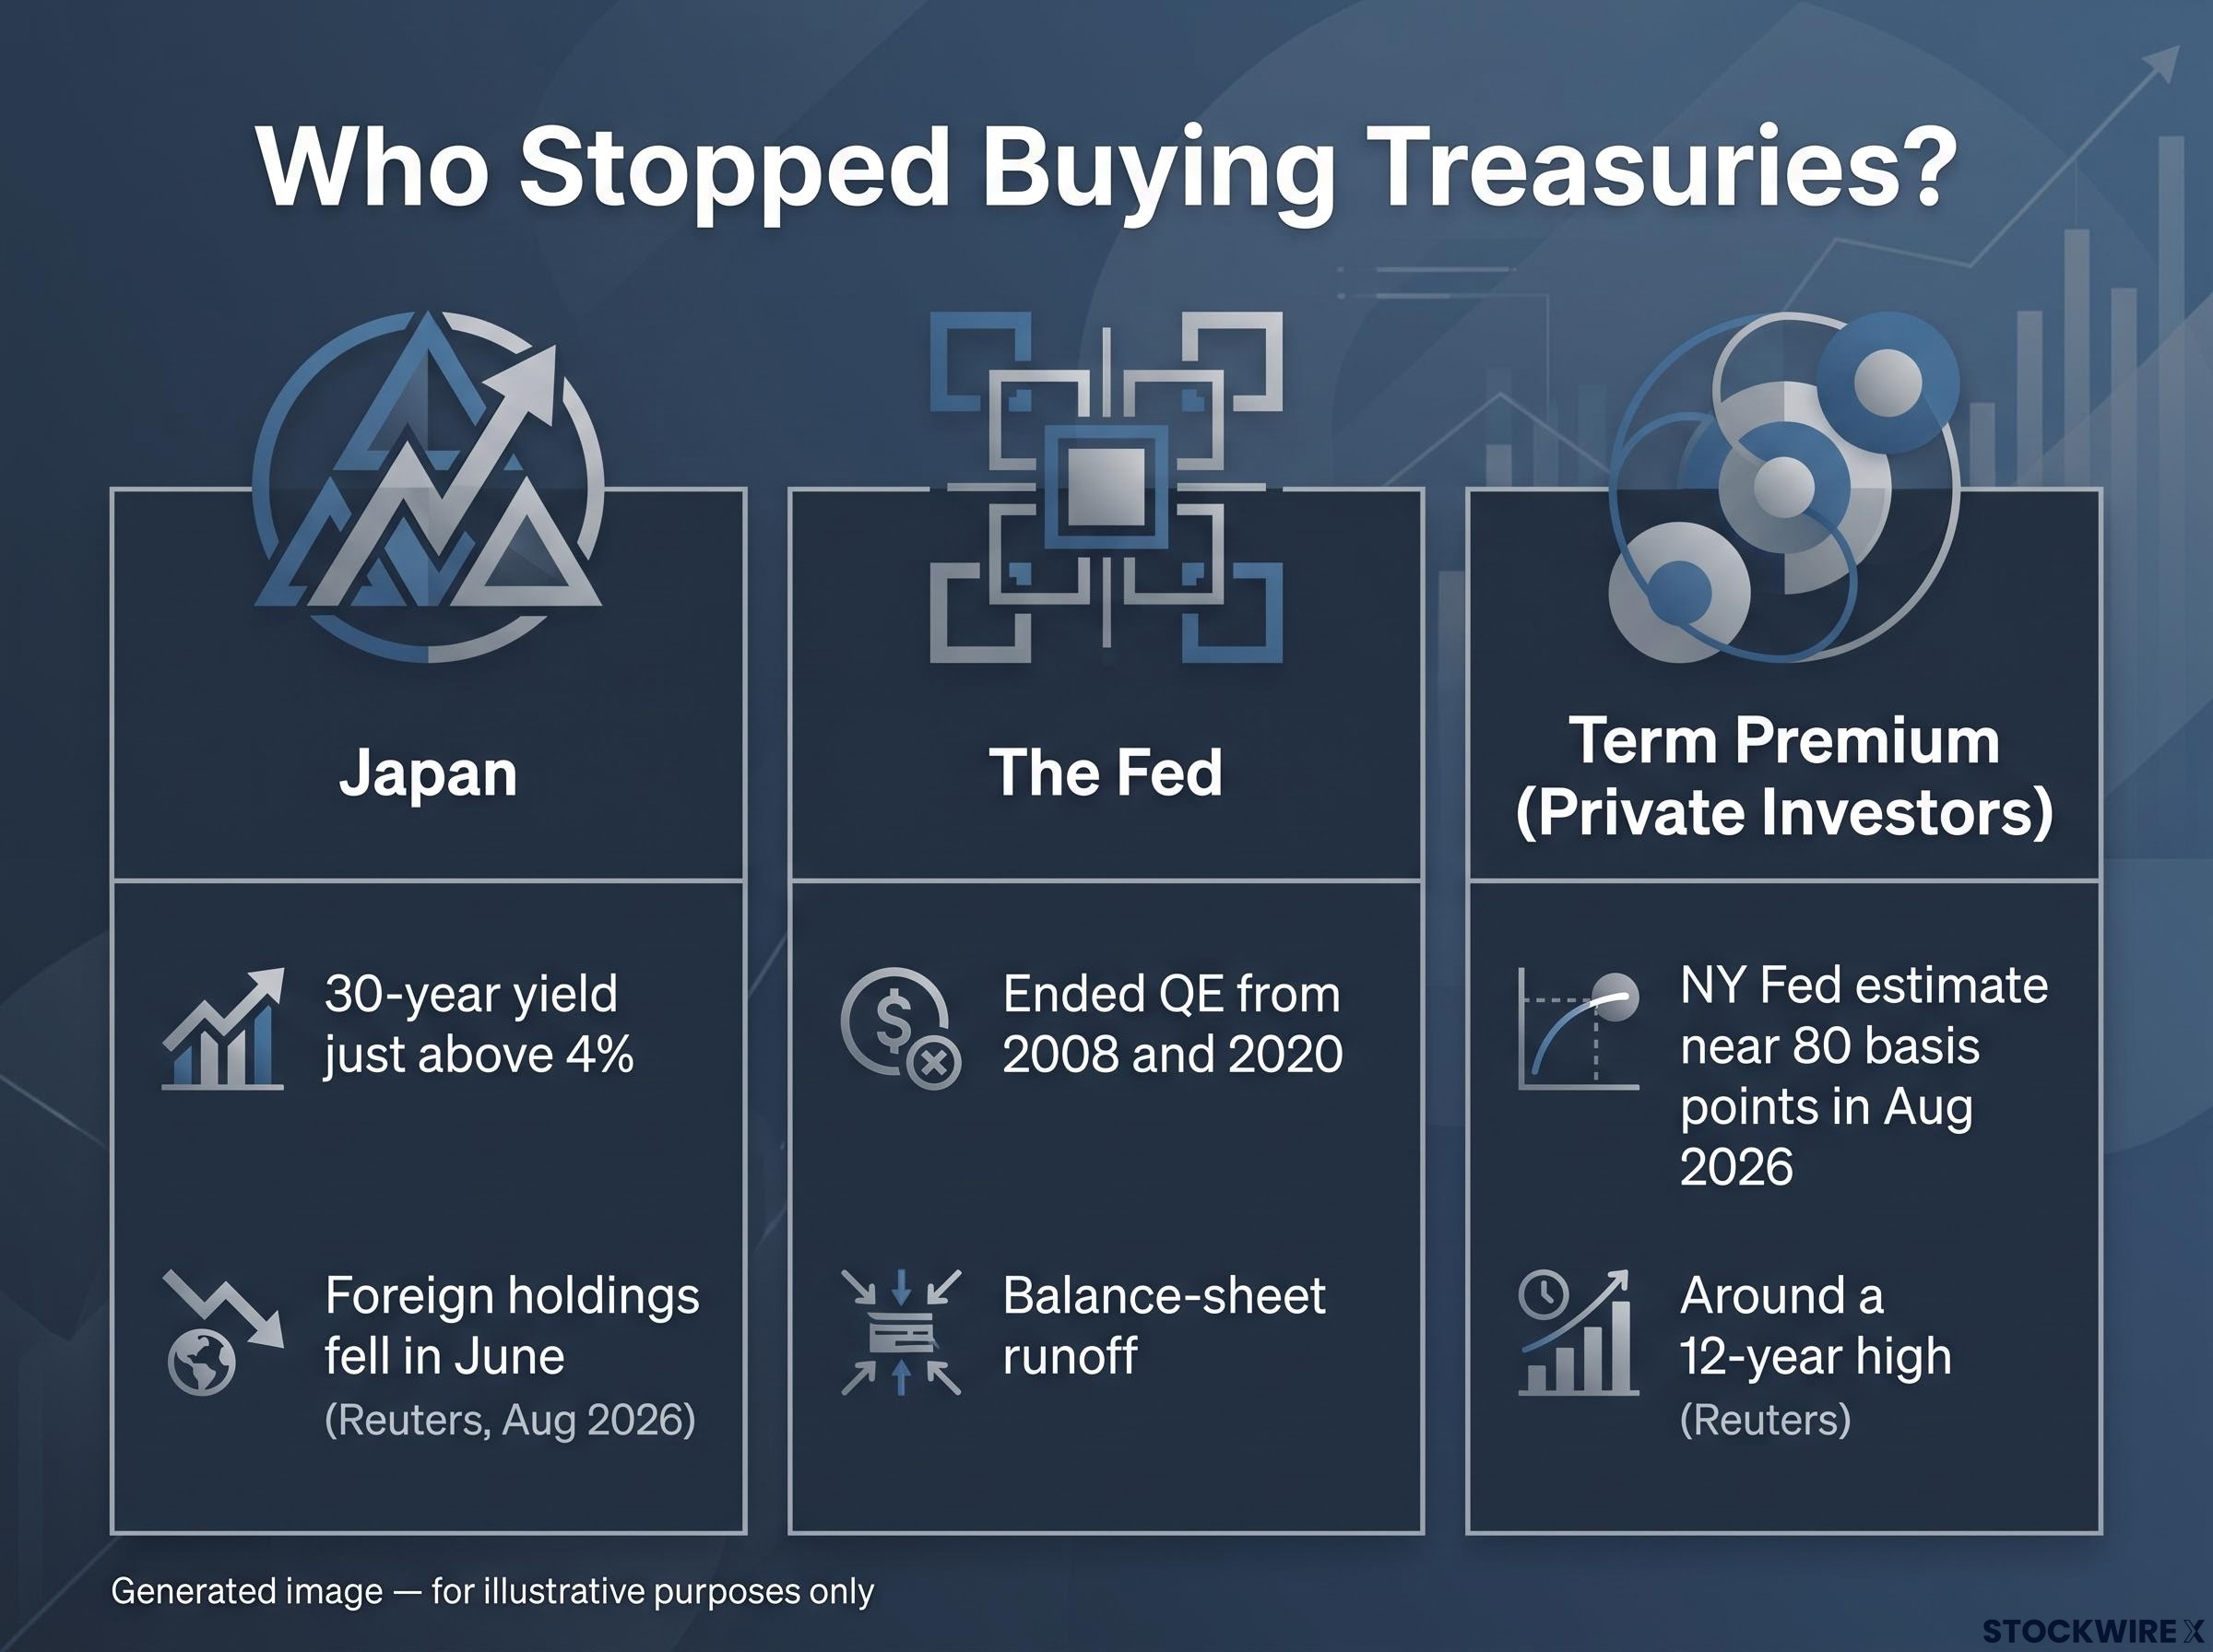
Japan has long been the largest foreign holder of Treasuries. Reuters reported in August 2026 that foreign holdings fell in June, led by Japan, the UK and China.
The motive is straightforward. As the Bank of Japan raises rates, Japan’s 10-year yield has reached a three-decade high and its 30-year sits just above 4%. Once the cost of hedging currency risk is counted, the advantage of buying Treasuries has narrowed, so Japanese money is staying home.
The Fed steps back
The Fed bought Treasuries heavily after 2008 and again in 2020 through quantitative easing (QE), creating money to purchase bonds. That demand cared little about price. Today the Fed is not buying.
Its balance-sheet runoff lets bonds mature without full reinvestment. That is not active selling, but it removes a large marginal buyer and leaves private investors to absorb more debt.
The term premium explained
The term premium is the extra return investors demand for holding a long-dated bond instead of rolling over short-term ones. It rises when supply is heavy and willing buyers are scarce.
Term premium snapshot The New York Fed’s estimate stood near 80 basis points in August 2026, around a 12-year high, according to Reuters.
Not everyone reads the evidence the same way.
| Source | Mechanism emphasised | Camp |
|---|---|---|
| New York Fed (via Reuters) | Higher term premium, inflation uncertainty, fiscal risk | Mixed |
| Citi | Long-end supply too heavy for demand | Market-technical |
| Fiscal economists | Persistent deficits make issuance structurally larger | Structural fiscal |
For you, the point is that this sell-off need not signal a credit scare. It can simply reflect a market where the marginal buyer wants more pay to hold long maturities, which changes how you should read alarming yield headlines.
Buybacks, bills and the November 4 refunding: what is Treasury doing about it?
Treasury’s answer to the demand gap came as a promise of smoother markets. The evidence so far is mixed.
How the buybacks work
On 19 August 2026, Treasury raised its long-end buyback operations from up to $2 billion to at least $4 billion each, covering the 10-to-20-year and 20-to-30-year sectors from 9 September to 4 November. A buyback is Treasury repurchasing older, less-traded bonds to make them easier to trade. It does not reduce total borrowing.
| Operation or allocation | Amount |
|---|---|
| Previous long-end operation size | Up to $2B |
| New operation size | At least $4B |
| 10 September operation announced | Up to $6B |
| 10 September amount purchased | $5.187B |
| Quarterly liquidity-support allocation | $38B |
| Cash-management allocation | $25B |
| Maximum after added operations (Reuters) | About $83B |
Treasury Secretary Scott Bessent defended the programme in congressional testimony as a market-functioning measure. Yet yields hit new highs despite a roughly $6 billion buyback that same day, and senators later asked whether Treasury might fund larger buybacks from its cash account.
The interpretations split. Treasury says the goal is liquidity; parts of Wall Street read it as an attempt to hold yields down.
The incremental support is only about $14 billion, roughly 0.04% of the Treasury market, which is why the buyback signal mattered more to the 30-year yield than the raw dollar volume did.
The shift toward bills
Citi’s base case, reported on 9 October, is that Treasury will cut both 20- and 30-year auction sizes by $3 billion each and replace that borrowing with bills, which are Treasuries maturing within a year. Citi said the 20-year auction, currently $16 billion on the calendar, could even be cancelled.
Money market funds, where ordinary savers park cash, buy most bills. The Federal Reserve Bank of San Francisco has also found that stablecoin issuers’ purchases of short-term Treasuries have grown substantially since 2023. That supports demand but concentrates it in vehicles whose balances can shift quickly.
Critics argue this masks the supply problem and adds rollover risk, because bills must be refinanced constantly. Long-bond holders have already felt the pain: the TLT exchange-traded fund has lost roughly 50% since 2020.
Treasury can change the mix of what it sells, not the total it must borrow. Relief at the long end may simply move risk toward short-term funding and your money-market balance. On 4 November, watch three things:
- Changes to 20- and 30-year auction sizes
- Guidance on future buyback sizes
- The share of borrowing shifted into bills
What is the r versus g problem, and could rates exceed growth by 2030?
Imagine a loan whose interest compounds faster than your salary grows. Even with no new spending, the debt gets heavier relative to your income. That is the government’s version of the problem.
The arithmetic
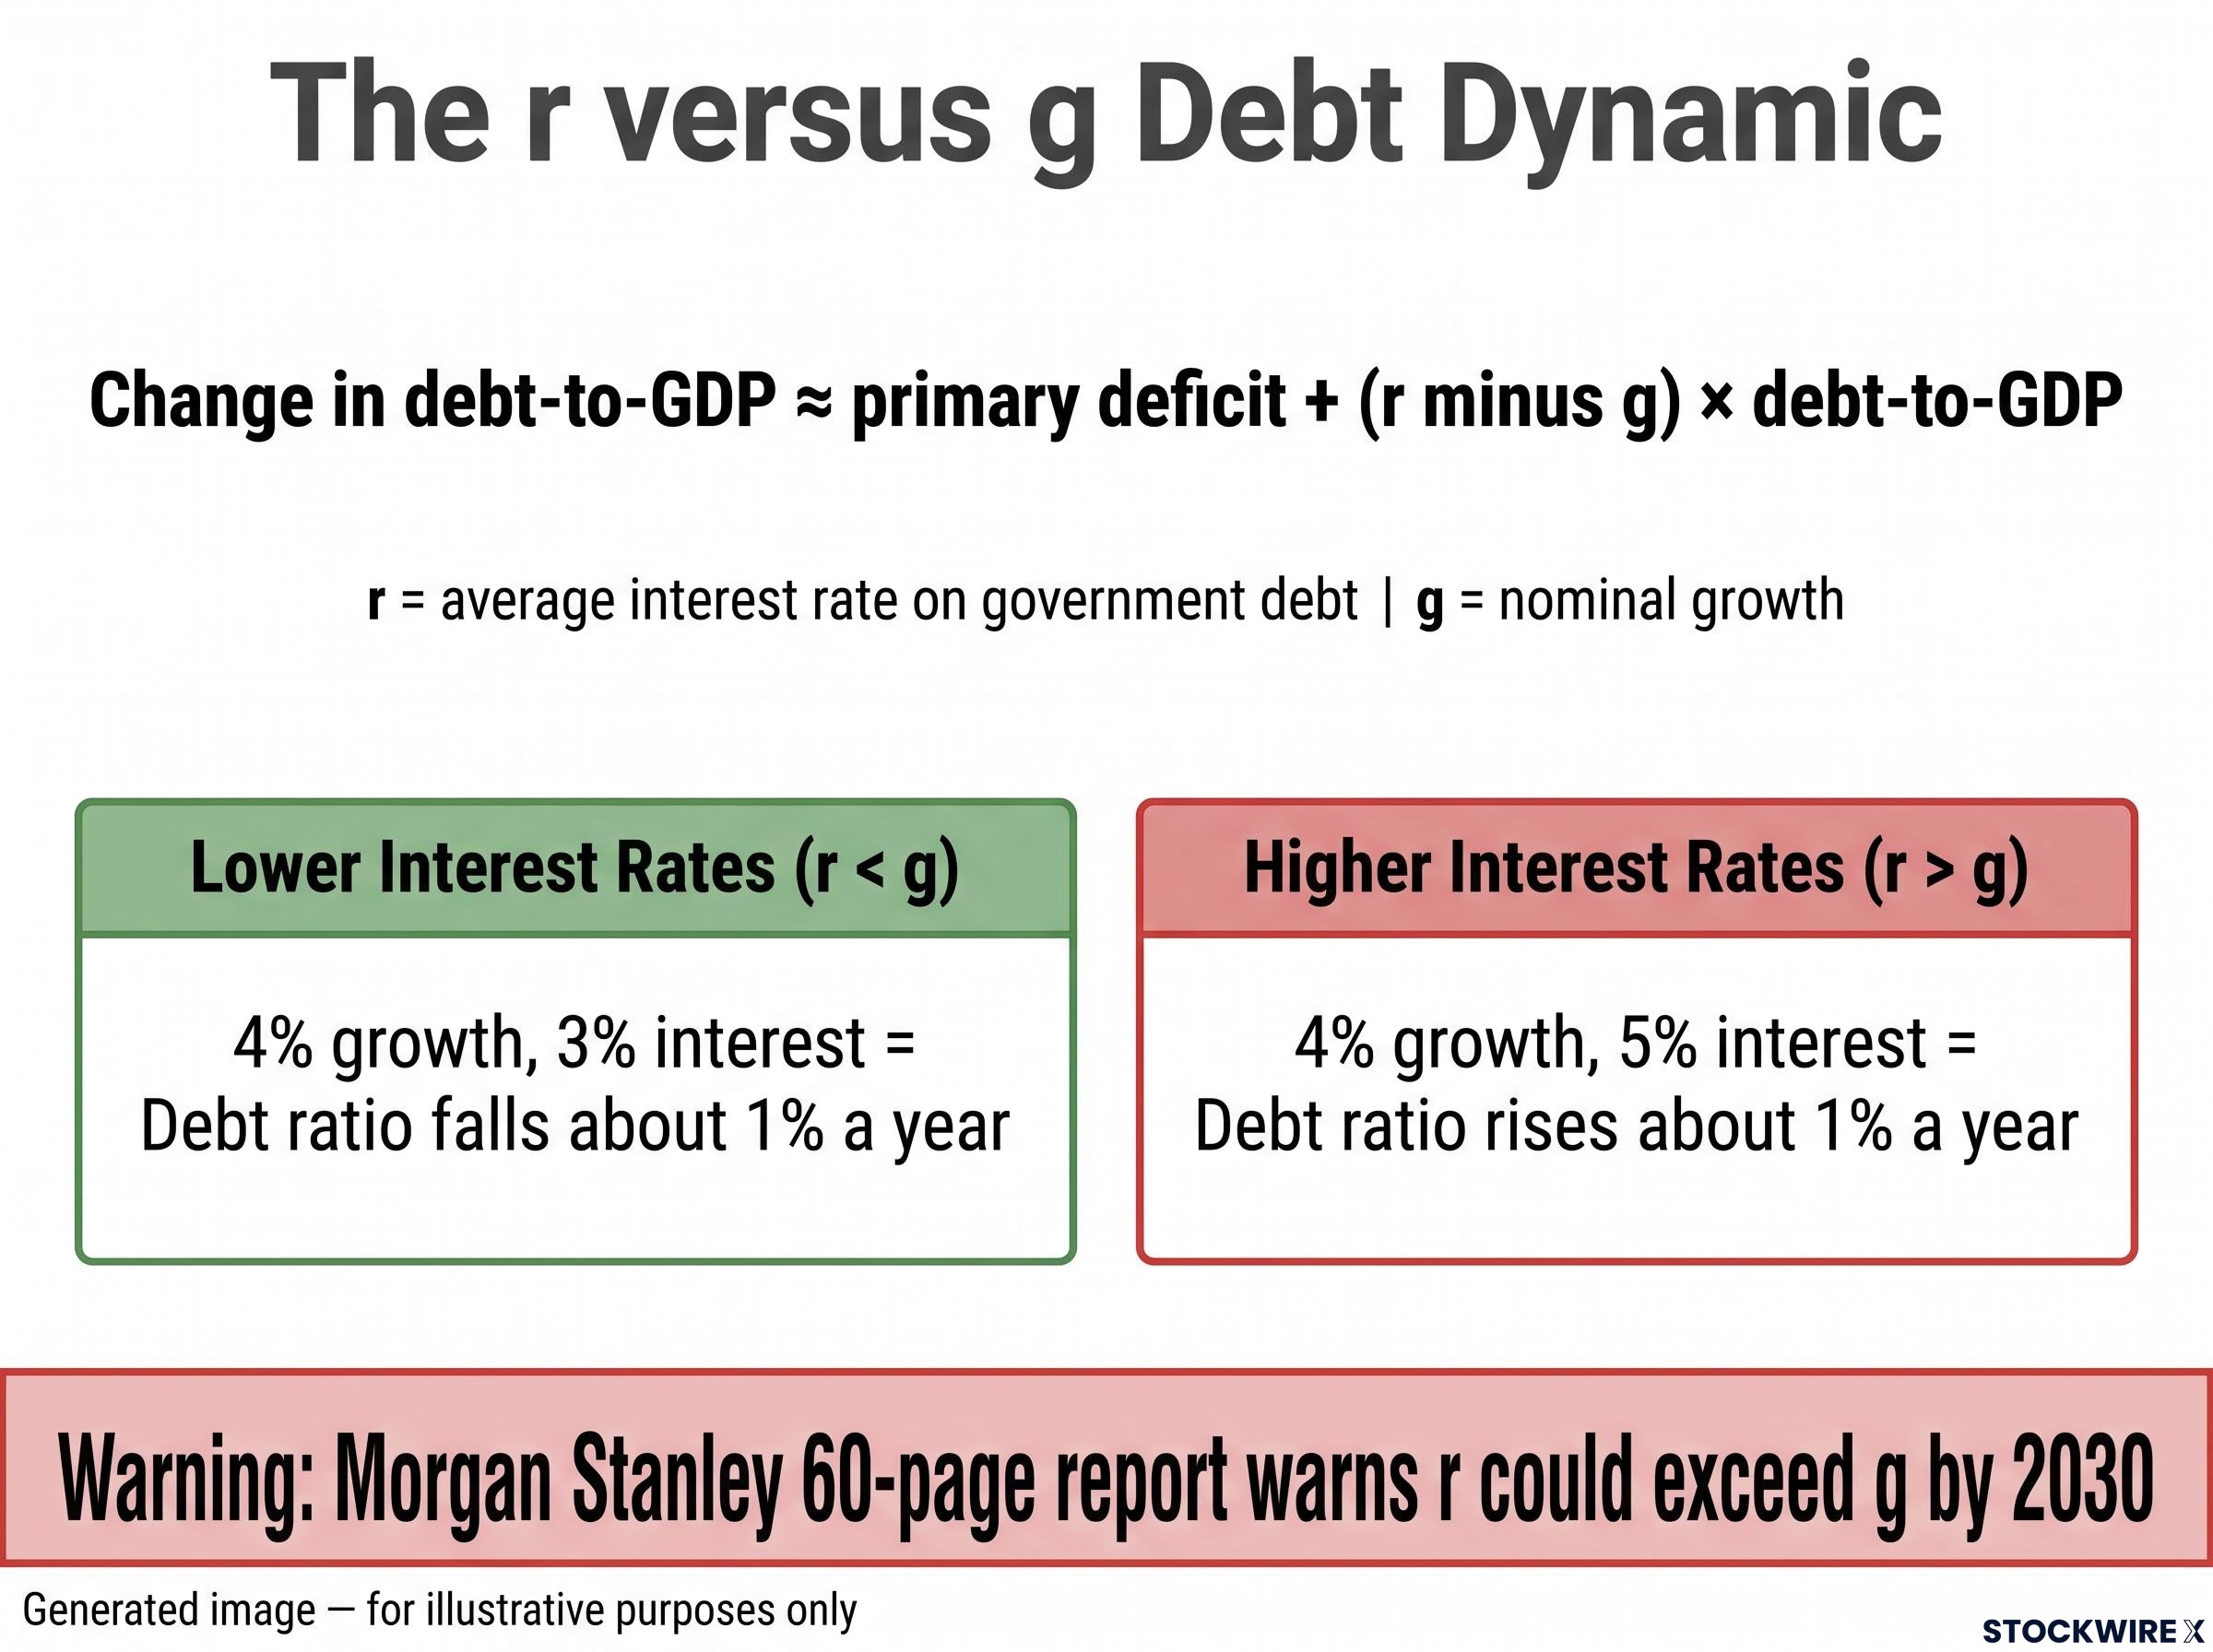
Here, r is the average interest rate on government debt and g is nominal growth, meaning economic growth including inflation.
The debt dynamics formula Change in debt-to-GDP ≈ primary deficit + (r minus g) × debt-to-GDP
The primary deficit is the shortfall before interest payments. Set it aside and run the numbers yourself: with 4% growth and 3% interest, the debt ratio falls about 1% a year. With 4% growth and 5% interest, it rises about 1% a year.
Morgan Stanley’s 2030 warning
Morgan Stanley’s economists sent institutional clients a report of about 60 pages warning that r could exceed g by 2030, or sooner if a recession hits. Treat this as a sell-side forecast, not an official projection; it assumes no recession, and the primary note is not publicly available.
Academic work points the same way. A Stanford SIEPR analysis using data through 2025 found r has risen to about the level of g as primary deficits grew, while a Vanderbilt analysis argued permanent primary deficits cannot coexist with stable debt when r exceeds g.
The case against alarm
The counterarguments carry real weight:
- In the 1950s, growth outpaced rates and the debt ratio shrank despite war debt
- r and g are not fixed; productivity, labour-force growth or inflation could lift growth
- The US borrows in its own currency
- Treasuries remain the world’s principal safe asset
These advantages may delay adjustment rather than remove it, since higher term premiums compound interest costs that eventually compete with other spending.
What past episodes teach
The 2022 UK gilt turmoil showed how leveraged pension funds facing collateral calls can turn a sell-off into a spiral. The 2023 US sell-off showed yields jumping on supply and duration concerns without any default fear. The lesson: market functioning and fiscal sustainability are separate problems.
For you, this is a slow-moving fiscal risk, not an imminent crisis. But every sustained rise in yields tilts the arithmetic further against the government.
For readers wanting the official numbers, our full explainer on US debt sustainability shows the CBO’s projected crossover of r and g around fiscal year 2031.
What the yield surge changes, and what it does not
The level of yields is best explained by weaker traditional demand meeting heavy supply. Japan is staying home, the Fed has stepped away, and private buyers want more pay to hold long bonds. Buybacks and bills address liquidity, not solvency, and r versus g remains the long-run test.
Your decision points are concrete. Watch the 4 November refunding for auction sizes, buyback guidance and the bill share. Track whether mortgage and corporate borrowing costs keep climbing, and whether the term premium keeps rising.
None of this demands panic. It does mean the price of borrowing, yours included, is being set by buyers who have become more demanding. All figures are as of mid-October 2026 and may move quickly.
This article is for informational purposes only and should not be considered financial advice. Investors should conduct their own research and consult with financial professionals before making investment decisions. Past performance does not guarantee future results. Financial projections are subject to market conditions and various risk factors, and forward-looking statements are speculative and subject to change.